Prices with context
Use a broker or market quote when available, and a transparent yield-curve model when it is not. The report labels the price source.
Define a standard fixed-rate or zero-coupon bond from its terms, even without an ISIN, database record or recent quote. Calculate price or YTM, inspect cash flows and risk, then track value, income and maturity in one focused workspace.
No account needed to calculate. Sign up only to save and track.
Stocks can be summarized by a ticker and a last price. Bonds need schedules, conventions, curves and credit context. The AllInvestView bond tracker keeps those details connected.
Use a broker or market quote when available, and a transparent yield-curve model when it is not. The report labels the price source.
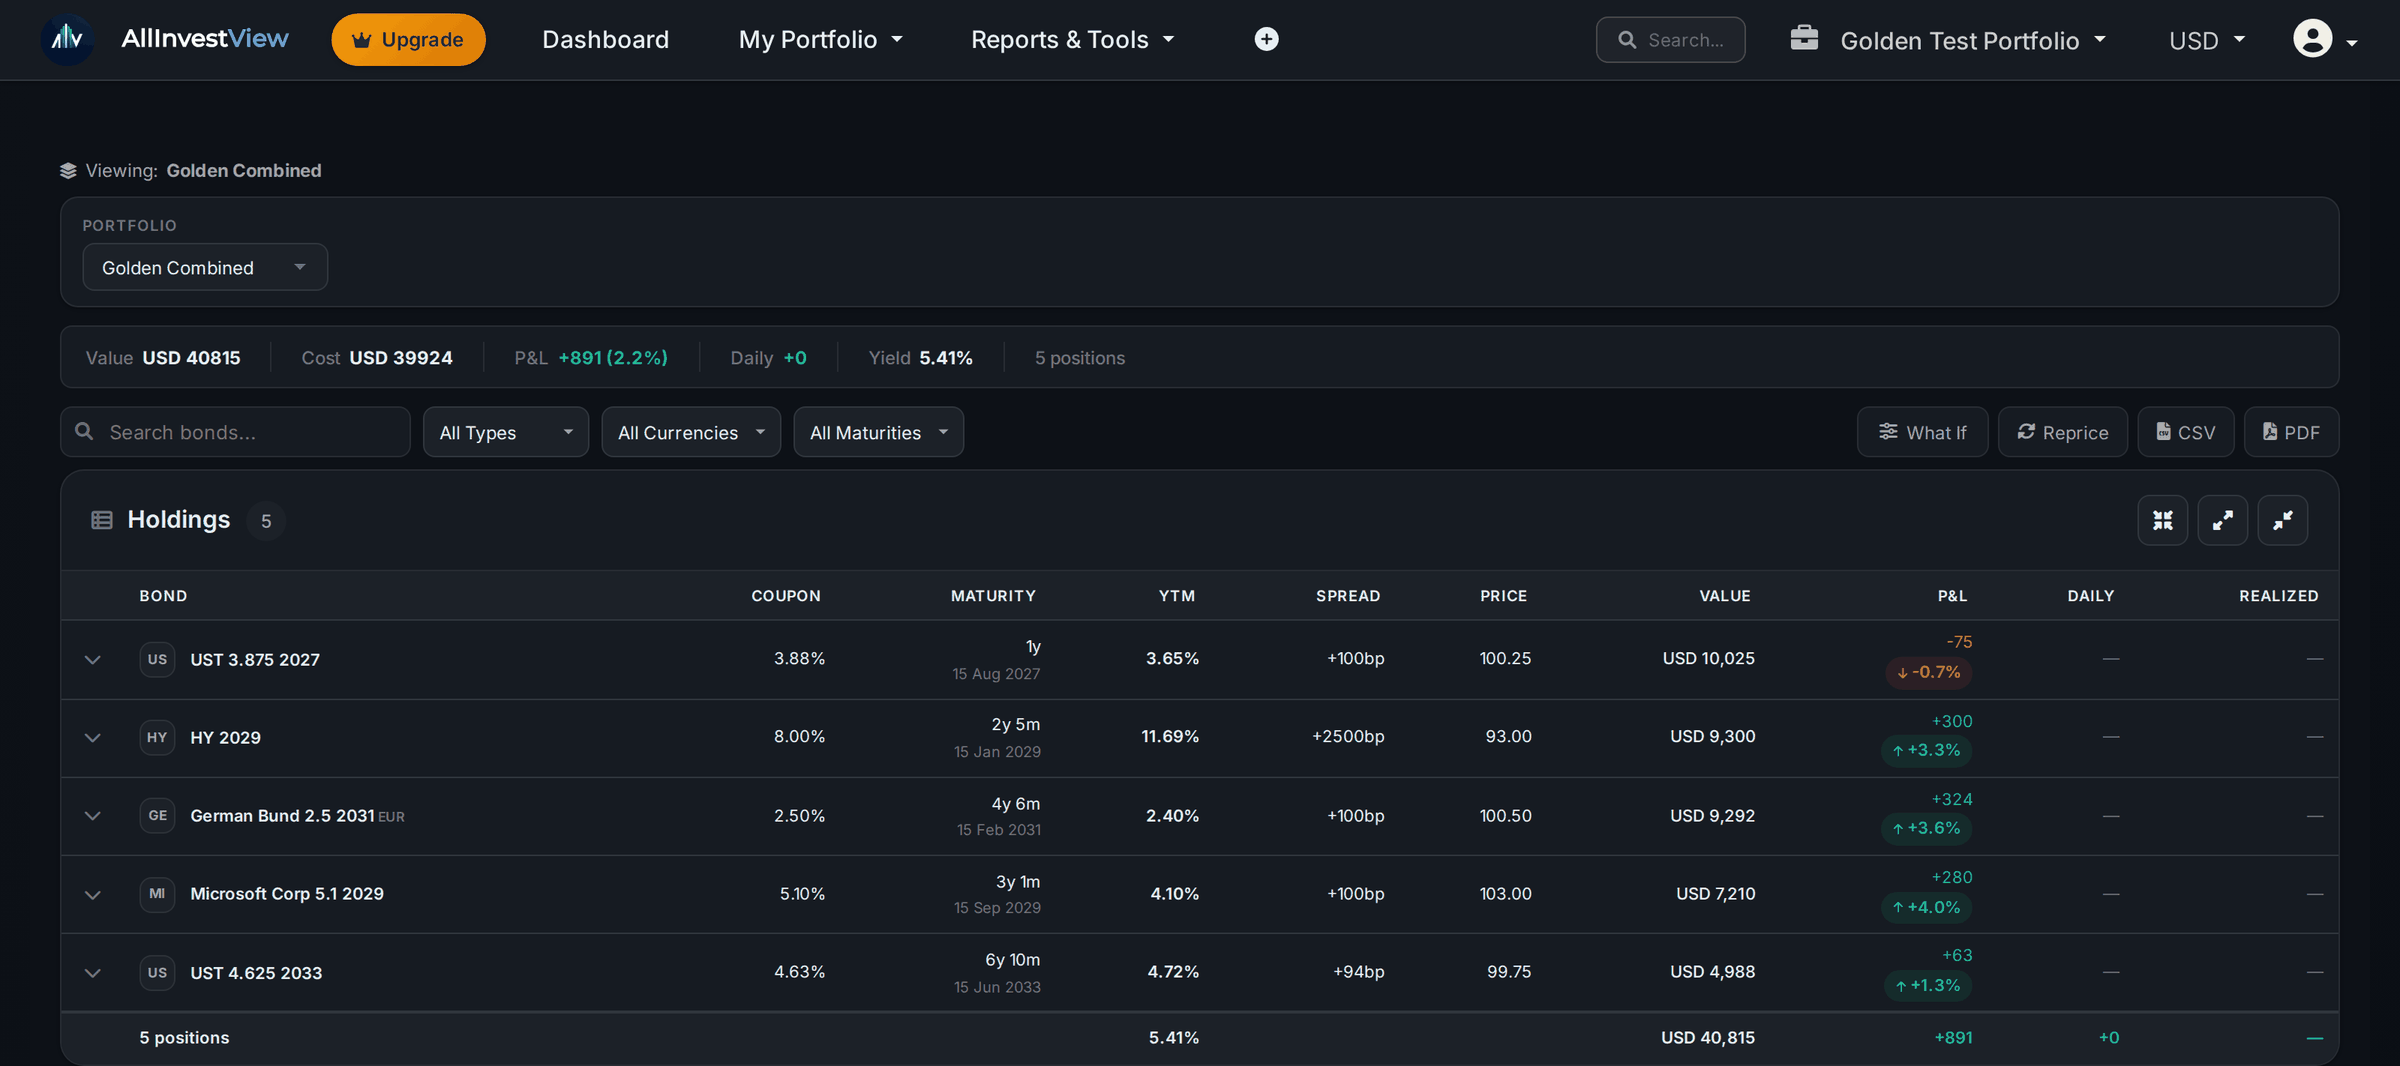
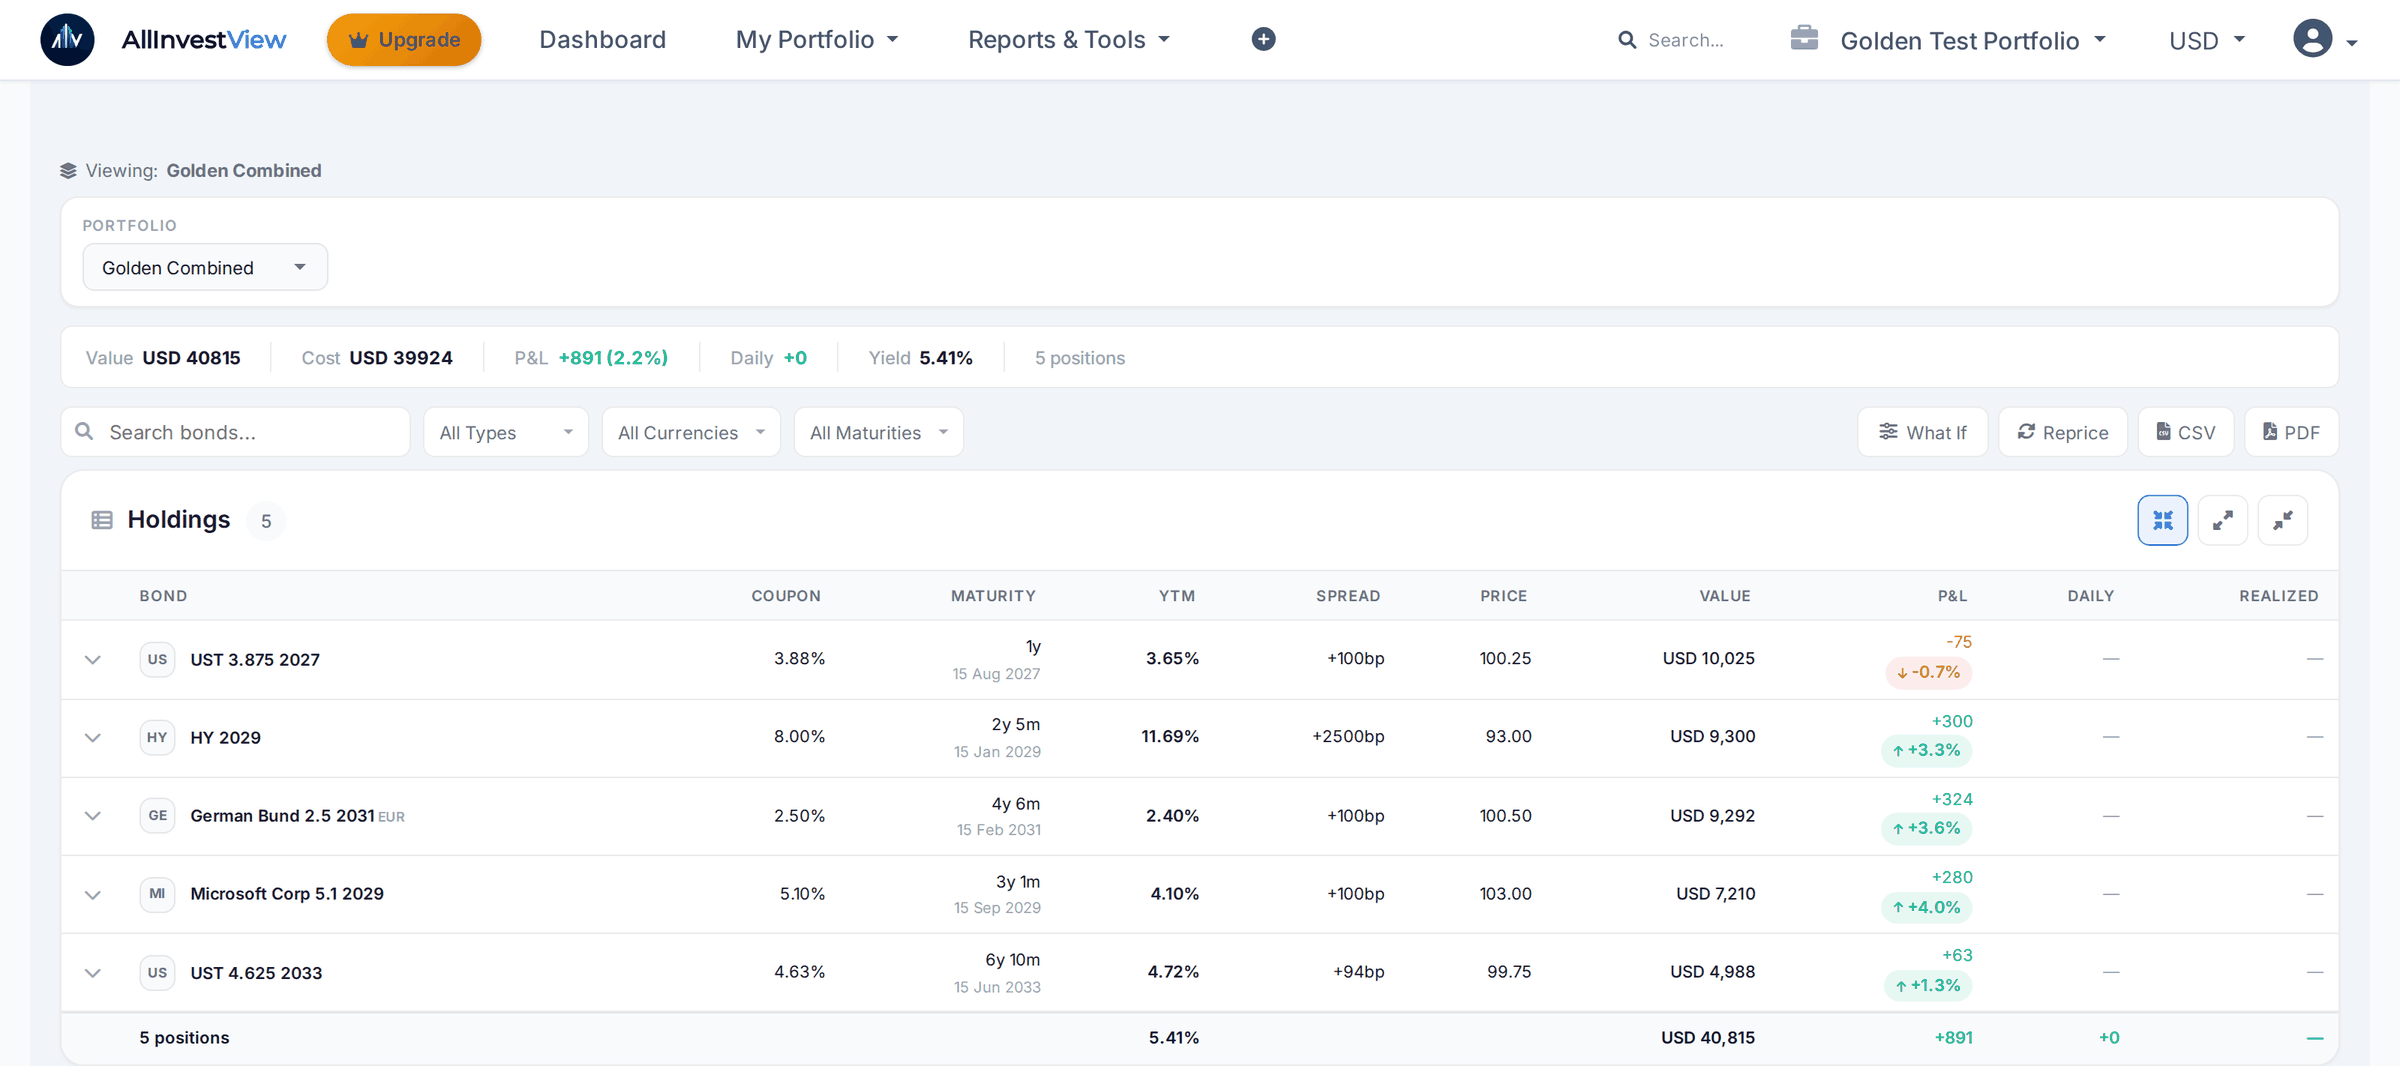
Review holdings, YTM, spreads, maturities, value, P&L and daily movement without forcing fixed income into an equity table.
Understand duration, convexity, accrued interest, current yield and benchmark exposure for every position.
Inspect coupon schedules and maturities, then see fixed income alongside the rest of your multi-asset portfolio.
Market data is useful when it exists, but it is not required to analyze a standard fixed-rate or zero-coupon bond with finite maturity.
Define: issue date, maturity, coupon, payment frequency, day count, schedule rule, stub, face value and currency.
Enter clean or dirty price to solve YTM, accrued interest, spread and rate-risk metrics.
Enter a target YTM to solve clean and dirty price, cash flows and rate-risk metrics.
Move from portfolio totals to the details behind each position. Expand a bond to inspect its trade history and see the analytics that drive its valuation.
Value, cost, P&L, daily movement, portfolio yield and position count in one summary.
Coupon, maturity, YTM, implied spread, current price and analytics for every holding.
Run What If rate scenarios, reprice holdings and export your report to CSV or PDF.
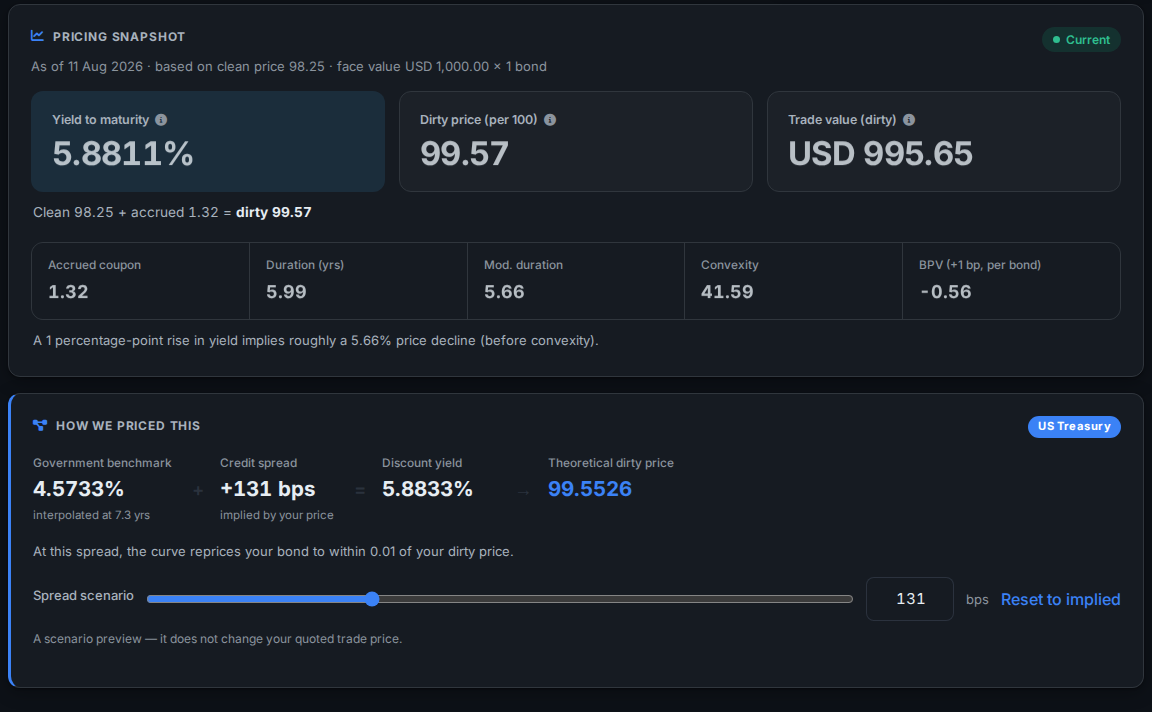
The engine first builds the bond's cash-flow schedule. With a starting price or user-set spread and a compatible benchmark, it can carry that spread over the latest available government curve to produce an inspectable model value.
Coupon, schedule, maturity, face value and day-count convention define every remaining payment.
Start with either value. The calculator solves the other and measures duration, convexity and accrued interest.
Currency selects the base benchmark. A supplied price or spread anchors the bond's margin over the matched curve point.
The latest available benchmark plus stored spread discounts the remaining cash flows into a theoretical price.
Supported automatic benchmarks include US Treasury, Government of Canada, UK Gilt, ECB AAA and Australian government curves. Eligible euro sovereign bonds receive a country-specific adjustment to the ECB term structure. Repricing requires complete terms and a valid spread anchor.
Search by issuer, bond name, ISIN or CUSIP, or define a standard fixed-rate or zero-coupon bond manually. Start from price to calculate YTM, or from yield to calculate price. No market-data match is required for the calculation.
Calculate without an account. Sign up only when you want to save the bond.
Search by name or identifier, or enter coupon, dates, frequency, convention and face value manually.
Calculate cash flows, valuation, YTM, accrued coupon, duration, convexity and curve context.
Add the trade to a portfolio and follow value, income, risk, maturity and performance in the Bond Report.
Yes. Define a standard fixed-rate or zero-coupon bond with finite maturity using its issue and maturity dates, coupon, frequency, day-count convention, schedule rule, stub, face value and currency. No identifier or database match is required.
Yes. Enter a clean or dirty price to solve yield to maturity, or enter a target YTM to solve clean and dirty price. The calculator also produces accrued interest, cash flows, duration, modified duration, convexity and BPV.
You need complete bond terms, a compatible government benchmark and either a starting price or a user-set spread. AllInvestView derives the spread over the benchmark from the price you provide, then combines the latest available benchmark with that spread to discount the remaining cash flows.
The five base benchmark families are US Treasury, Government of Canada, UK Gilt, Australian government and ECB AAA. Eligible sovereign bonds from Italy, Spain, France, Portugal, Ireland, Greece and Belgium use country-specific adjustments applied to the ECB term structure. Availability follows the latest published curve data.
The Bond Report includes value, cost, P&L, daily movement, yield to maturity, coupon, maturity, price and implied spread. Expanded analytics include duration, convexity, current yield, accrued interest and the selected benchmark curve.
Yes. You can organize bond trades across portfolios and brokers, then view them in your chosen display currency. Filters help narrow the report by bond type, currency and maturity.
Yes. You can define a bond and calculate its price, yield, payment schedule and risk metrics without an account. Create an account when you want to save the trade to a portfolio and track it over time.
A market price is an observed quote from a broker or market-data source. A theoretical price is a model value derived from the benchmark yield curve, spread and remaining cash flows. It is not an executable quote. AllInvestView labels the valuation source so you can interpret it correctly.
Bring pricing, income, risk and performance together in one portfolio.