Stop juggling
spreadsheets.
Start tracking.
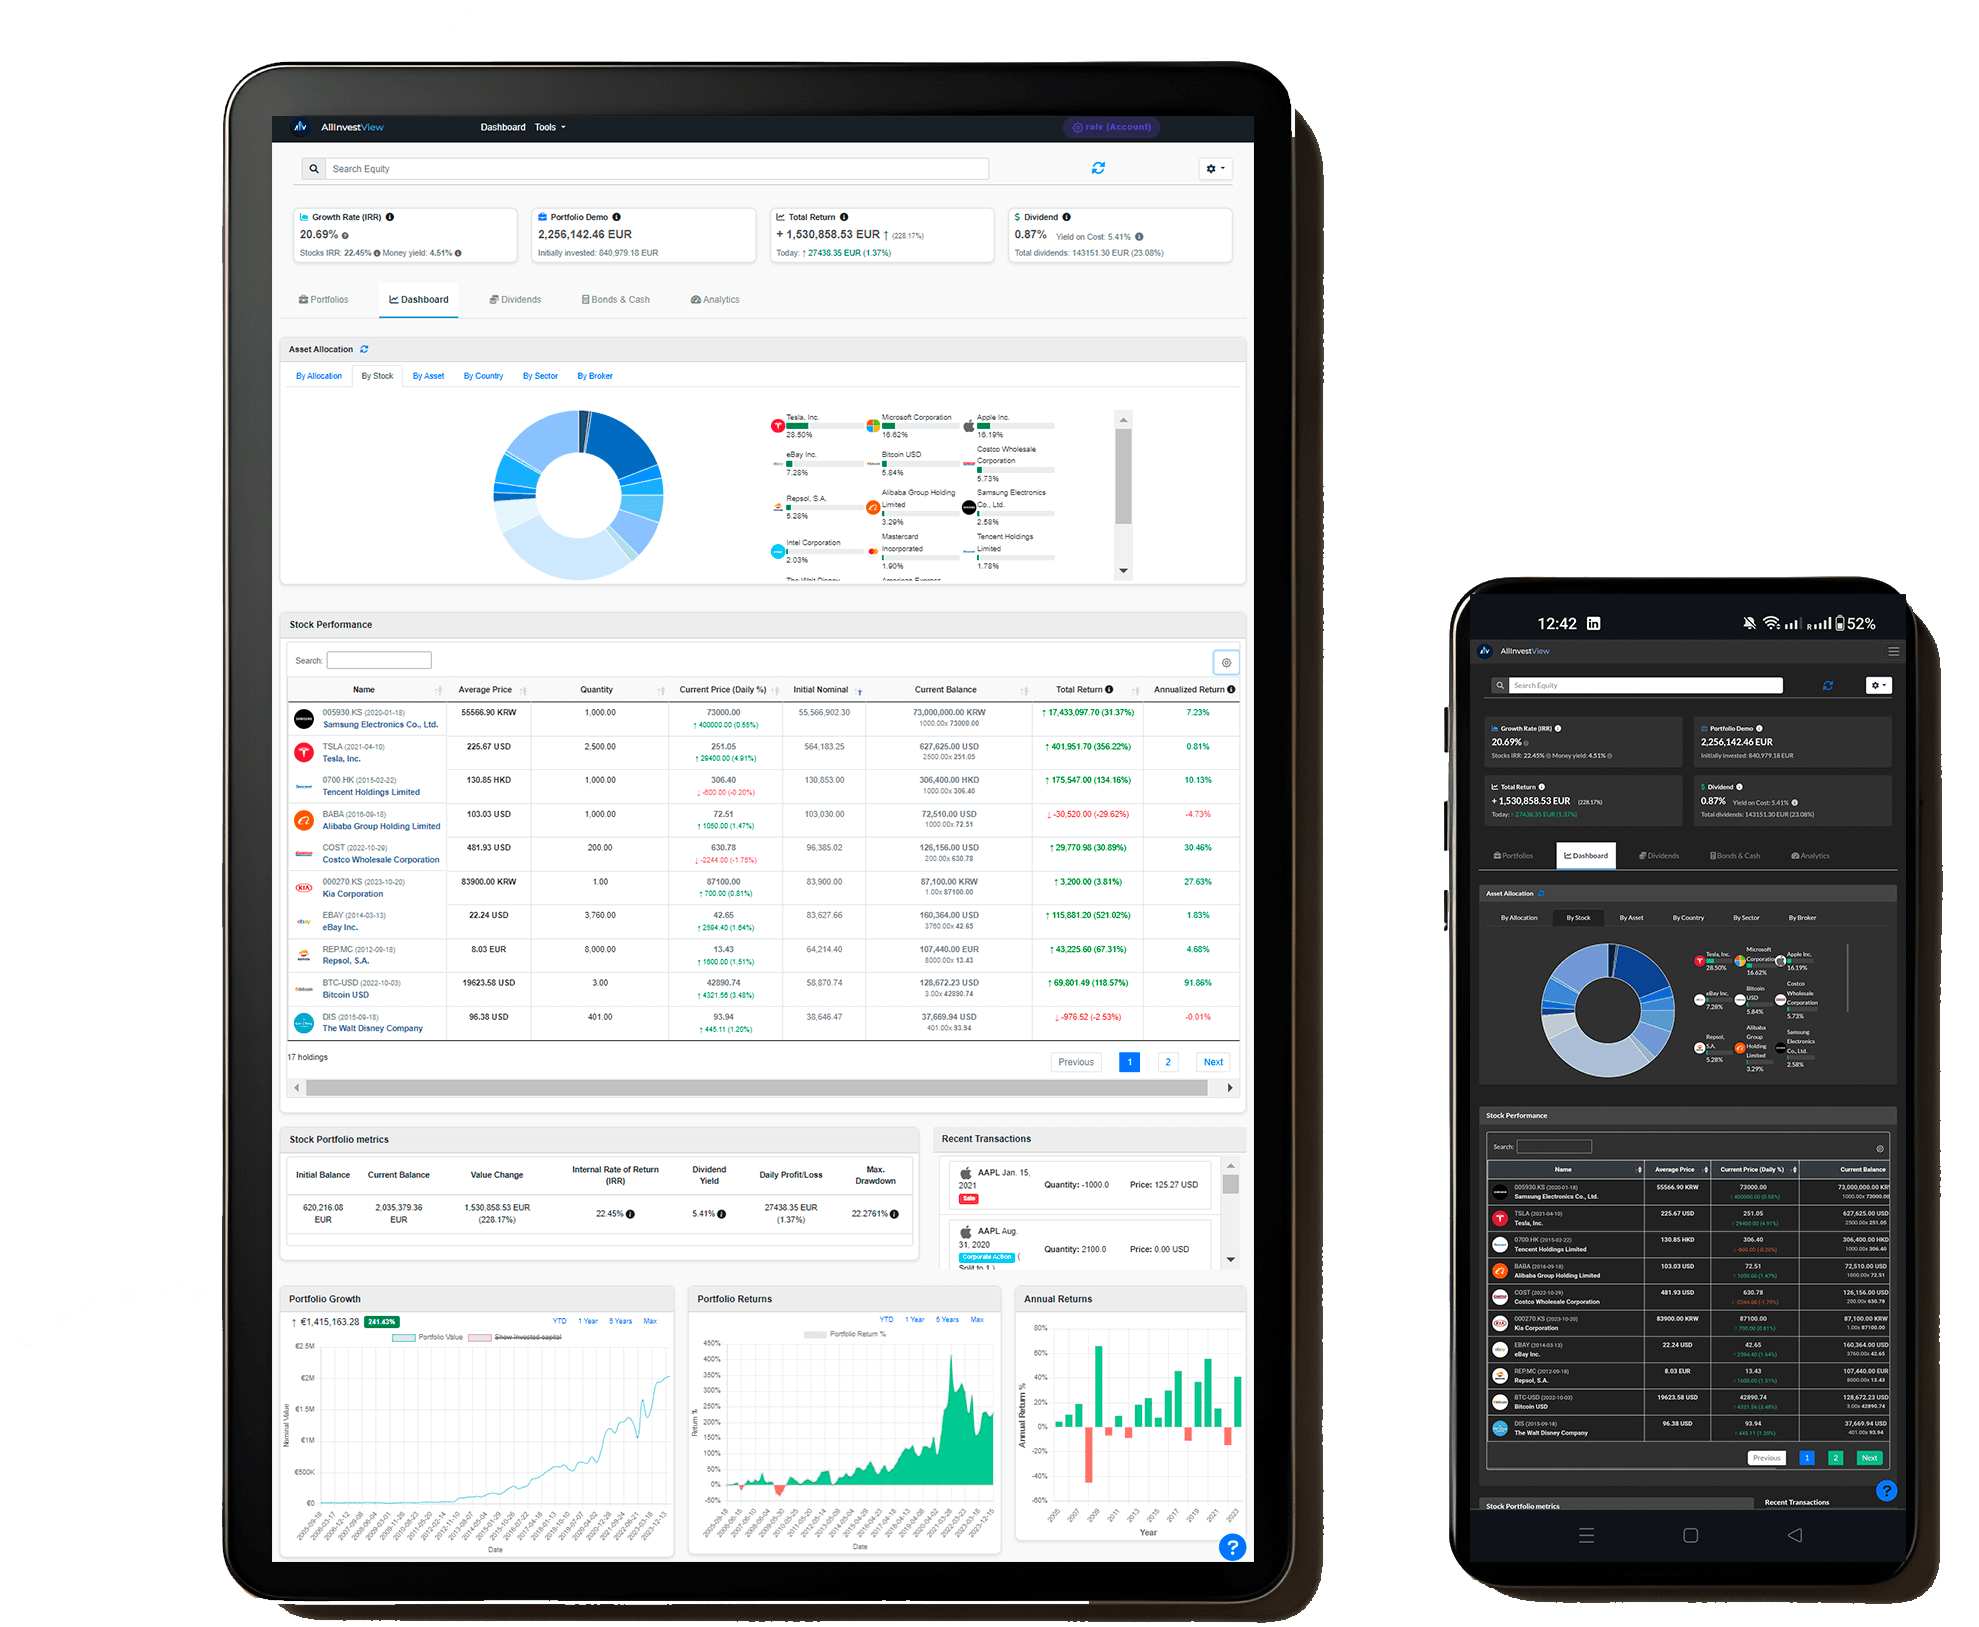
Three broker apps, two spreadsheets and a note on your phone. Sound familiar? AllInvestView pulls it all together into one live dashboard: stocks, bonds, ETFs, options, crypto and real estate.
Why you need an investment tracker
If you've ever wondered "wait, what's my actual total?" then you already know the answer.
The multi-broker headache
You open Schwab, then DEGIRO, then Trading 212, then try to add it all up in your head. It's annoying and you always miss something.
Spreadsheets don't scale
They're great until you hit 30 holdings, a stock split and a dividend reinvestment in the same week. Then the formulas break and nobody wants to fix them.
You can't manage what you can't see
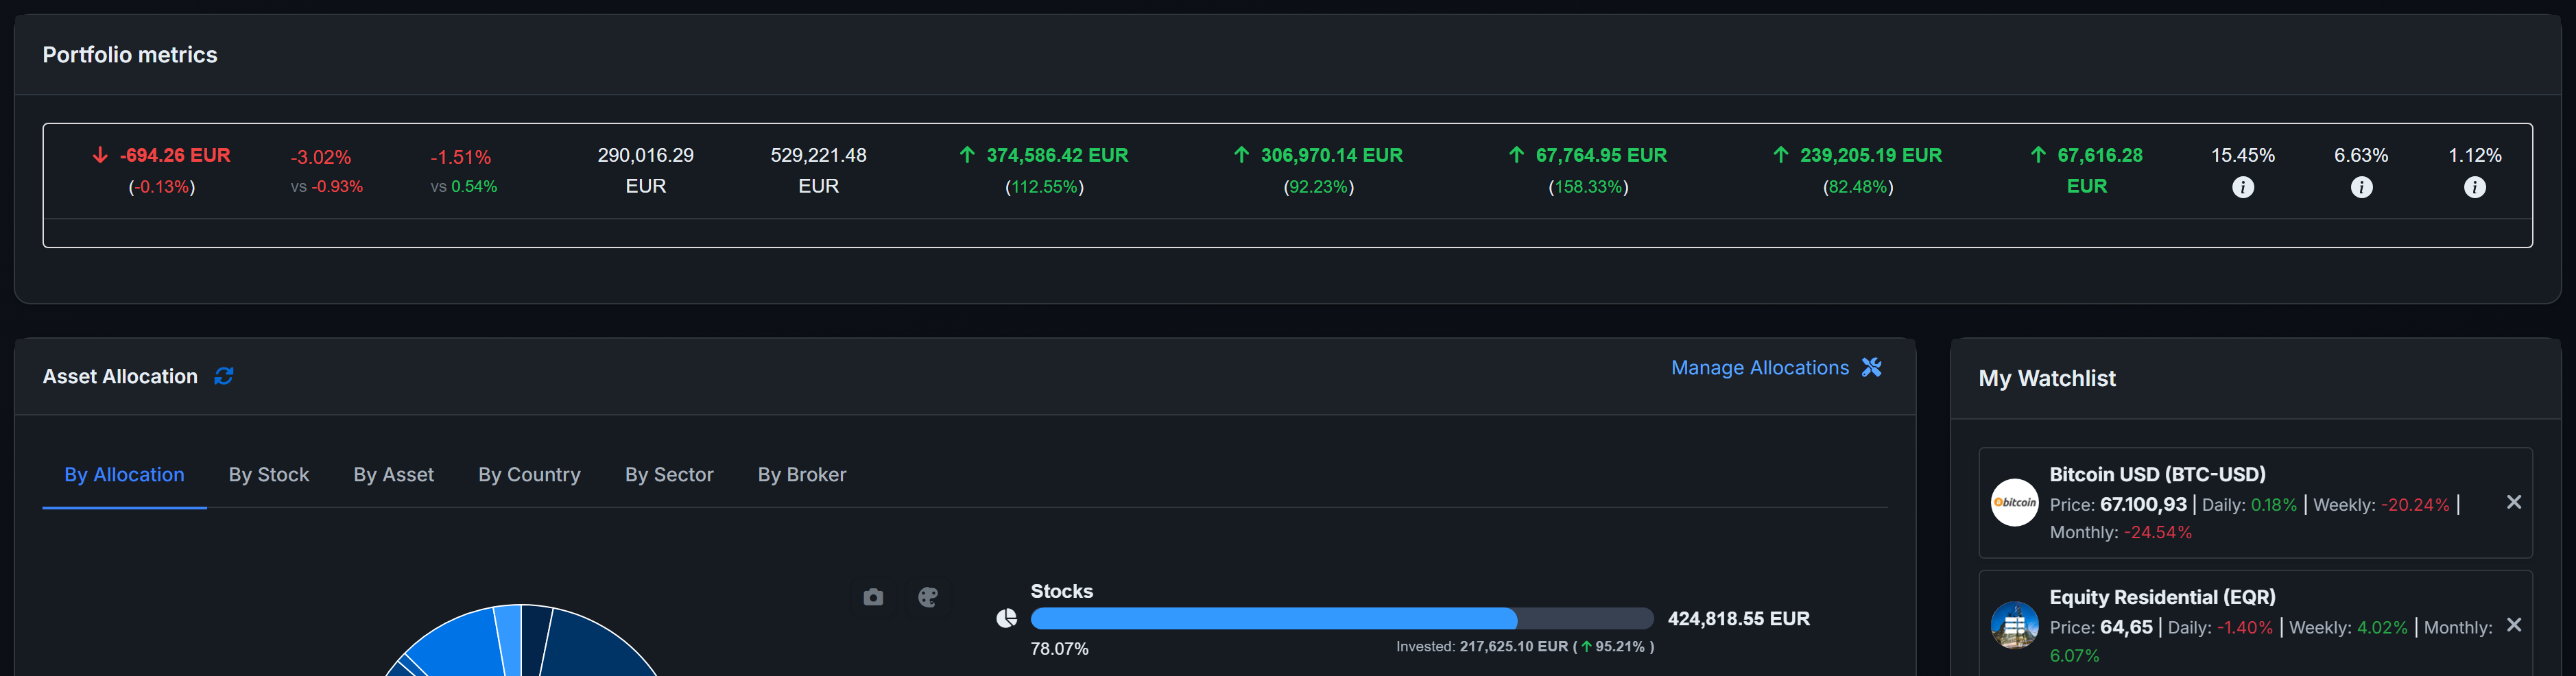
Hard to rebalance when you're guessing your allocation. Harder still to know your tax bill. Seeing everything in one place changes how you invest.
Every account. One screen.
Pension with Fidelity, ISA at Trading 212, taxable account on DEGIRO? Doesn't matter. They all show up here.
Automatic broker sync
Link Trading 212, Interactive Brokers, DEGIRO, Schwab, Revolut and 25+ others. All read-only, so we can see your holdings but never touch them.
CSV import that actually works
Drop in your broker export and we'll figure out the column mapping. No reformatting, no fiddling with headers.
Combined portfolio view
Got three separate portfolios? Merge them into one combined view to see your real allocation and total performance.
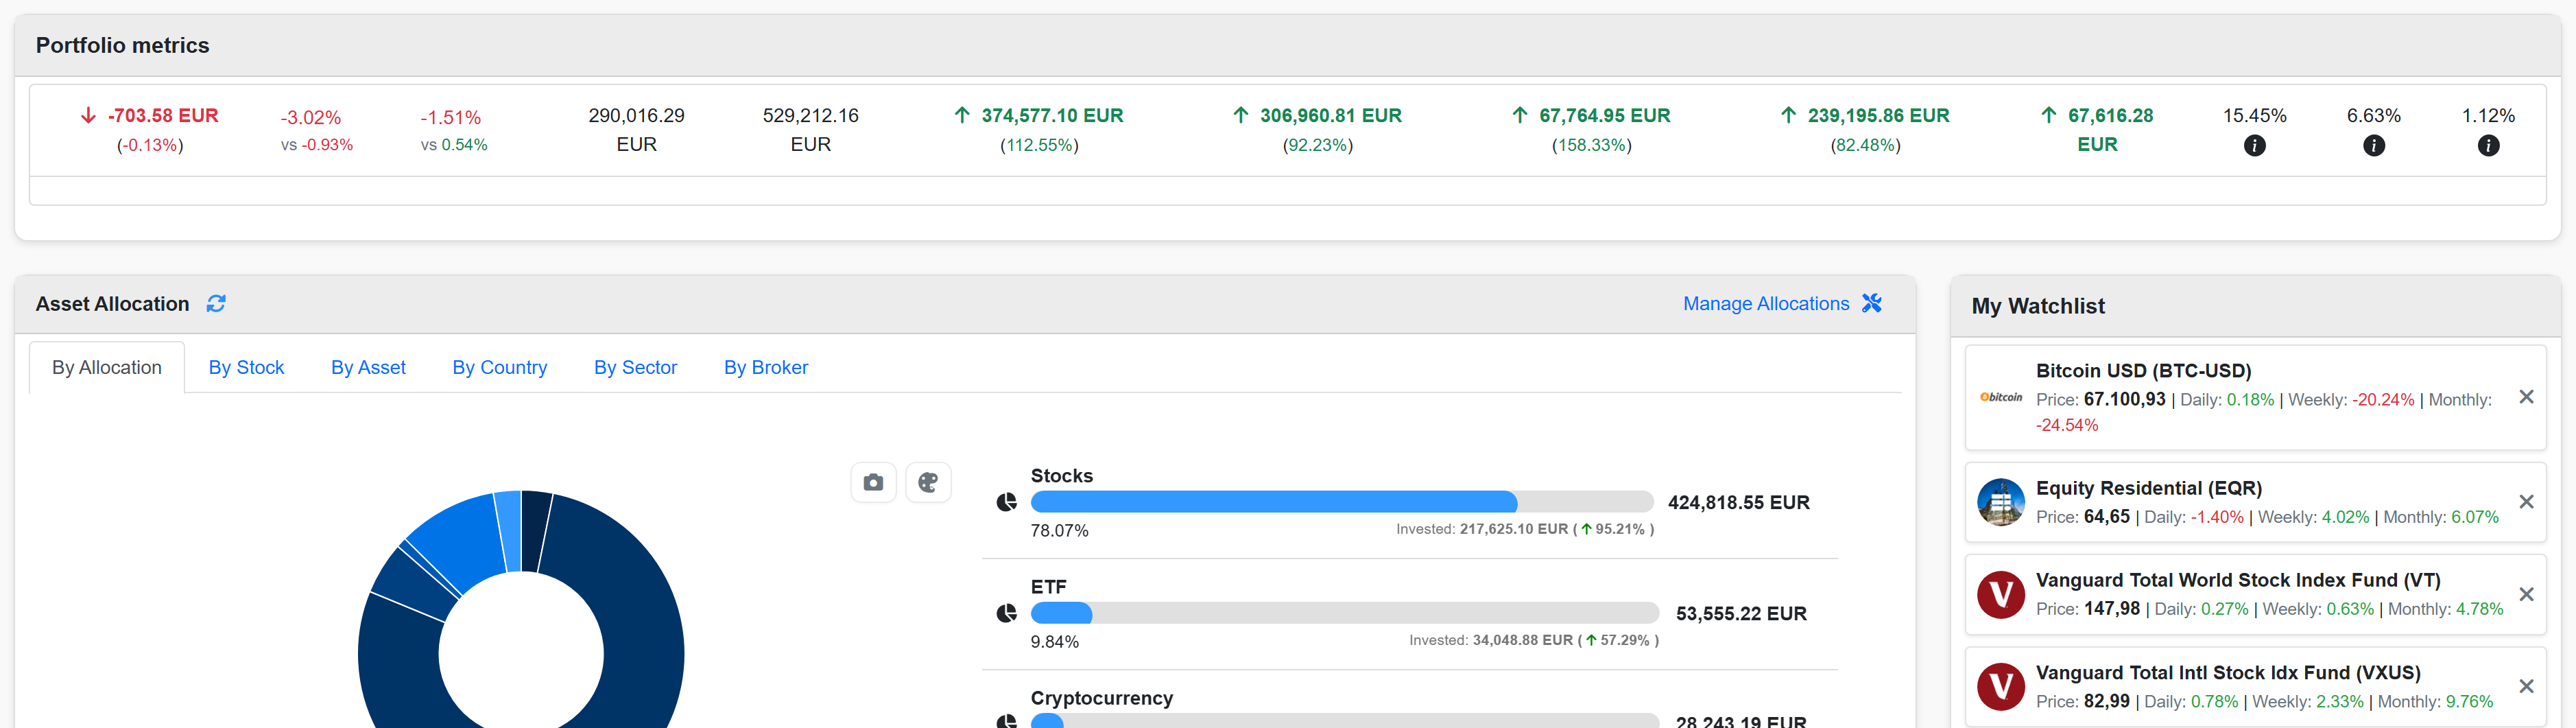
Not just stocks
Most trackers stop at equities. This one handles your bonds, options, property and everything else too.
Stocks & ETFs
Live prices from 80+ exchanges. See fundamentals, sector breakdowns and how each holding stacks up against the S&P 500 or any benchmark.
Bonds & Fixed Income
YTM, duration, convexity and accrued interest, all calculated for you. Plus a bond ladder timeline so you can plan around coupon dates.
Options
Puts, calls, full Greeks. Watch theta eat your premiums in real time (or work in your favour if you're selling).
Real Estate
Add properties with mortgages, log rental income and expenses. The tracker works out your cap rate, NOI and cash-on-cash return.
Crypto
BTC, ETH and thousands of tokens tracked right alongside your stocks and bonds. Finally see what crypto actually does to your overall allocation.
Cash & Custom Assets
Track cash in 50+ currencies, plus anything else you own: art, watches, wine, a classic car. If it has value, it belongs in your net worth.
Tracker vs spreadsheet
We've all been there. Here's what changes when you stop doing it manually.
| Feature | Spreadsheet | AllInvestView |
|---|---|---|
| Real-time prices | Limited / manual | Automatic |
| Dividend tracking | Manual entry | Auto-detected |
| Stock split handling | Manual adjustment | Automatic |
| Tax reports (FIFO/LIFO) | Build your own | One click |
| Multi-currency conversion | Manual formulas | 50+ currencies |
| Monte Carlo simulation | Not feasible | Built-in |
| Broker sync | Copy & paste | 30+ brokers |
| Setup time | Hours / days | Under 5 min |
Know your risk before the market reminds you
The kind of analytics that used to require Bloomberg or a quant team. Built right into your dashboard.
Per-holding benchmark
Did that stock pick actually beat the S&P 500? Compare any holding against VOO, SPY or whichever index you care about.
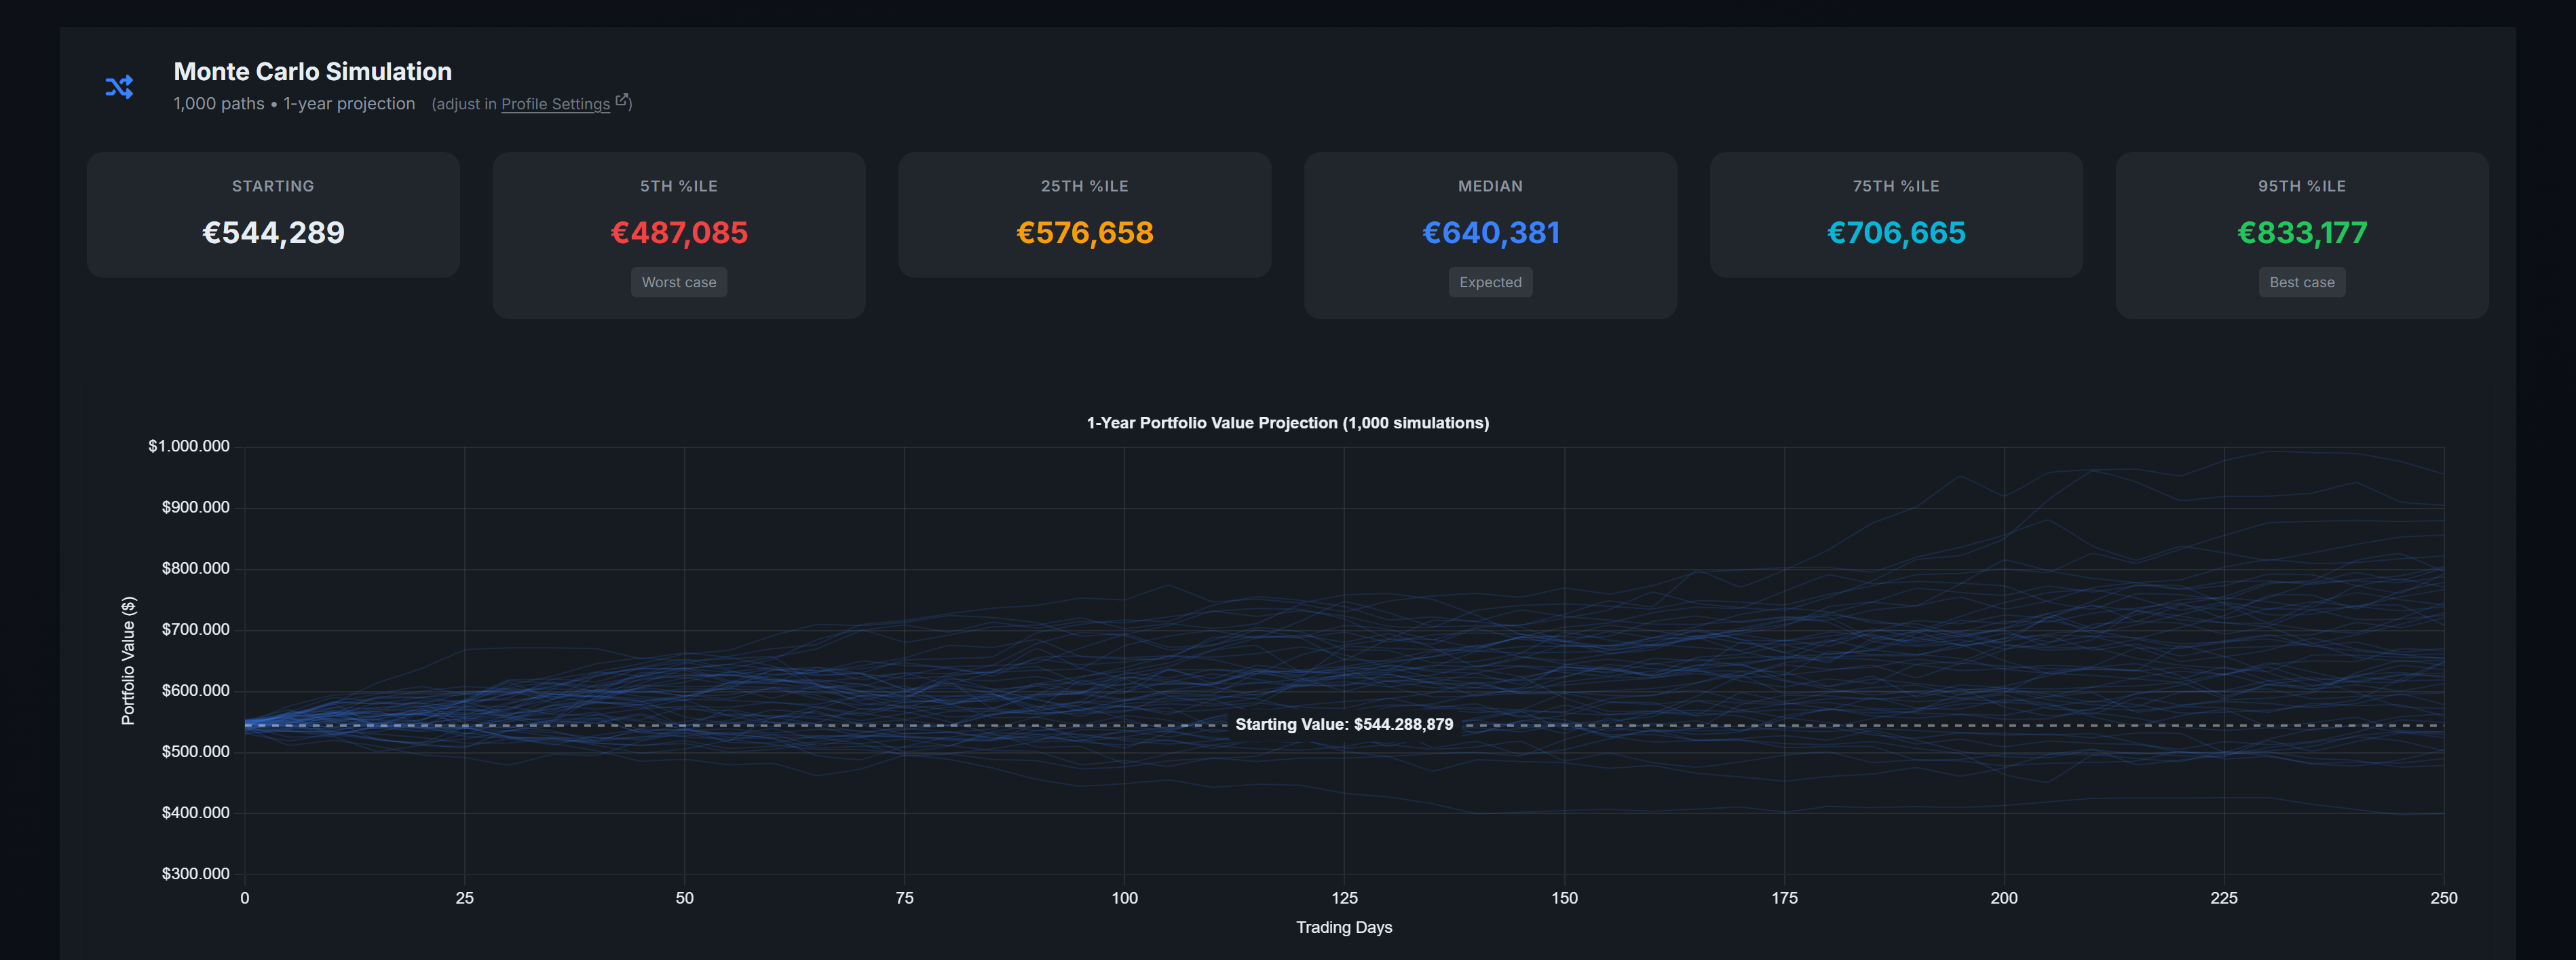
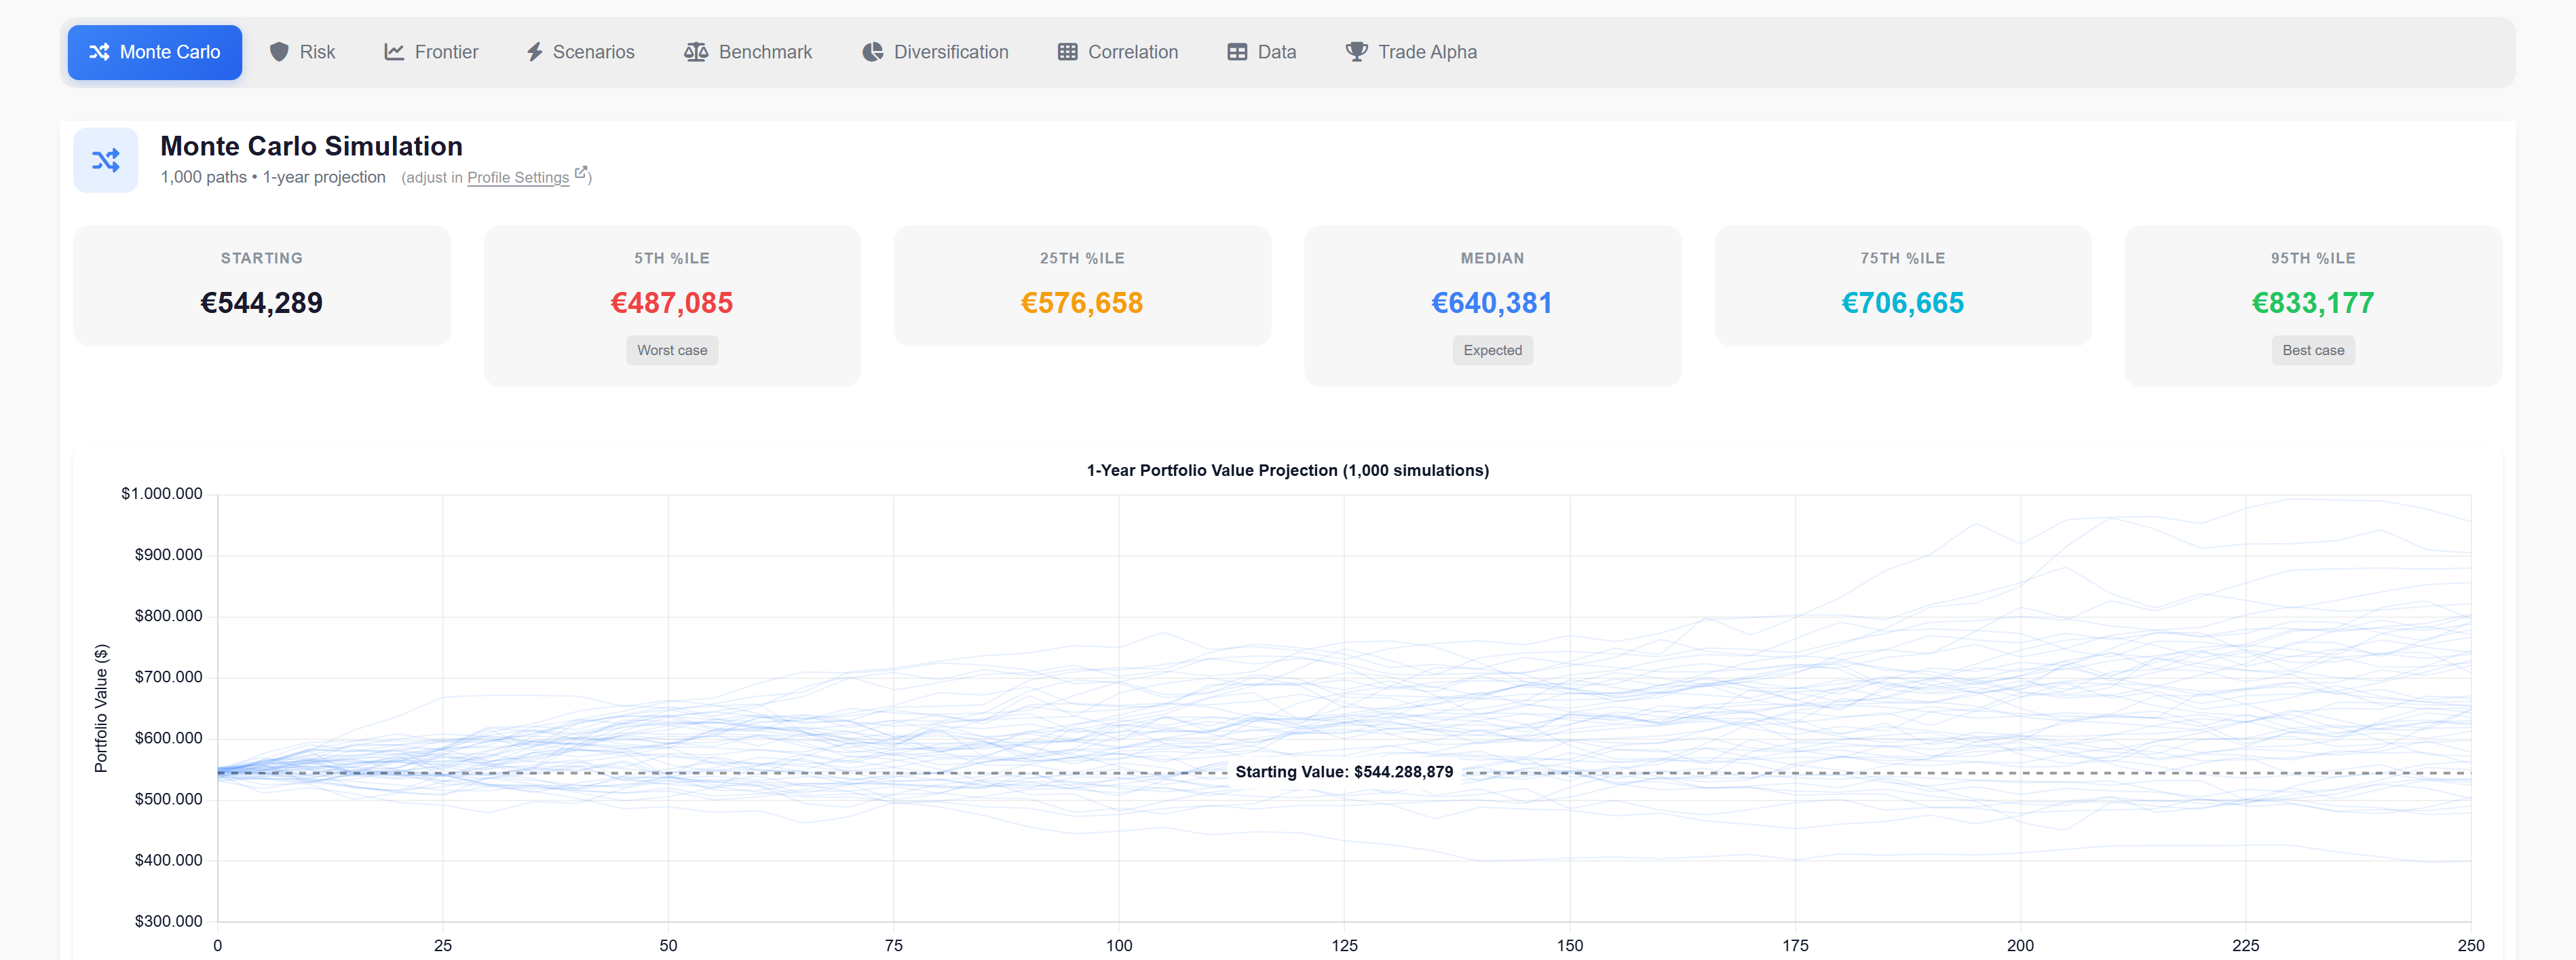
Monte Carlo simulation
Run thousands of scenarios to see where your portfolio could realistically end up in 5, 10 or 30 years. Best case, worst case, and everything in between.
Value at Risk
"How much could I lose in a bad month?" VaR answers that at 95% and 99% confidence. Good to know before it happens.
Efficient Frontier
Markowitz optimisation that shows you the best possible return for whatever risk level you're comfortable with. Useful for rebalancing decisions.
Correlation heatmap
Think you're diversified? The heatmap shows you which holdings actually move together. Sometimes the answer is surprising.
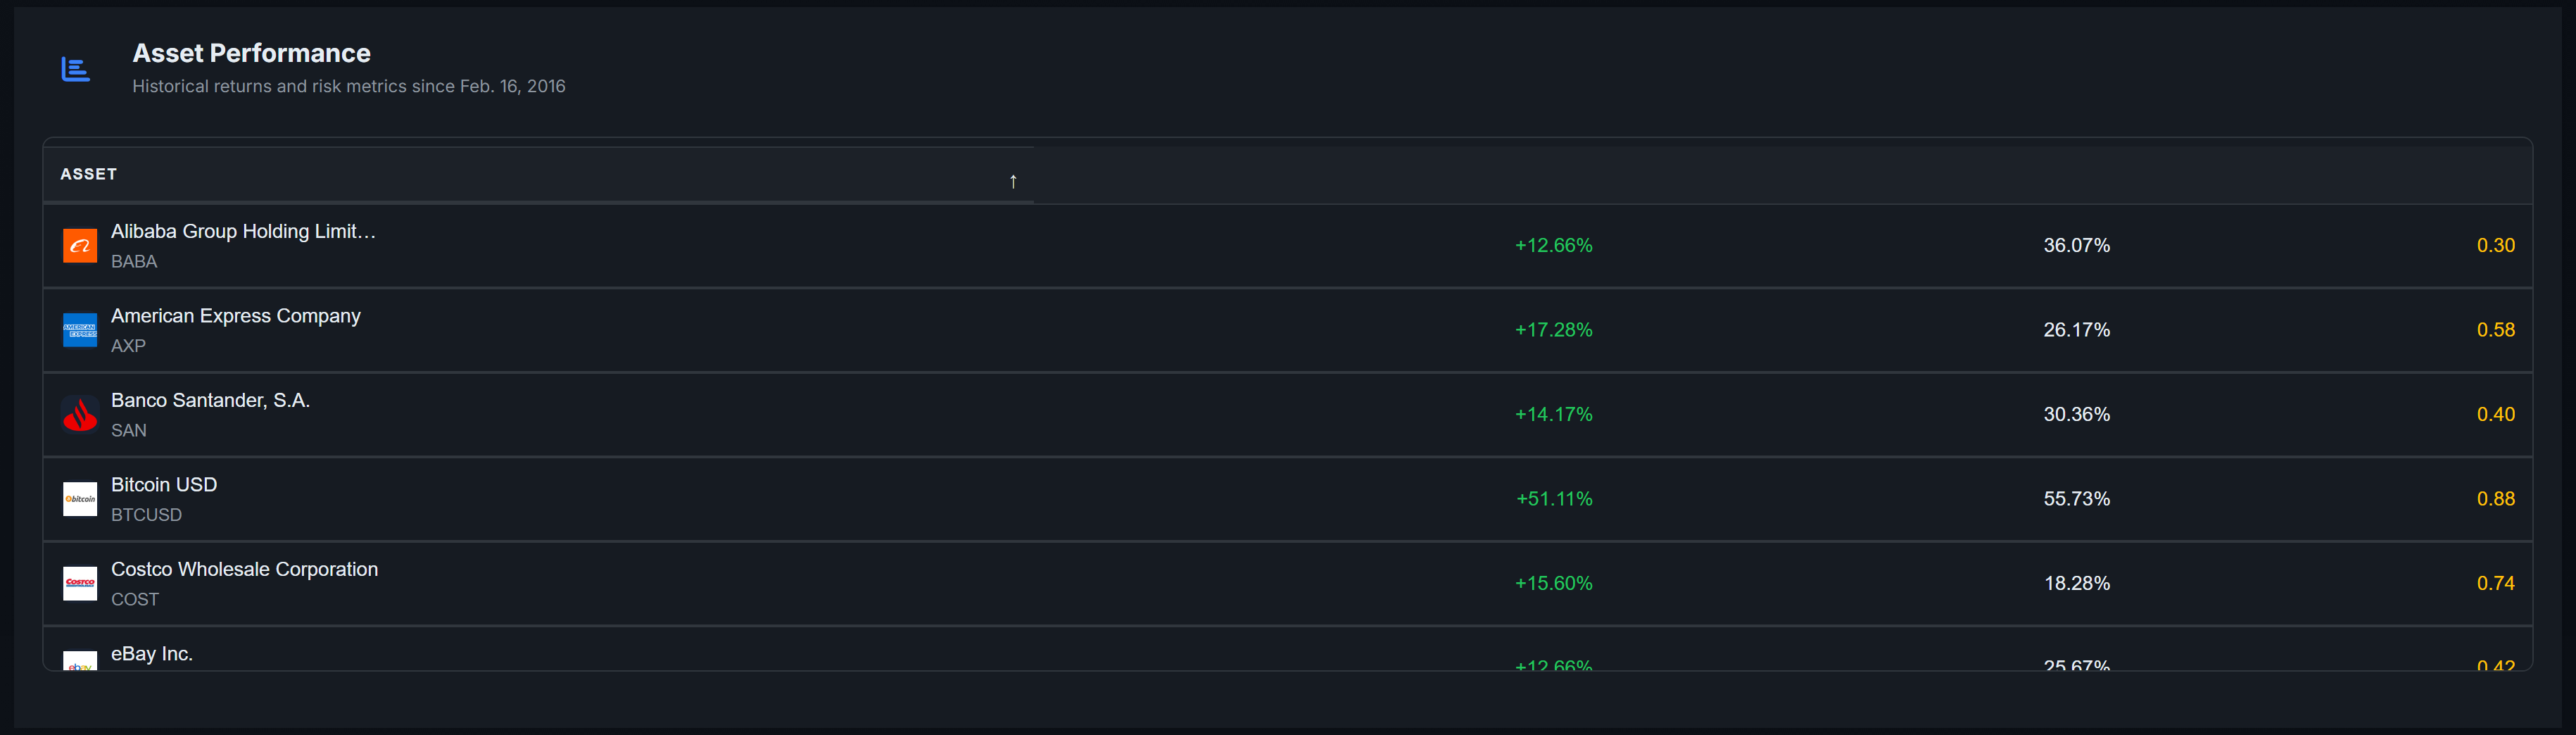
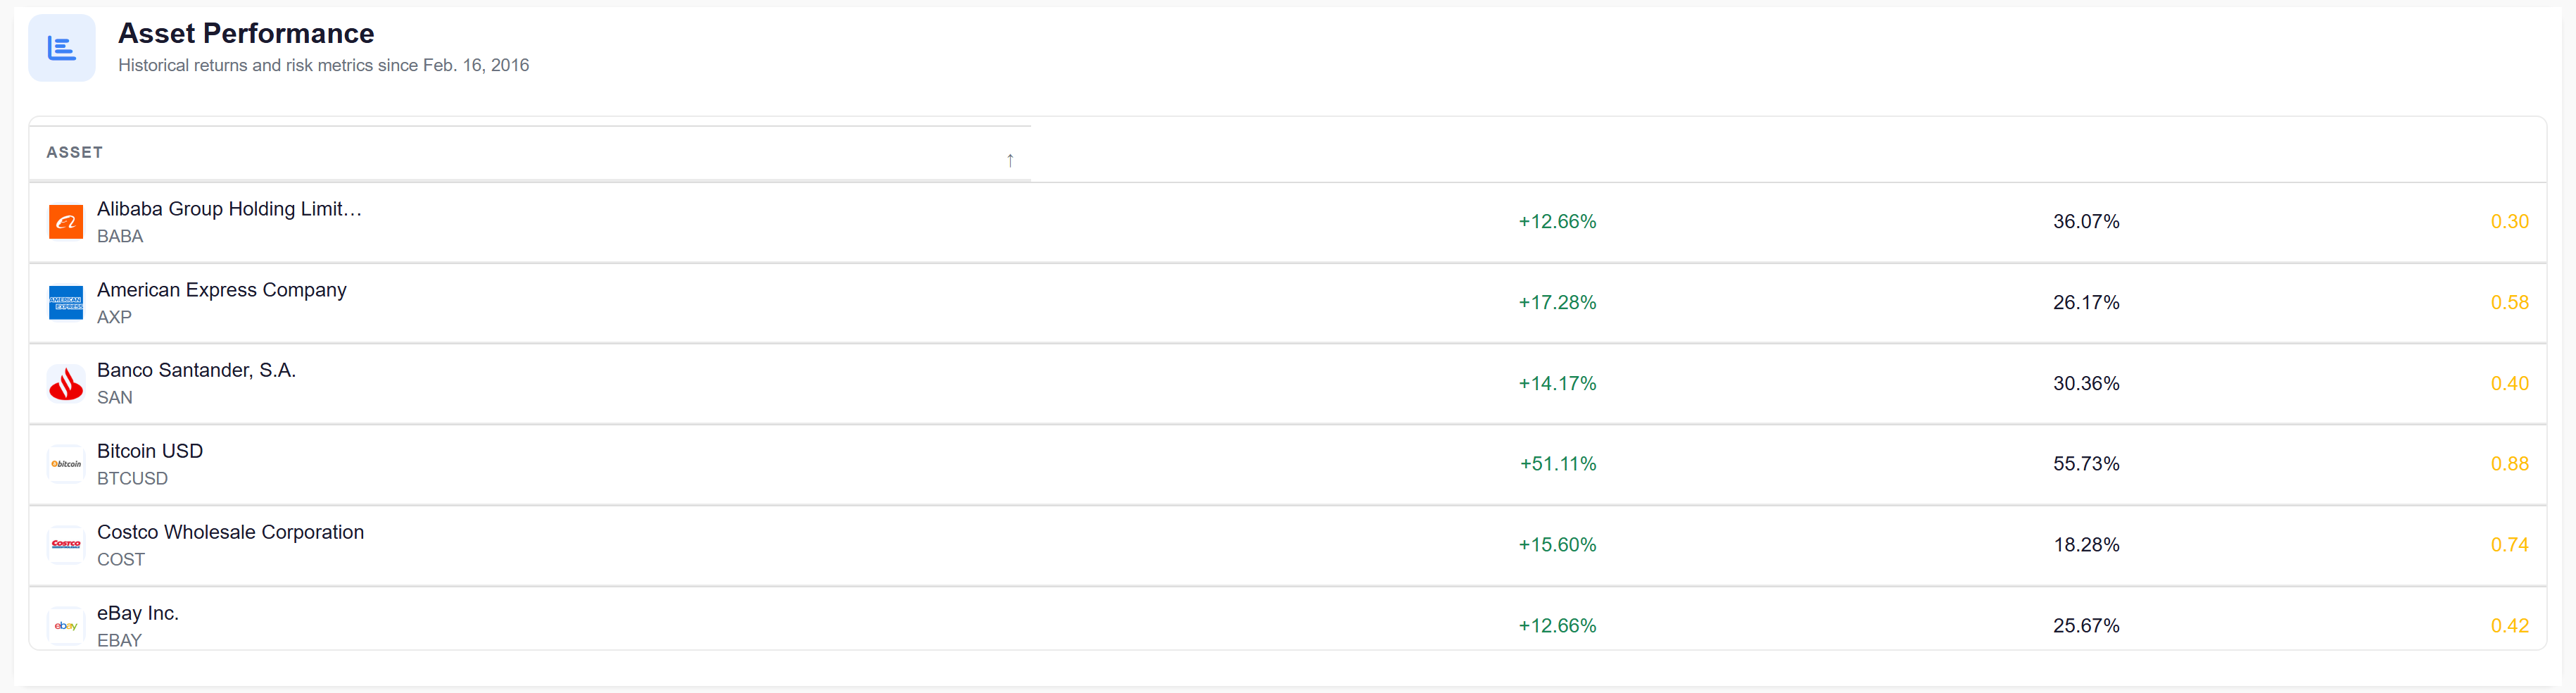
Sharpe, Alpha & CAGR
Risk-adjusted returns at the holding level and portfolio level. Sharpe Ratio, Alpha, Beta and CAGR. The numbers that actually matter.
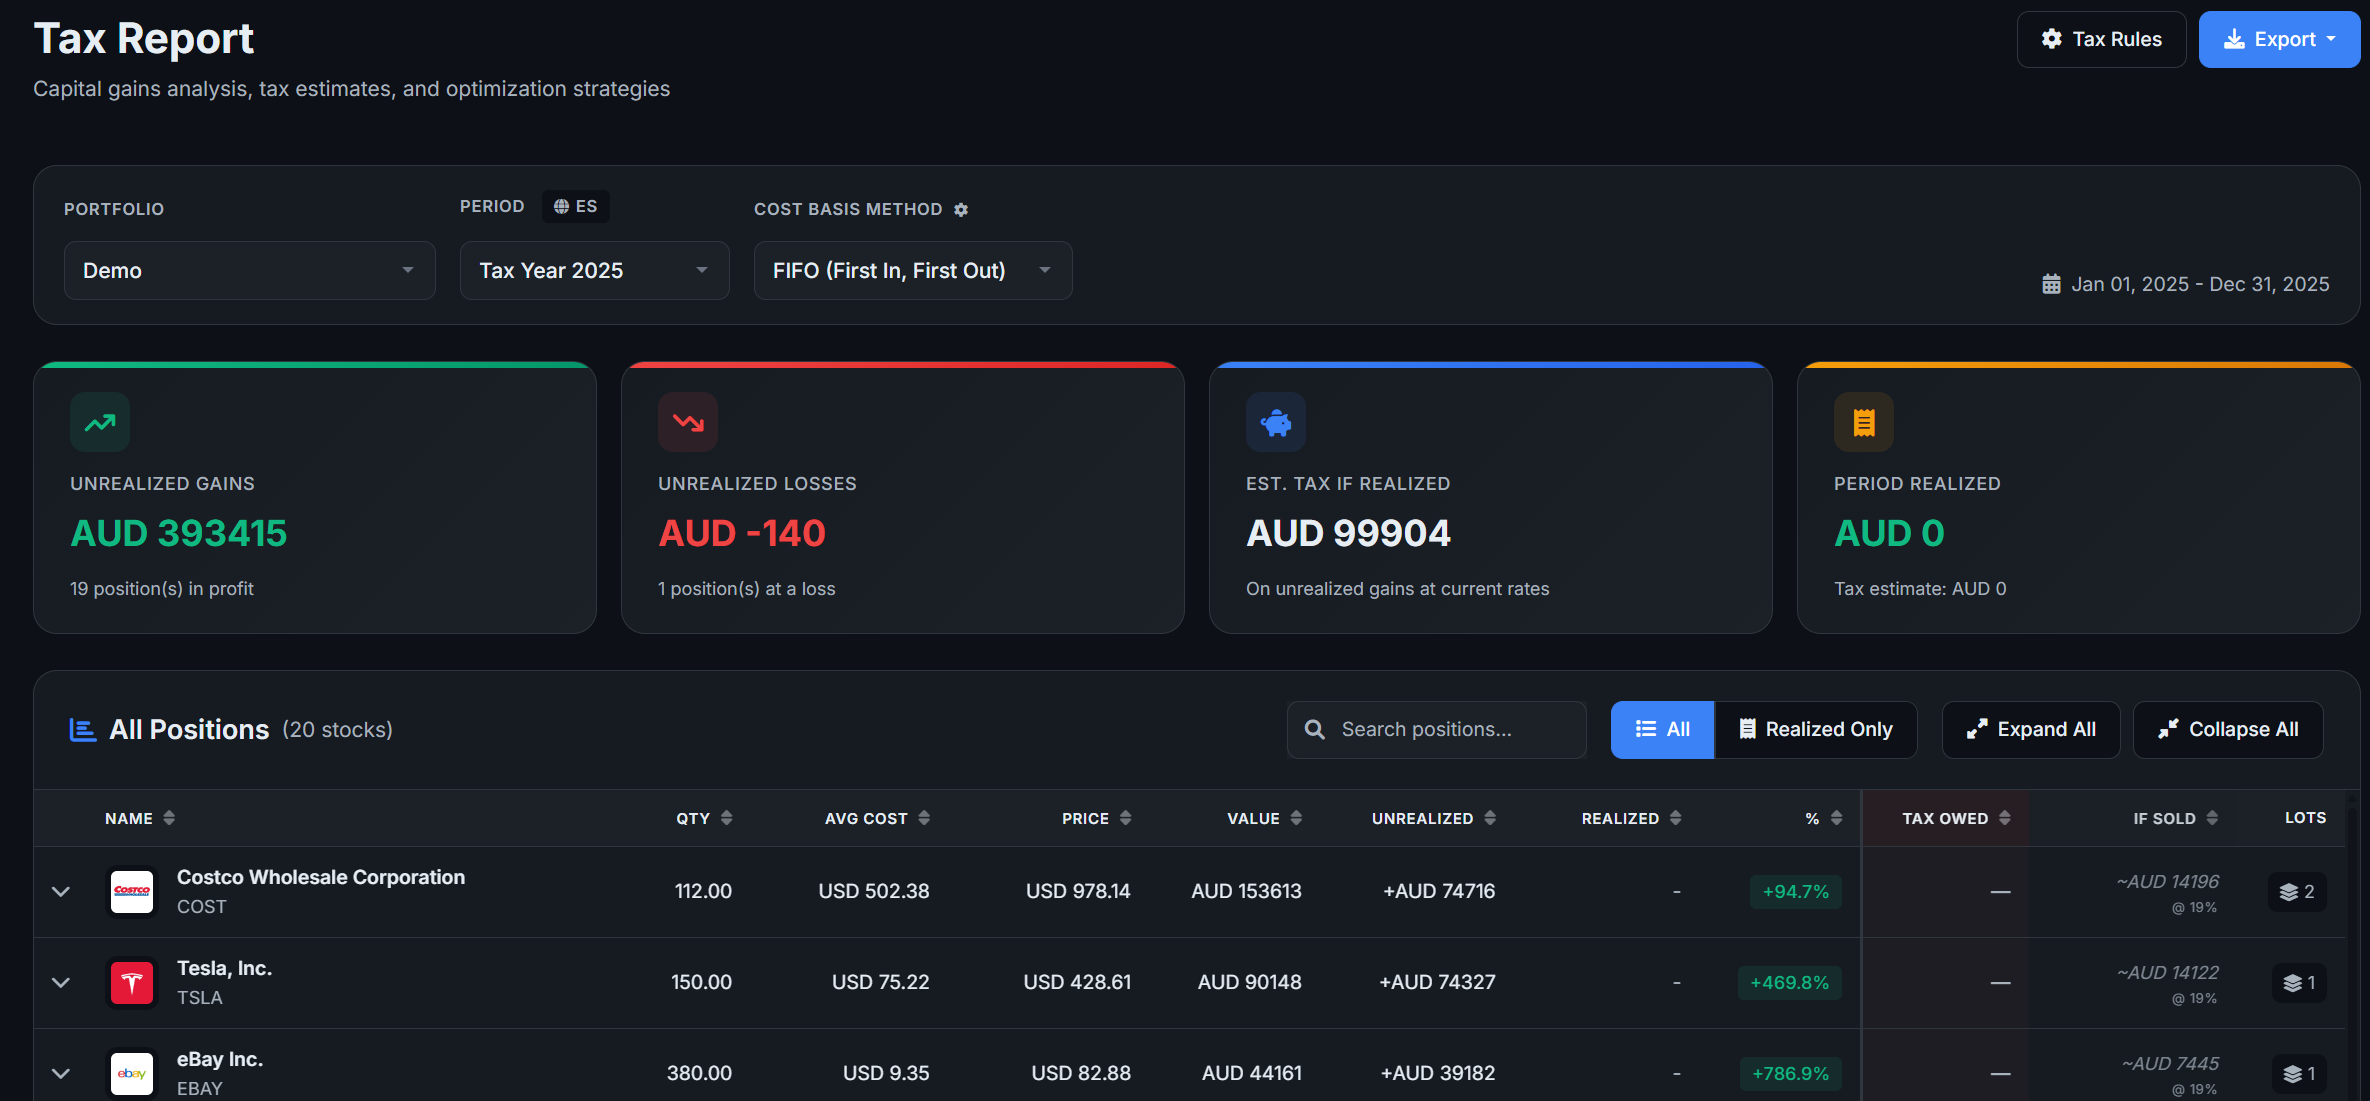
Tax season doesn't have to be painful
Capital gains, cost basis, wash sales. The tracker handles the maths. You just hit export.
FIFO, LIFO & average cost
Pick the method your country requires, or run all three and see which one saves you the most. Takes two clicks.
Country presets
US, UK, Germany, Spain, France, Italy, Netherlands, Canada, Australia and more. Each one pre-configured with the right rates and rules. Tweak them if you need to.
Progressive tax brackets
Set up your brackets and the tracker splits gains across them properly. No more guessing which rate applies to what.
Wash sale detection
Sold at a loss and bought back too soon? The tracker catches it and flags the disallowed loss before your accountant has to.
Loss carry-forward
Had a rough year? Unused losses roll forward and offset future gains. The tracker keeps a running total so you don't lose track.
Export to PDF, Excel or CSV
Your accountant wants a PDF? Done. Prefer to dig into the numbers yourself in Excel? Also done.
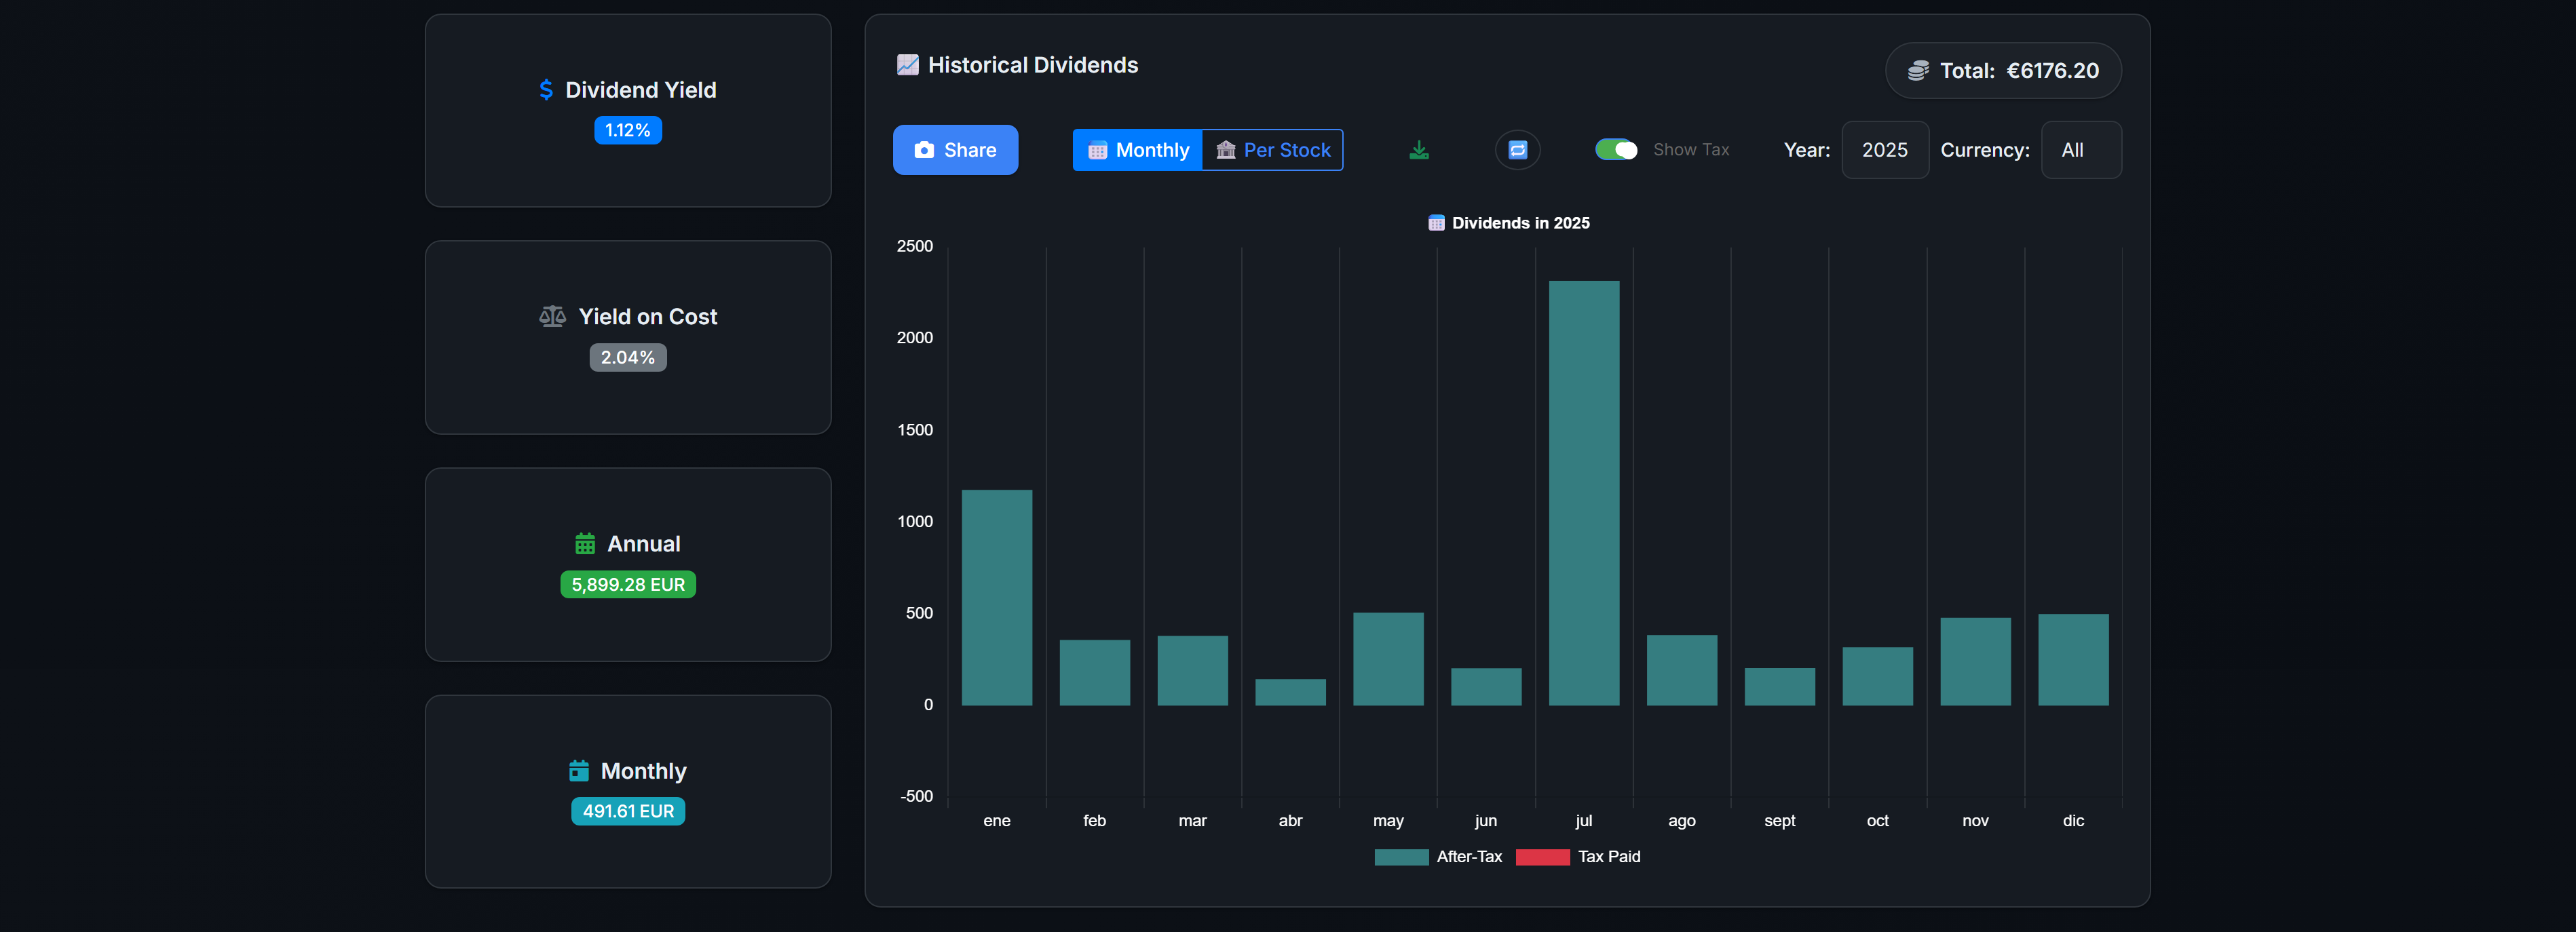
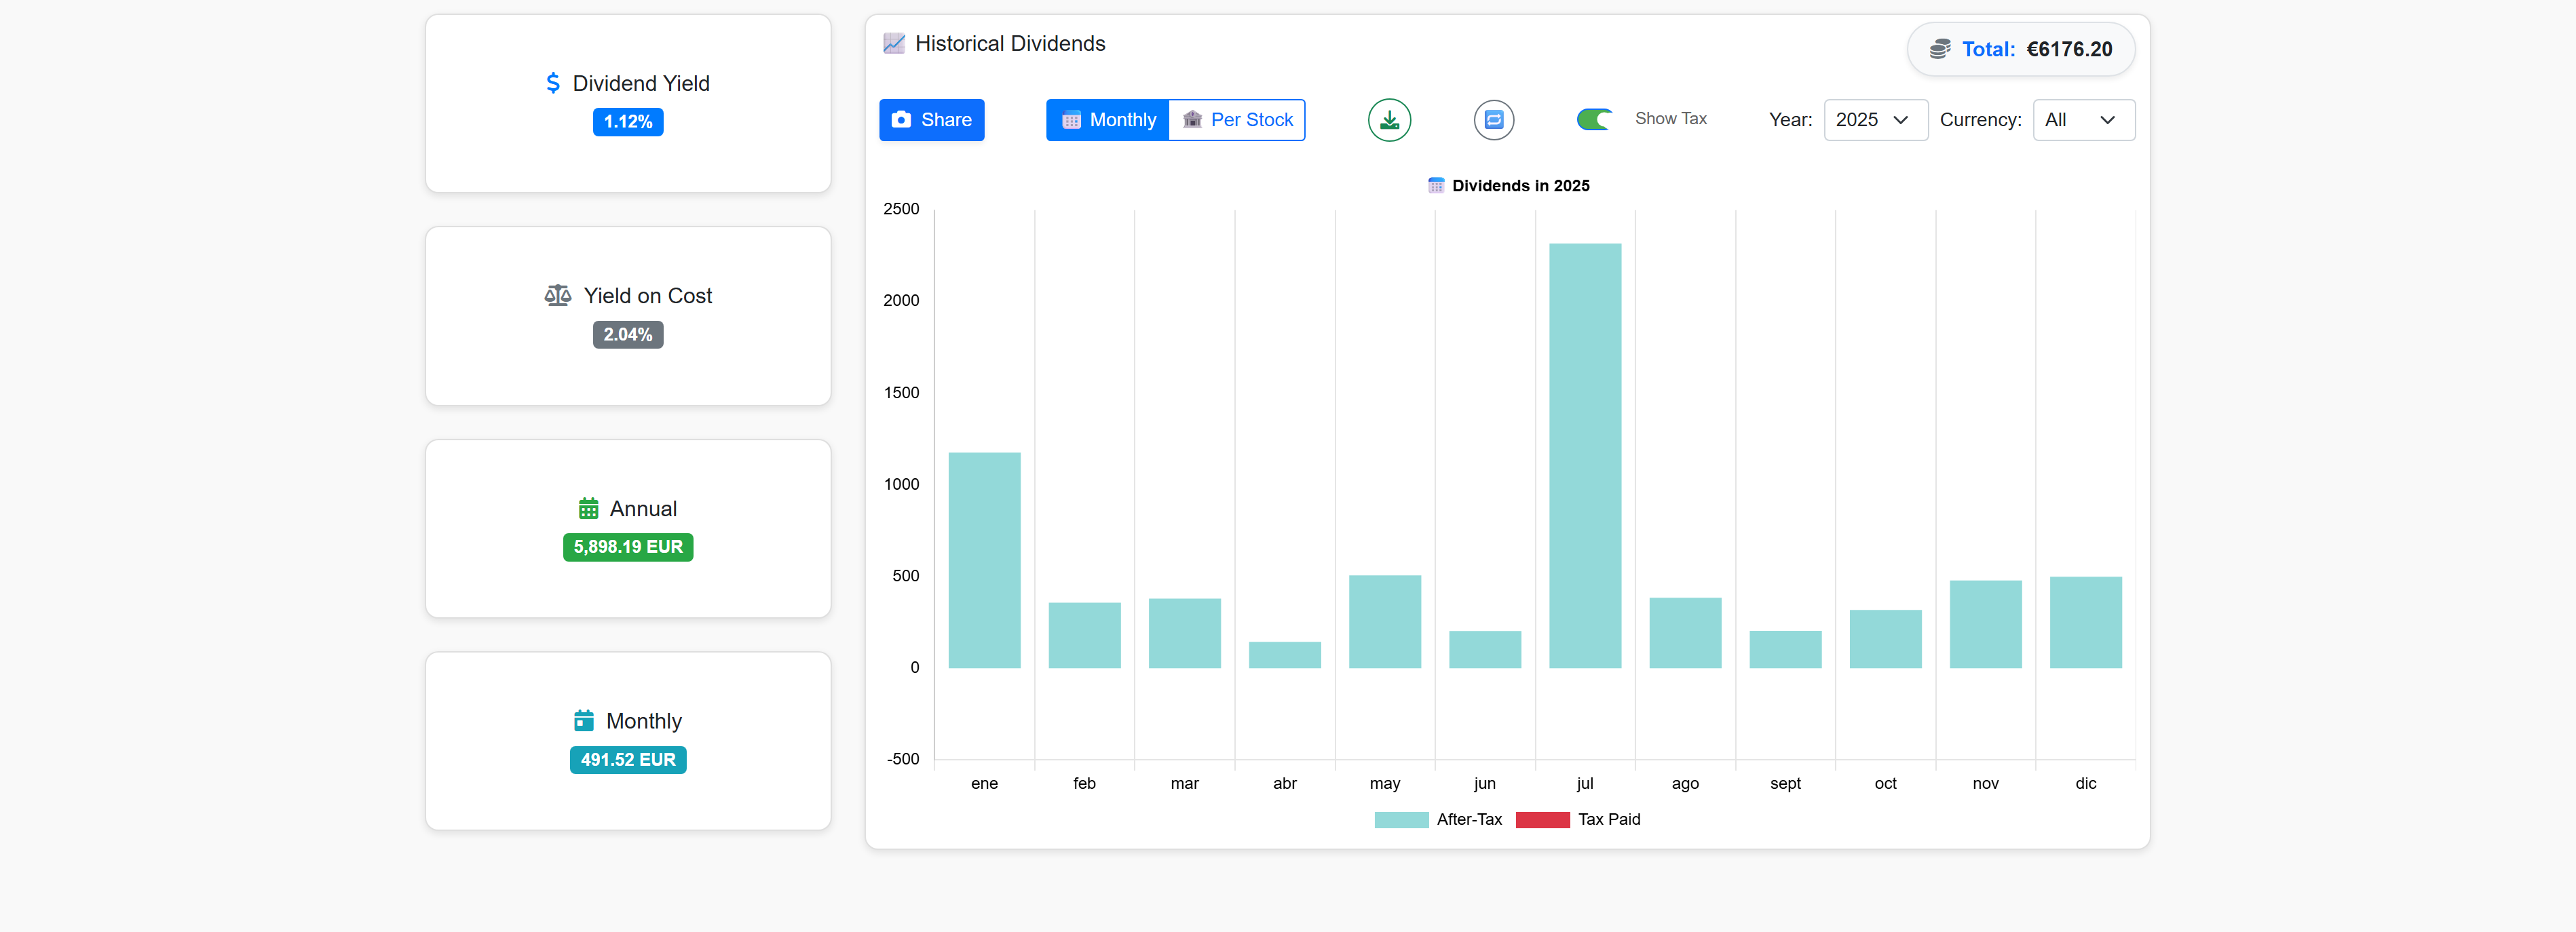
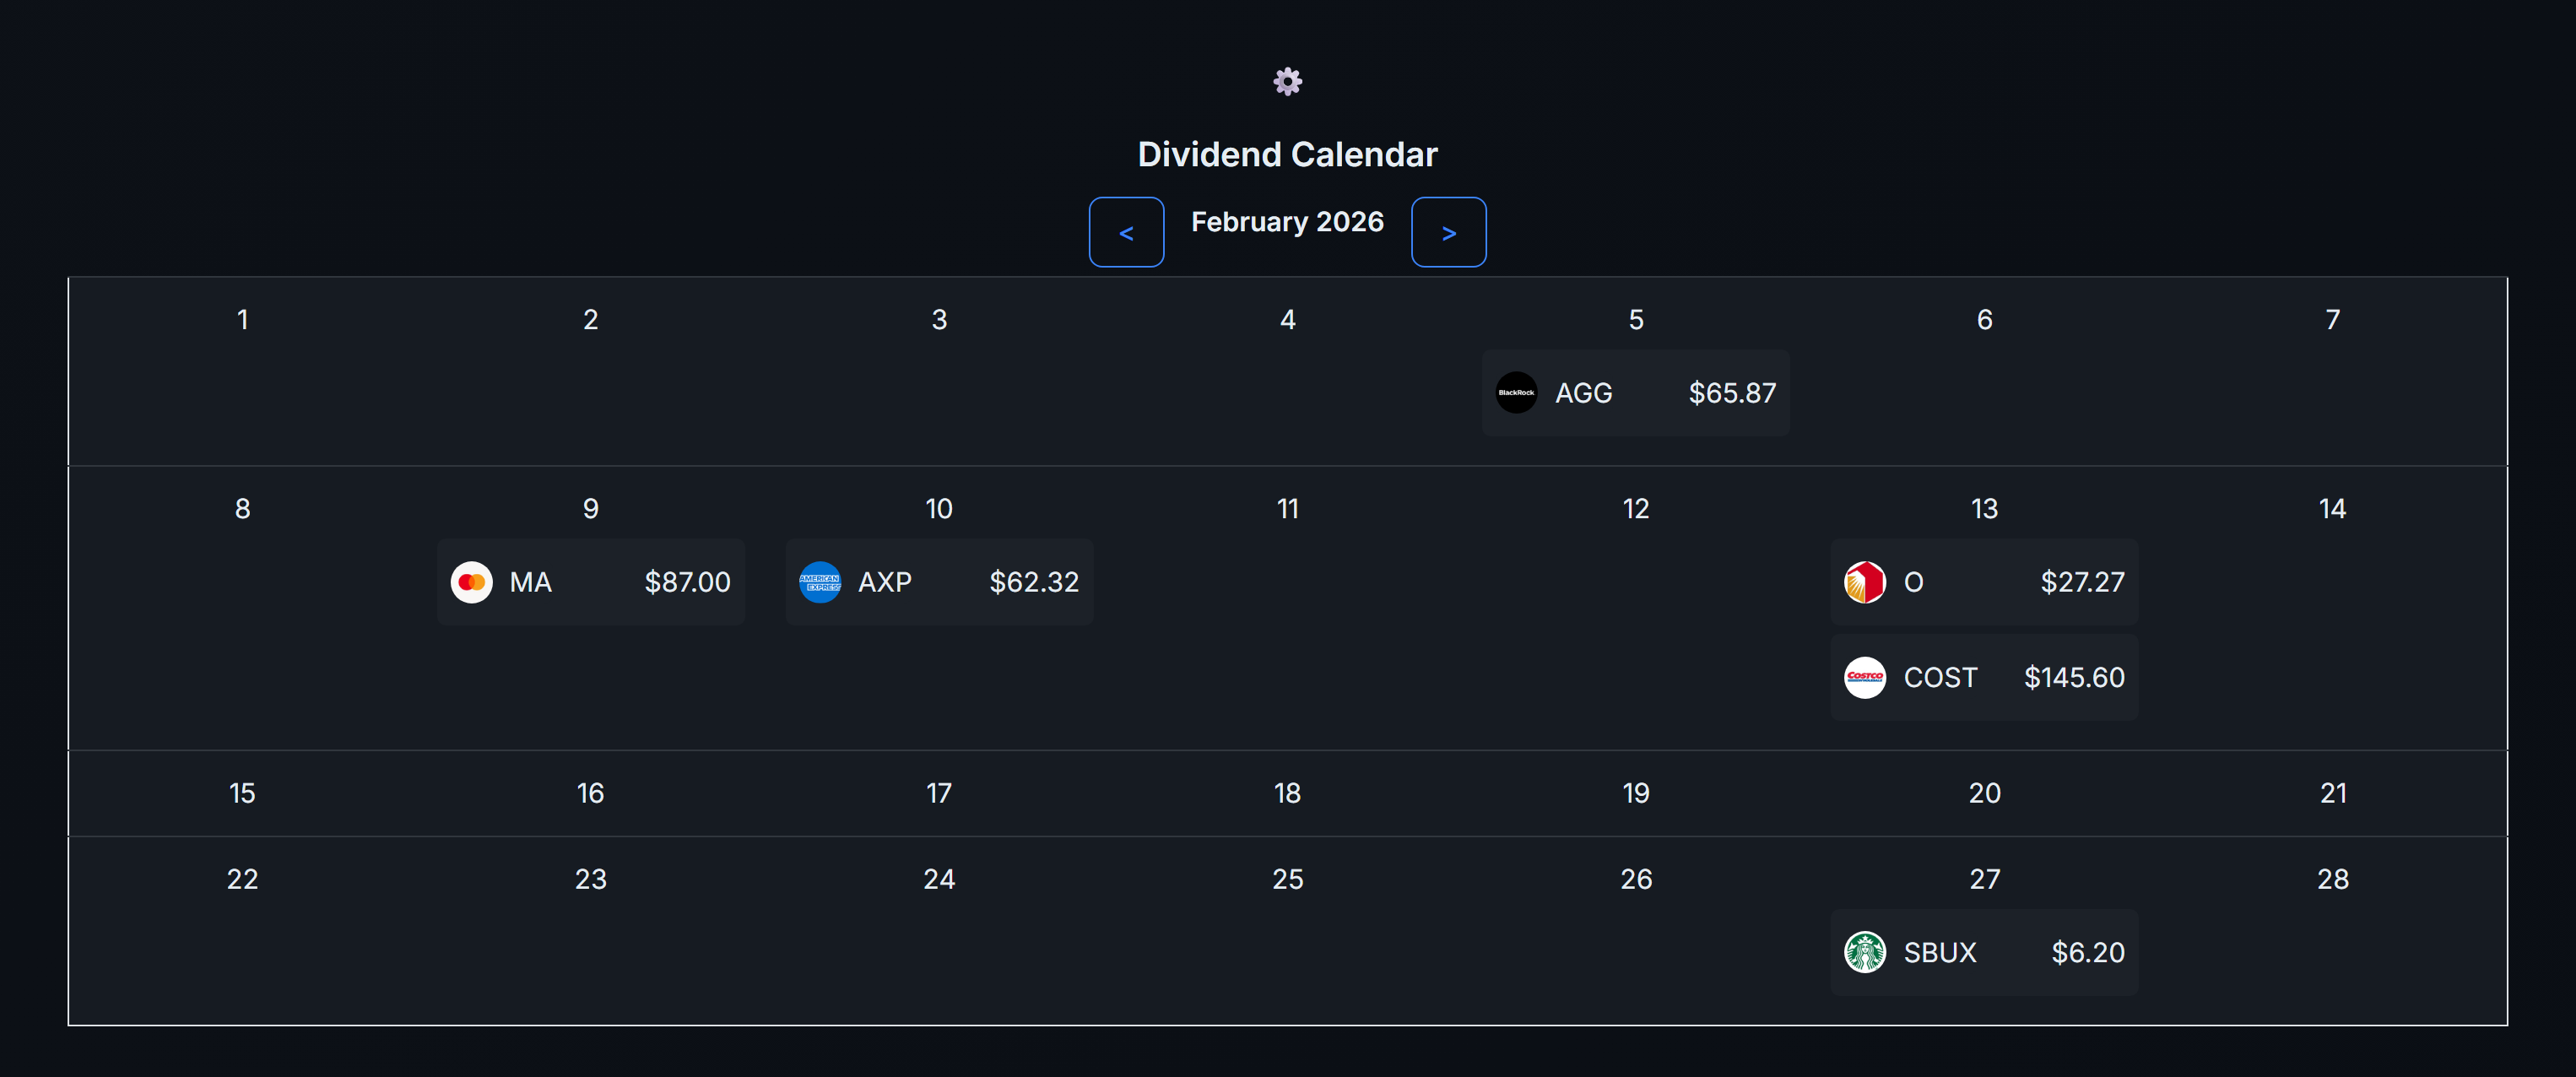
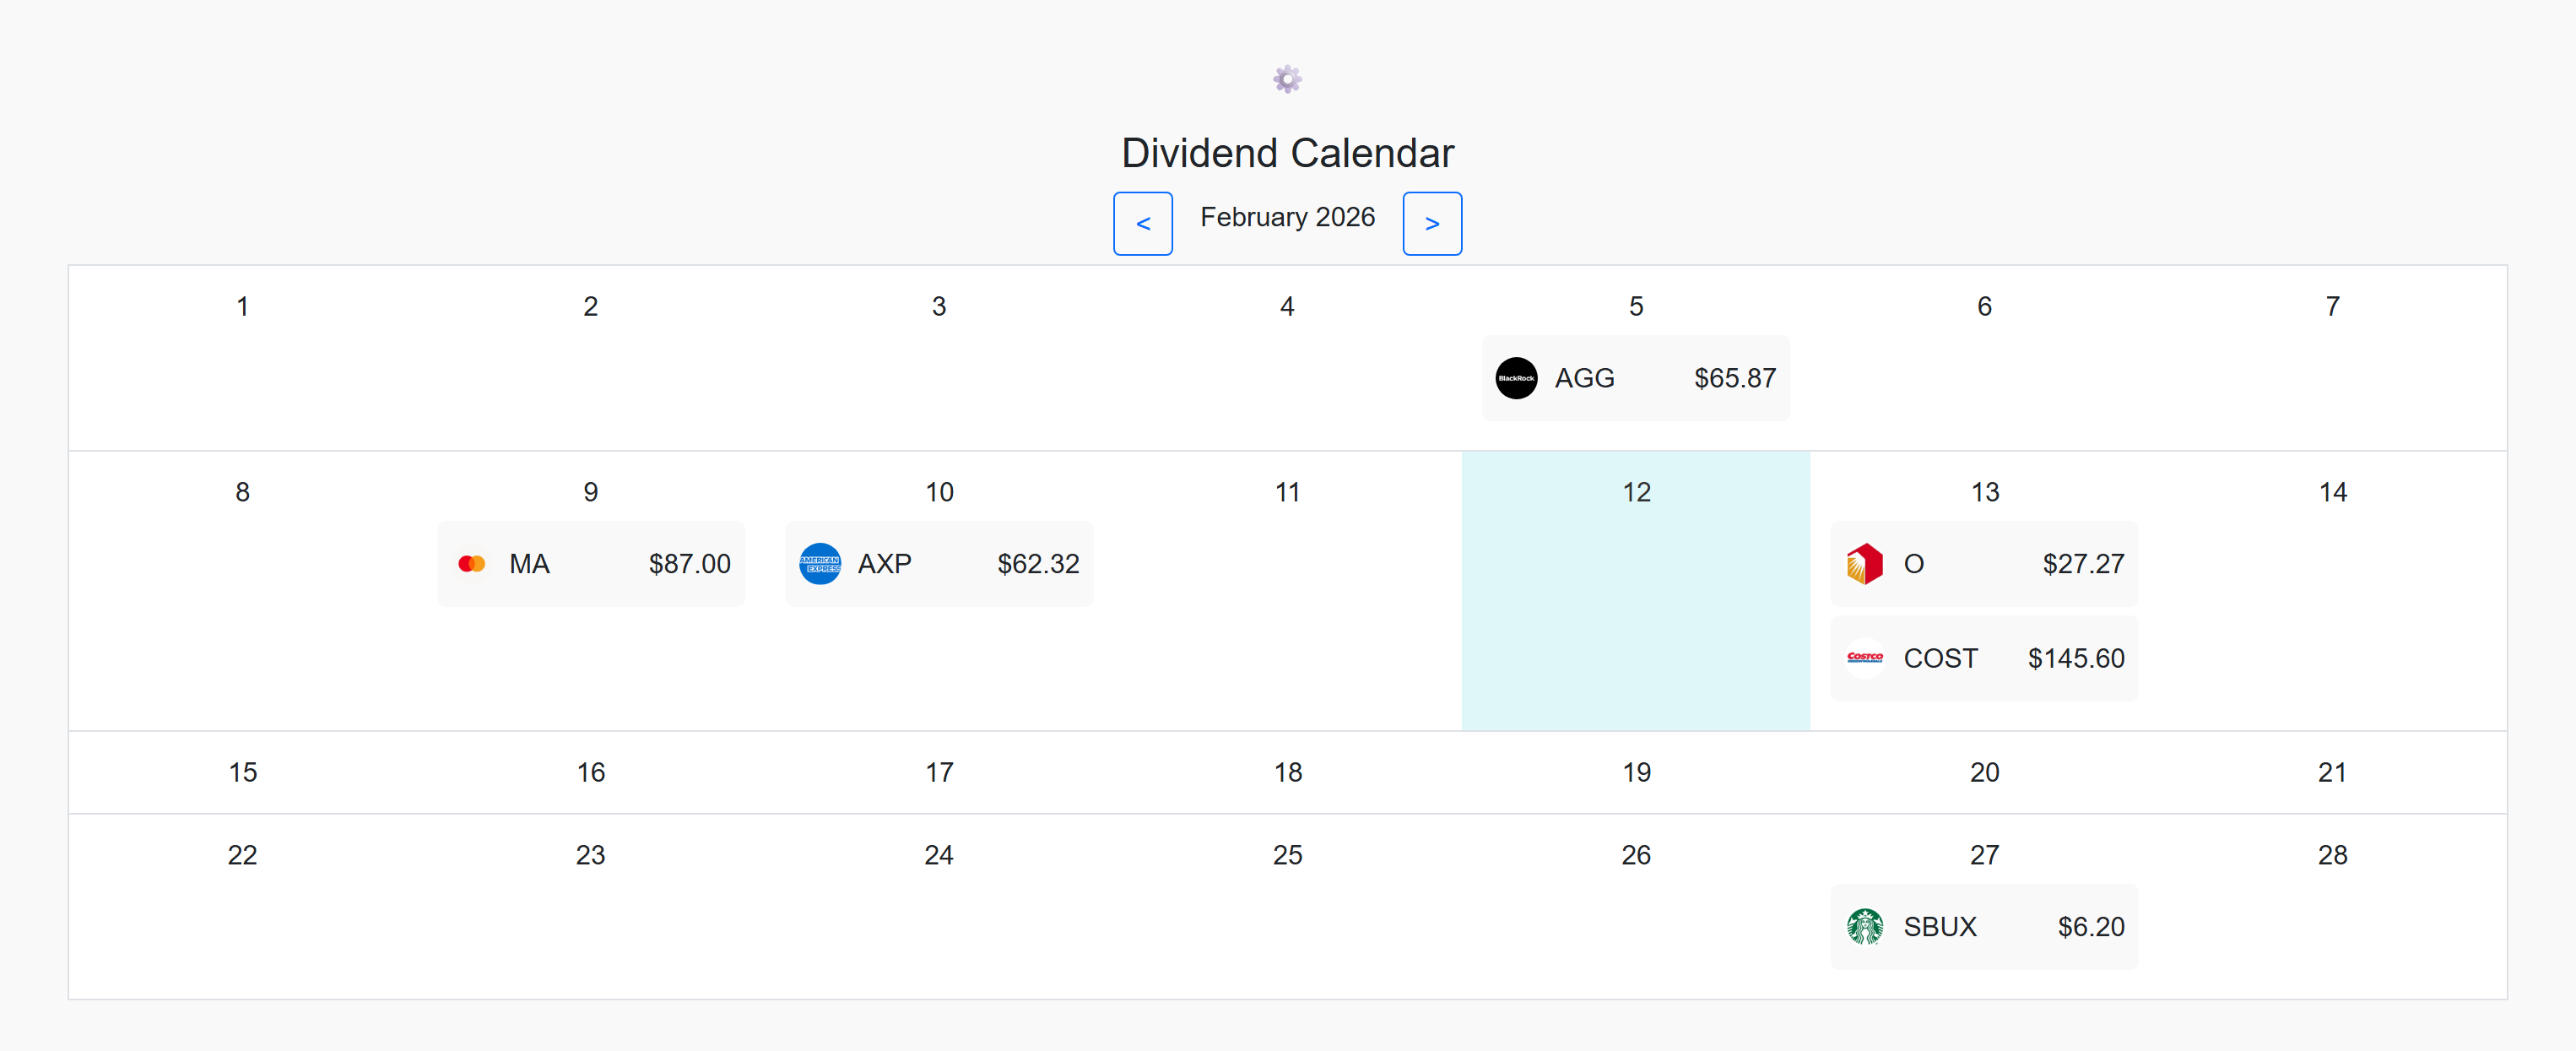
Dividends, handled
Dividends show up automatically, no manual entry. You get a calendar, income projections and yield calculations without lifting a finger.
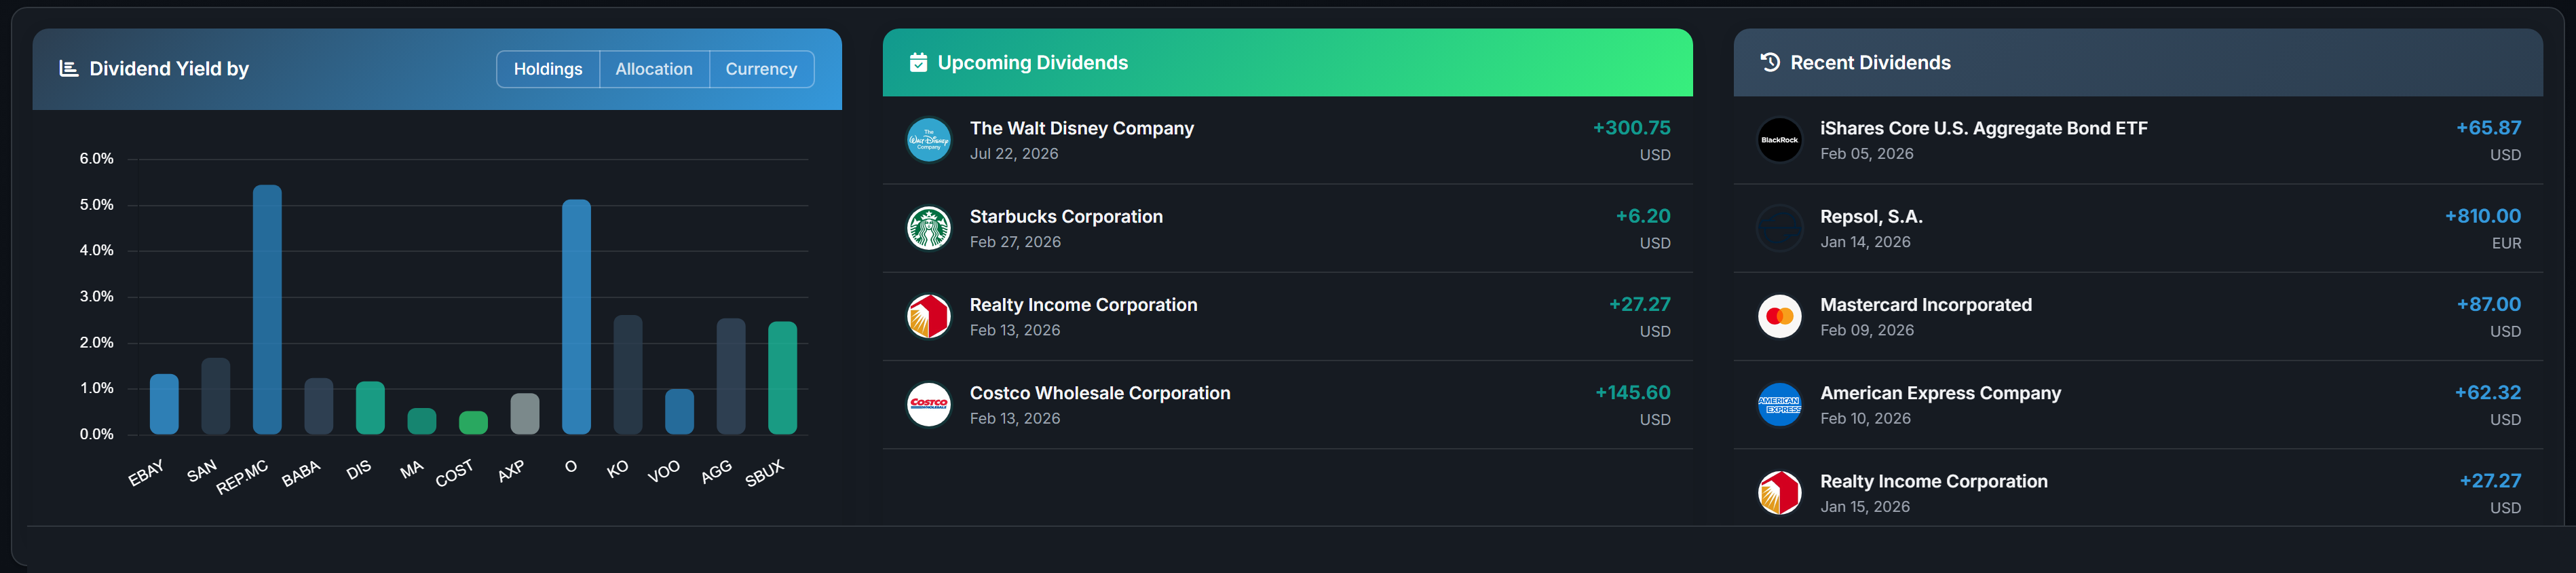
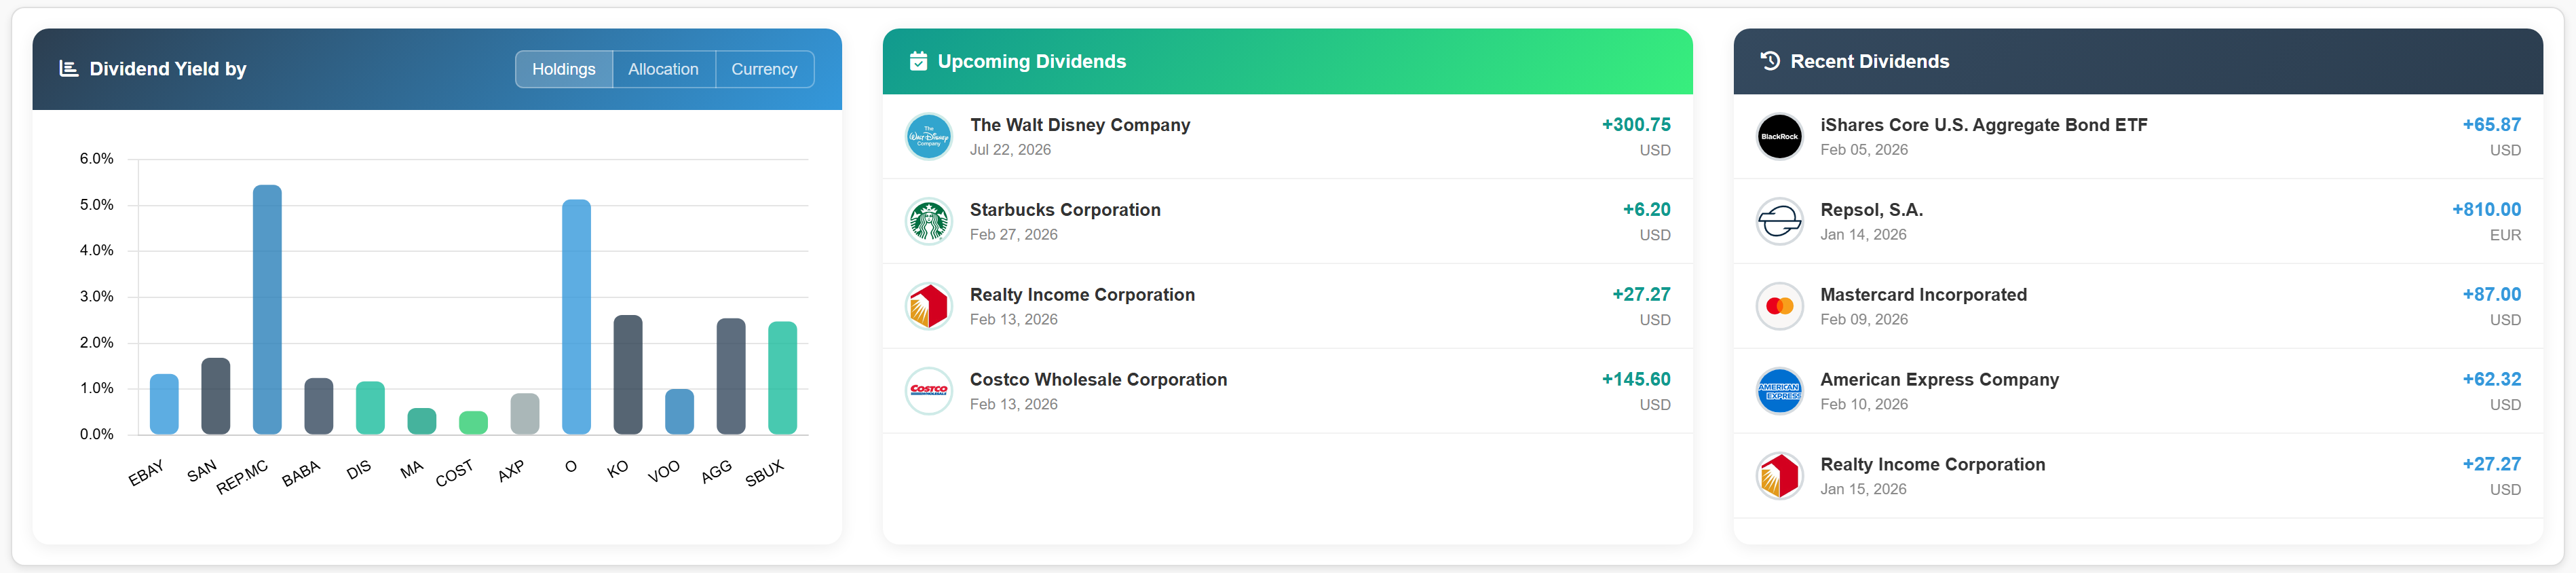
Payment calendar
See exactly when each dividend hits your account. Ex-dates, record dates and payment dates, all laid out month by month.
Yield on cost
The yield based on what you actually paid, not today's market price. If you bought early, this number will make you smile.
Income projections
How much dividend income can you expect this year? Next year? Track the growth and see how close you are to your income target.
Three steps. That's it.
Most people have their entire portfolio tracked in under five minutes.
Create account
Takes about 30 seconds. No credit card, no strings. The free plan doesn't expire.
Connect or import
Link your broker for automatic sync, drop in a CSV, or type trades in by hand. Whatever's easiest for you.
Track everything
That's it. Your dashboard is live with real-time prices, analytics, dividends and tax reports. Everything works from day one.
Your data stays yours
We take this seriously. Here's how.
Read-only connections
We can see your holdings but we can't trade, move money or change anything in your account. That's by design.
No ads. No data selling.
Premium subscriptions pay the bills. We don't run ads, we don't sell your data, and we don't have third-party trackers on the site.
Leave whenever you want
Export everything to CSV with one click. If you delete your account, all your data goes with it. No tricks, no retention games.
Common questions
Things people usually ask before signing up.
Done with spreadsheets?
Set up takes five minutes. The free plan doesn't expire. See what your portfolio actually looks like in one place.
Start Tracking Free