Welcome to Allinvestview Help

Start by selecting an article from the menu on the left to learn more about how to make the most of Allinvestview.

🚀 Checkout the Community Forum!

Got questions or feedback? Have ideas for new features? Head over to the community forum! 💬 Join the conversation: share your thoughts, vote on feature requests, or report issues. We value your input in making Allinvestview even better!

Desktop and Mobile

Discover how to use Allinvestview to track your investments efficiently.

Track all your asset classes

Deep dive into how to track all your assets and get started in Allinvestview.

Glossary of Terms

Familiarize yourself with key investment terms commonly used in Allinvestview to make the most of your portfolio management.

Import holdings

Learn how to leverage Allinvestview import functionality.

Learn More

Deep dive into advanced features and learn how to leverage Allinvestview to its fullest potential.

Need Help?

Have issues or questions? Contact our support team directly.

Email Support

Do you have a feature request or issue? Check out our Feature Request page to share your ideas and suggestions with us!

Allinvestview is a web application

Allinvestview, much like a traditional web application, offers the unique capability to be accessed anywhere through the web but also be installed and operated as a regular app across both desktop and mobile platforms.

By installing Allinvestview, you gain the ability to add the application to your mobile or desktop, fully utilize your screen space, and access Allinvestview offline.

Installing on Desktop

To install Allinvestview on desktop browsers like Chrome, Edge, or Brave:

  • Visit www.allinvestview.com on a compatible browser.
  • Click the install button on the right side of the address bar.
  • Once installed, Allinvestview will be available from your dock or application folder.

Note: You can use Allinvestview offline after loading data once!

Installing on iOS

To add Allinvestview to your iOS device:

  • Open Safari or Chrome and navigate to www.allinvestview.com.
  • Tap the share icon, then select 'Add to Home Screen'.
  • Confirm the shortcut name and tap 'Add'.

Installing on Android

Installing Allinvestview on Android devices:

  • Visit www.allinvestview.com on Chrome.
  • Look for the installation prompt or access 'Install App' from the browser menu.
  • Confirm and complete the installation to add it to your home screen.

Uninstalling Allinvestview

To uninstall Allinvestview:

  • Remove the application shortcut from your dock, home screen, or applications folder.

How to Use Allinvestview - Track all your asset classes

Do you have a multicurrency portfolio? No problem! Allinvestview converts all portfolio metrics, charts, and valuations on your dashboard to the default currency you define in your account settings.

To set or update your default currency, visit your account settings page. Here, you can choose the currency that best suits your financial overview.

Whether you are investing in local or international markets, this allows you to view all your financial data directly in one unified currency.

Ticketing system

Every transaction is seamlessly integrated into your dashboard, allowing you to view all details effortlessly.

Transactions are displayed in a ticketing format, providing a convenient way to access and update information. Simply click on a transaction to open the ticket, where you can easily view and edit details.

Each transaction can be displayed or amended individually, providing you with the flexibility to make changes as needed. Simply visit the transactions page to access and/or edit your transactions.

Trade Date

The platform operates based on transaction dates, meaning that all portfolio metrics, including returns and IRR, are calculated using the transaction date of each stock. This ensures accurate and reliable performance tracking over time.

It's important to verify that the transaction dates for your portfolio are correctly input, as all metrics rely on these dates to compute real performance. Visit the transactions page to review and, if necessary, update your transaction details.

Public and Private Portfolios

When you create a portfolio, it is either marked as Public or Private. A Public Portfolio allows anyone with the shared secret link to access and view the details of that portfolio.

You can share your public portfolio using the link or the share button in your dashboard.

A Private Portfolio, on the other hand, is completely private and cannot be accessed by anyone except the account owner. Even if someone has the ID or link to the portfolio, they won't be able to view it unless you decide to make it public.

It's important to note that only individual portfolios can be made public or private.

You can also create combined portfolios, you group and visualize your portfolios together. Note combined portfolios will always remain private and cannot be shared with others.

Tracking Stocks, ETFs & Mutual funds

Begin your journey in tracking stocks and ETFs on Allinvestview by adding them manually on the equity booking page or by automating the process with our import tool. Input the ticker symbol to fetch and display data from global exchanges, providing you with real-time market prices, historical performance, and detailed analytics.

Note you can set up Price Alerts on your favourite stocks in the stock details page. You can also manage your Alerts and Email notifications in your account settings.

Please note: Market data on Allinvestview is retrieved on real time every time you load the dashboard, it may include End-of-Day data for mutual funds or 1-5 minute delayed data for other securities. We are constantly striving to provide more immediate real-time updates to enhance your trading strategies.

Customize your experience by selecting specific exchanges. For example, enter "SAN.MC" to track Banco Santander on the Madrid stock exchange, ensuring you receive targeted information suited to your investment portfolio.

Enhance your market awareness by configuring alerts for significant price shifts, dividend announcements, or relevant financial news. These alerts help you stay proactive and make informed decisions without delay.

You can see the individual metrics and financials of each stock by just clicking on its name and a new tab will be opened with Stock details.

If you cannot locate your desired stock on the dashboard, try entering the stock's symbol followed by the stock exchange code (e.g., "ECOPETROL.CL" for Ecopetrol on the Chilean stock exchange) on the booking page. Click on the "Fetch Stock Info" button, and the system will retrieve and import the latest market data for the stock.

Should you have any issue with the market data, please contact our support team!.

How to Close a Position

You can close a position by adding a Selling transaction for that stock. This can be done manually or by importing the transaction.

To close a position manually:

  1. Navigate to the booking page.
  2. Select the stock you want to sell and choose "Sell" in the transaction type dropdown.
  3. Enter the quantity you wish to sell. The 'Available quantity' field will show the shares you can sell from your portfolio.
  4. Review and confirm the transaction. Ensure the quantity does not exceed the available shares.

You can also close a position or buy a new one directly from the dashboard. Simply click on the stock you are interested in, and in the stock details that will appear, press 'New Trade'.

Cash Management

To effectively manage your cash positions, you can add them in cash booking page. Here, you can add all cash holdings, then monitor transactions, track your yield and analyze your liquidity in your Dashboard under "Bonds & Cash".
Allinvestview supports multiple currencies and offers tools for assessing exchange rate impacts and optimizing cash flows.

Also, you can create cash accounts, allowing you to track the cash in your brokerage and automatically add/deduct the transactions from the account (deposits, withdrawals, accrued interest, stock transactions, and dividends).
See more in the Cash Account section.

Bonds Management

Enhance your bond investment strategies using Allinvestview. You can track your portfolio duration, average yield, coupon rates, upcoming coupons and more! Navigate to the bond calculator page to add and price new bonds. Our growing database of bonds provides extensive options, but should you not find your specific bond:

  • Enter details like purchase price, interest rate, maturity, and issuer manually. The bond object will be saved for you as a custom bond in case you want to book it again in the future.
  • Once added, please feel free to ask our support team to add the bond to the database so it's also available for the rest of users!.

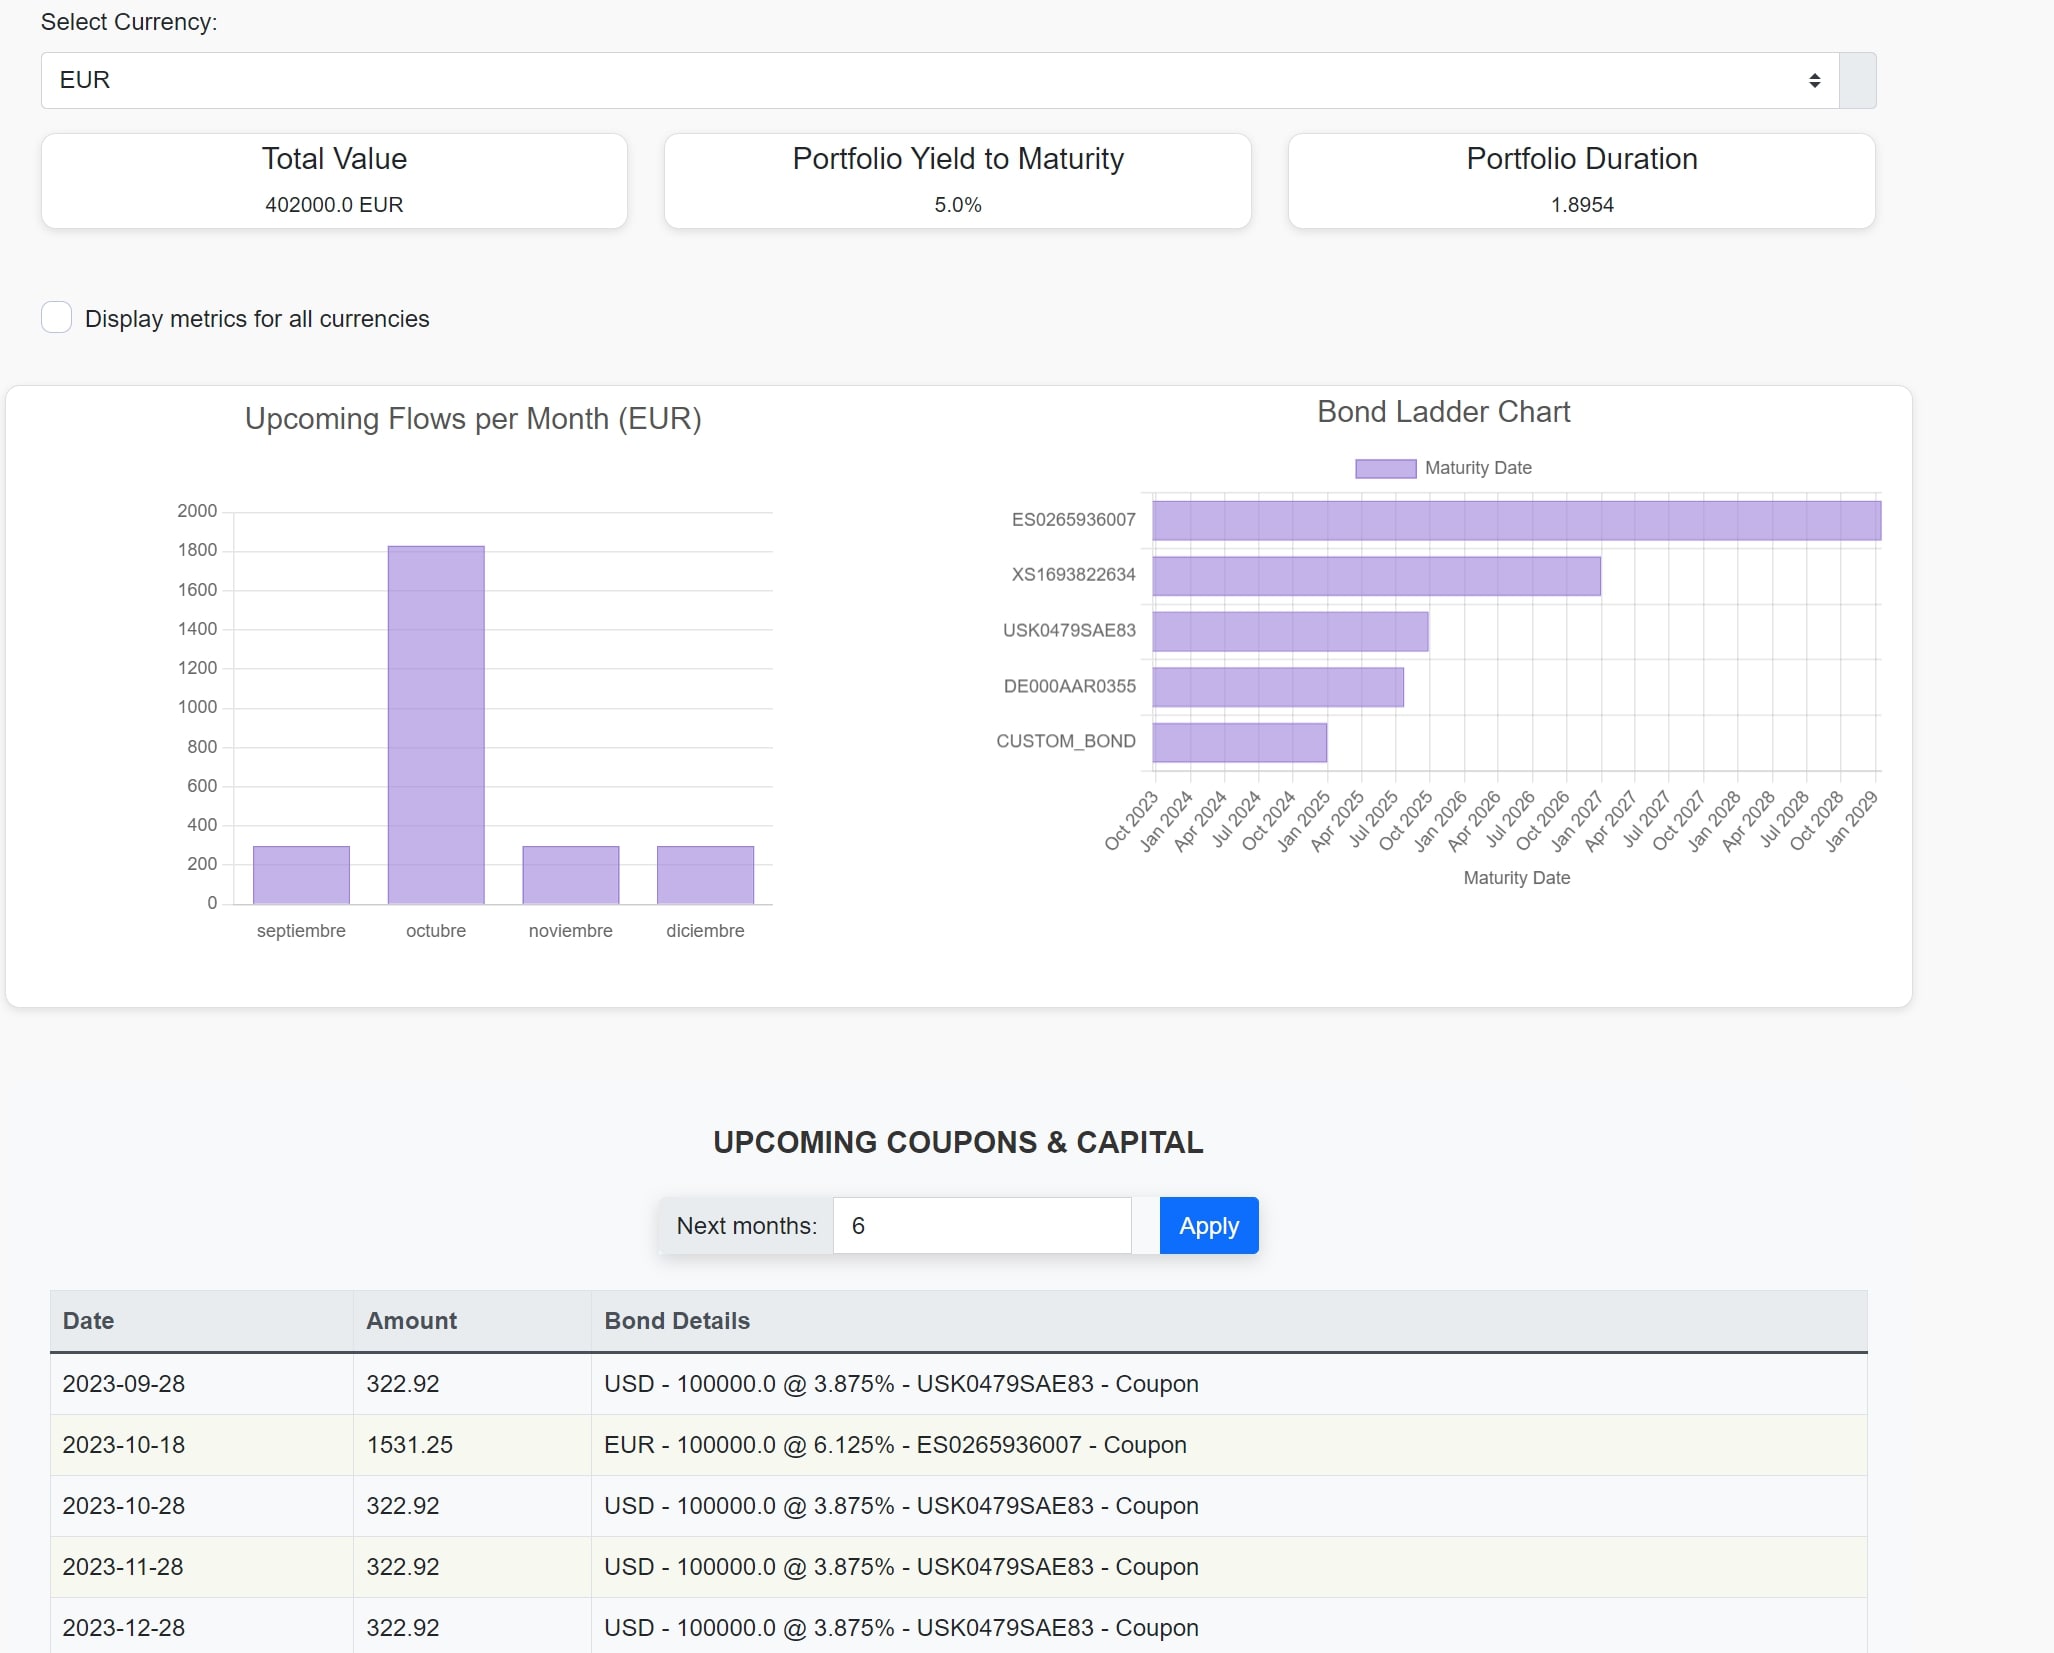
Utilize tools to track yields, durations, and other critical metrics for your portfolio. Track payment schedules, your bond ladder and check upcoming coupons or maturities directly within your dashboard under the "Bond & Cash" tab.

Cryptocurrencies

At Allinvestview, tracking your cryptocurrency investments is streamlined and precise. Add and monitor any cryptocurrency by specifying the crypto symbol followed by the fiat currency of your choice, such as BTCUSD for Bitcoin in US Dollars. This method allows you to view and analyze your digital assets in the currency that best suits your financial strategies.

Prices for all listed cryptocurrencies are refreshed every 5 minutes, ensuring that you have access to the most up-to-date information. This frequent update schedule helps you stay on top of market movements and make timely decisions based on the latest market data.

Custom Assets

Allinvestview enables you to tailor your investment portfolio to include assets that do not fall into conventional categories by using our custom asset booking page. This feature allows you to define and track unique investments such as art, real estate, or even personal projects.

By creating a custom asset, you can specify its name, and market value, and other pertinent details. This flexibility ensures that all parts of your financial portfolio can be managed from one central location, providing a comprehensive view of your total asset allocation.

Utilize the dashboard to view how these custom assets impact your overall investment strategy and portfolio performance. Detailed analytics help you understand the weight of each asset in your portfolio, aiding in better decision-making and strategic planning.

You can also add and maintain a history of market values for each custom asset transaction. This feature allows you to track and visualize the current value and performance over time directly on the dashboard in the "Stock Performance" table.

To record the most recent market value assessment:

  1. Open the custom asset transaction in the dashboard.
  2. Add the market value and date of assessment.
  3. This information will be saved and displayed, allowing you to compare the current market value with the acquisition value.

Understanding Transaction Currency and FX Rates

When booking trades, it's crucial to understand the concepts of transaction currency, stock quoted currency, and how to handle cases where these differ. Ensuring that these are correctly set up will help maintain the accuracy of your portfolio's values.

Transaction Currency vs. Stock Quoted Currency

  • Transaction Currency: The currency in which the trade is recorded.
  • Stock Quoted Currency: The currency in which the stock price is quoted on the market.

In some cases, these currencies may differ (i.e stock is bough using a different currency), requiring the use of an FX rate to accurately reflect the trade's value in your portfolio.

Why This Matters

If the transaction currency and the stock quoted currency are not aligned, it can lead to discrepancies in your portfolio values. For example, a stock might be quoted in pence (GBX) but recorded in pounds (GBP).

How to Correct Currency Discrepancies

  1. Ensure Correct Transaction Currency:

    Align the transaction currency with the stock quoted currency. Example: If a stock is quoted in GBX, the transaction should also be recorded in GBX.

  2. Use FX Rates for Different Currencies:

    If the transaction currency differs from the stock quoted currency, apply an appropriate FX rate. Example: For a stock quoted in GBX but recorded in GBP, use an FX rate to convert between the two.

Practical Steps

  1. Adjusting Transaction Currency:

    Review your trade entries to ensure the transaction currency matches the stock quoted currency.

  2. Setting an FX Rate:

    If the currencies differ, calculate and apply the correct FX rate to convert the trade value. Example: For a stock quoted in GBX and recorded in GBP, apply an FX rate of 0.01 to reflect the conversion accurately.

Summary

  • Transaction Currency: Currency in which the trade is recorded.
  • Stock Quoted Currency: Currency in which the stock is quoted.
  • FX Rate: Applied when transaction currency and stock quoted currency differ.

By understanding and correctly applying these concepts, you can ensure your portfolio reflects accurate values, providing a true representation of your investments. If you have any questions or need assistance, our support team is here to help.
Glossary of Terms and AIV Calculations

AIV Calculations

Allinvestview (AIV) offers a variety of tools and calculations to help you analyze your portfolio performance. Below is a breakdown of how these metrics are calculated:

  • Capital Gain: This represents the total return from investments and is calculated as the sum of Realized Return (from sold positions) and Unrealized Return (from held positions).
  • Realized Return: Calculated based on the chronological accumulation of returns from sold positions. It reflects the actual profit or loss from the positions you’ve exited.
  • Unrealized Return: The gain or loss from the positions you currently hold in your portfolio but have not yet sold.
  • Average Price: This is the average of all bought positions, weighted by the quantities purchased. It helps provide an overview of the average cost of your holdings.
  • % Percentage of Capital Return: The percentage shown in the Capital Gain box represents the % Total Return, calculated as the Capital Gain divided by the Initial Investment, including any sold positions. Capital Gain includes both realized and unrealized gains.
  • Capital Return Total Initial Investment × 100

    Where:

    Capital Return = Realized Return + Unrealized Return Total Initial Investment = Initial Nominal of Sold Positions + Initial Nominal of Active Positions
  • Percentage Return in Realized Return Column: This percentage reflects the realized gain divided by the initial nominal value of sold positions. It helps provide insights into how much return you’ve generated from the positions you’ve exited.

Cash Account

The Cash Account tracks all cash-related transactions such as deposits, withdrawals, stock buys, sells, and dividends. It provides a clear view of your cash flow and balance, helping manage liquidity across your portfolio. Cash accounts are often separated by currency, allowing you to track balances in different currencies.

Transaction Currency vs. Stock Currency

When trading stocks, the Transaction Currency refers to the currency in which the stock is bought or sold (e.g., USD, EUR), whereas the Stock Currency is the currency in which the stock is quoted on the market (e.g., a stock traded on the London Stock Exchange might be quoted in GBP). If these currencies differ, a foreign exchange (FX) rate is applied to accurately reflect the trade's value in your portfolio.

Efficient Frontier & Portfolio Analytics

  • Efficient Frontier: A concept from Modern Portfolio Theory (MPT), it represents the set of portfolios that offer the highest expected return for a given level of risk. Portfolios on the efficient frontier are considered optimally balanced between risk and reward.
  • Correlation Matrix: A table showing the correlation coefficients between sets of variables. In portfolio management, it indicates how different assets move in relation to each other, helping in diversification decisions.
  • Volatility: A statistical measure of the dispersion of returns for a given security or market index. Higher volatility indicates a riskier asset with more potential for larger price swings.
  • Beta: A measure of how much a stock or portfolio moves in relation to the overall market. A beta of 1 indicates that the stock moves with the market, greater than 1 indicates more volatility than the market, and less than 1 indicates less volatility.
  • Sharpe Ratio: A measure of risk-adjusted return. It is calculated by subtracting the risk-free rate from the portfolio's return, and dividing the result by the portfolio’s standard deviation (volatility). A higher Sharpe Ratio indicates better risk-adjusted returns.

General Investment Terms

  • IRR (Internal Rate of Return): A metric used to evaluate the profitability of investments, representing the annualized rate of return generated by an investment.
  • TWR (Time-Weighted Return): A measure of portfolio performance that eliminates the impact of cash inflows or outflows, showing how well an investment has grown over time.
  • MWR (Money-Weighted Return): Similar to IRR, this metric reflects the returns on an investment, taking into account the timing and amount of external cash flows.
  • Dividend: A distribution of a portion of a company's earnings to its shareholders, typically in the form of cash or additional stock.
  • Ex-Dividend Date: The cutoff date to qualify for a dividend. Investors who purchase the stock after this date will not receive the dividend.
  • Record Date: The date on which the company determines the shareholders eligible to receive the dividend.
  • Payment Date: The date when the dividend is actually paid to shareholders.
  • Price-to-Earnings (P/E) Ratio: A valuation ratio of a company's current share price compared to its earnings per share.
  • Yield: The income return on an investment, such as the interest or dividends received from holding a security.
  • Forex (FX) Rate: The exchange rate between two currencies, used to convert foreign currency transactions to a domestic value.
  • Portfolio Diversification: A risk management strategy that mixes a wide variety of investments to reduce the overall risk of a portfolio.
  • Equity: The value of an ownership interest in an asset or business, often referred to as stock in the context of investments.
  • Bond Duration: A measure of the sensitivity of a bond’s price to changes in interest rates, expressed in years.
  • Convexity: A measure of the curvature in the relationship between bond prices and bond yields, demonstrating the degree of change in duration as yields fluctuate.

For more details on investment terminology and how these metrics apply to your portfolio in Allinvestview, feel free to explore the different sections or contact support if you need further clarification.

Importing Data

Explore multiple user-friendly options to import your transactions interactively:

  • Import transactions from anywhere, including spreadsheets, or simply copy and paste
  • Choose from our supported brokers (feature under construction)
  • Automatically import from other apps (feature under construction)

Note: This feature is currently in beta mode and under active development. Your feedback is invaluable as we enhance its functionality.

Import your investment data seamlessly into AllInvestView using the following methods:

Import from Broker or Financial App

Simplify the process by importing transactions directly from your broker or financial app:

  1. Find Your Broker: AllInvestView provides built-in templates for common brokers and apps. If yours isn't listed, you can create a custom template or contact support for assistance.
  2. Export Transactions: Export your transactions from your broker or app according to their instructions. Then, simply drag and drop the file into AllInvestView.
  3. Match Your Assets: Review and confirm the proposed asset matches or select alternatives. Customize asset details as needed.
  4. Review & Confirm: Review the imported data, make any necessary adjustments, and confirm your account balances are accurate.

Import from any File or Table

Import transactions from any file format with ease:

  1. Open Your File: Simply open your CSV or XLSX file directly in AllInvestView. Alternatively, you can copy and paste data from any table.
  2. Match Columns: AllInvestView requires specific columns from your file to accurately process your transactions. Ensure the following columns are matched to the corresponding transaction properties:
    • Asset: The name or identifier of the investment asset being transacted.
    • Date: The date of the transaction.
    • Quantity: The quantity or amount of the asset being transacted.
    • Price: The price per unit or total value of the transaction.
    • Currency: The currency used for the transaction.
    • Portfolio: The portfolio or account associated with the transaction.

    Additionally, you have the option to match the following optional columns:

    • Broker: The name or identifier of the broker associated with the transaction.
    • FX Rate: The foreign exchange rate, if applicable.
    • Fee: Any fees or charges associated with the transaction.
    • Type: The type or category of the transaction (e.g., buy, sell, corporate action).

    For custom bond transactions not available in our database, you can add additional columns to match specific bond details:

    • Rate: The interest rate of the bond.
    • Maturity Date: The maturity date of the bond.
    • Issue Date: The issue date of the bond.
    • Quotation: The quotation or trading symbol of the bond.
    • Issuer: The issuer of the bond.
    • Frequency: The frequency of interest payments for the bond.
    • Lot Size: The lot size or minimum quantity for trading the bond.

Review the imported data, make any necessary adjustments, and confirm your account balances are accurate before finalizing the import process.

Add your holdings manually

Also, you can simply add transactions manually using our powerful booking page:

Choose the method that best fits your workflow and start managing your investments effortlessly with AllInvestView.

Broker Synchronization

Overview

By linking your brokerage accounts, your holdings and transactions will be automatically imported and synchronized nightly. This means you no longer need to manually update your portfolio after each trade or dividend reinvestment.

How it Works

  1. Choose your brokerage and connect your account securely using SnapTrade, a trusted third-party integration. Your login credentials are encrypted and will never be shared.
  2. Once connected, your portfolio data, including holdings and transactions, will sync automatically every night, ensuring your information is always up to date.
  3. You can manually trigger a synchronization anytime by visiting the Broker Connection page under the Active Connections section. From there, you can refresh or remove the connection with your broker.

1 Portfolio = 1 Link

Each portfolio is linked to a specific broker, ensuring that your data is synced accurately with the corresponding account.

If you want to sync with a different broker, simply create a new portfolio for that broker.

You can also create a combined portfolio in your dashboard to easily manage all your portfolios in one place.

Supported Brokers

Here are some brokers you can connect (and many more!):

Degiro Logo Degiro
Schwab Logo Schwab
Fidelity Logo Fidelity
Robinhood Logo Robinhood
IBKR Logo IBKR

For a complete list of supported brokers, please visit our partner's page at SnapTrade Supported Brokers.

How to Connect

Note: This feature is available with our Trial and Advanced Plus plans. By connecting your brokerage account to Allinvestview, your portfolio will automatically sync with your brokerage account every night. This eliminates the need for manual updates, making portfolio management seamless and efficient.

To get started, link your account to your brokerage via SnapTrade. Once connected, your active portfolio will be mapped to your brokerage, and transactions will be imported seamlessly.
Please note that each portfolio is linked to a specific broker. If you'd like to sync with a different broker, you can create a new portfolio. Additionally, you have the option to create a combined portfolio on your dashboard to manage all your portfolios in one place.

Connecting to Interactive Brokers

To connect your Interactive Brokers (IBKR) account to AllInvestView, you'll need to enable SnapTrade in your IBKR account as a Third-Party Service. This will allow your portfolio data to sync smoothly.

Follow this guide to enable the service, and note that it may take 24-48 hours for data to appear.

Steps to Enable SnapTrade in IBKR

1. Log in to your IBKR account.

2. From the Menu, go to Reporting and select Third-Party Reports.

3. Select the gear icon to enable SnapTrade from the list.

4. After saving, SnapTrade will appear under your enabled Third-Party Services.

Synchronization Details

Your holdings and transactions are updated automatically every night. You can manually refresh the data on the Active Connections section.
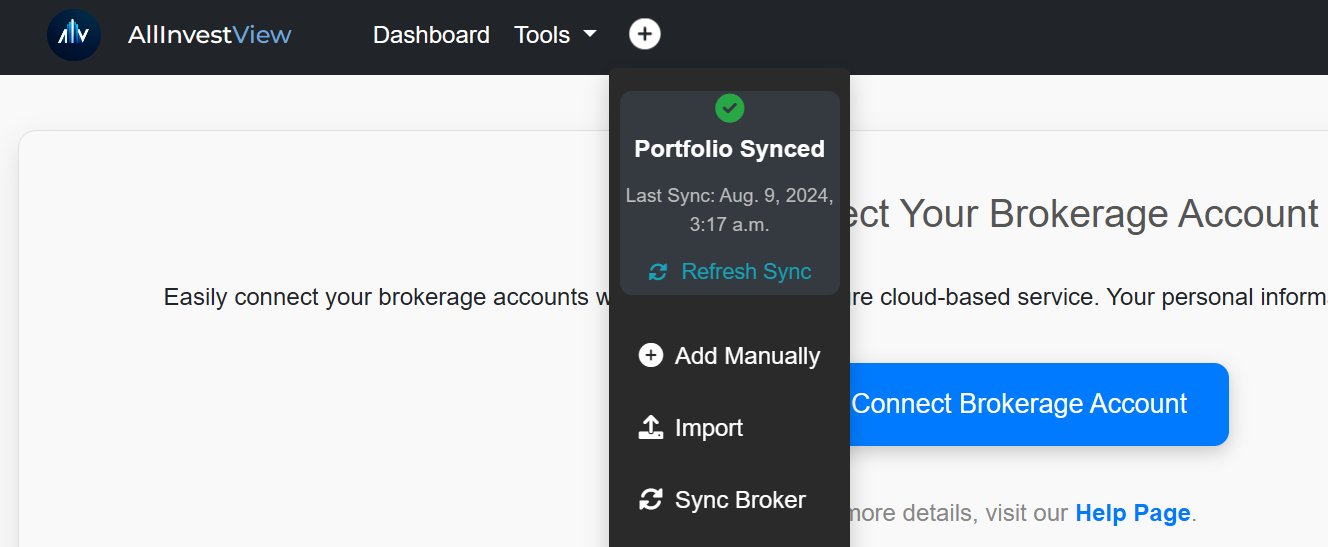
You can also manually Refresh the sync quickly from the 'Add' button.

Broker Sync Feature

Importing Full Transaction History

  1. Connect your brokerage account.
  2. Review the imported trade history. If all data since your first trade is present, no further action is needed.
  3. Note that brokers may limit transaction history visibility. If historical data is missing, visit the Import Page and click Import. Upload a spreadsheet or import directly from your broker’s report.

When connecting to your broker, we import your transaction history and adjust balances with special trades as needed to match the balance from the broker, in case of mismatches with the imported transactions due to limit transaction history.
If some data since your first trade is missing, visit the Import Page and upload a spreadsheet directly from your broker’s report. If your broker isn’t supported, you can manually upload a custom trade history file (csv/text) via the Import page.

FAQs

What brokers are currently supported?

How secure is my data during synchronization?

How often is my portfolio synchronized?

What should I do if I encounter issues with synchronization?

Features Overview

The Features section offers a comprehensive exploration of the functionalities available within Allinvestview. Discover the extensive tools designed to enhance your investment management experience.

This part of our help guide supports you in efficiently tracking investments, customizing your user experience, managing finances, and leveraging advanced analytics. Learn how to effectively utilize these tools to optimize your financial strategy and decision-making processes.

Understanding Portfolio Allocations

Allocations are a strategic way to organize your investment portfolio based on criteria like asset class, sector, or investment strategy. For example, you can customize your asset classes, adding your Bond Funds in the bond category (instead of Funds) along with your individual bonds for better monitoring of your asset allocation. Here’s how you can maximize their use:

  • Gain a clearer view of your portfolio's diversification and risk exposure.
  • Track performance by allocation to make informed investment decisions.
  • Balance your portfolio effectively, aligning it with your investment goals.

Managing Your Portfolio Allocations

Customize your allocations on the stock management page. Organizing your portfolio into allocations is straightforward and highly customizable:

  • Drag & Drop: Assign assets to allocations with a simple drag-and-drop action, reflecting your investment strategy.
  • Create Allocations: Customize your portfolio with as many allocations as needed.
  • Empty Allocation Stocks: Quickly identify assets that are not yet allocated, ensuring that each part of your portfolio is working towards your goals.
  • Save Your Changes: Always remember to save your changes to preserve your portfolio structure.

Creating Target Allocations

Setting target allocations is an essential part of managing your portfolio, as it helps you stay aligned with your investment strategy and risk tolerance. Here's how you can create and manage your target allocations:

  • Navigate to the stock management page.
  • Set Your Targets: For each allocation category, specify the target percentage of your total portfolio value you aim to invest. For example, you might set a target of 40% for bonds, 30% for equities, and 30% for real estate.
  • Review Regularly: Periodically review your target allocations to ensure they still align with your investment goals and market conditions.
  • Rebalance as Needed: Use the rebalancing feature to adjust your portfolio back to your target allocations. This helps in maintaining the desired risk-return profile of your investments.

Understanding Portfolio Rebalancing

Portfolio rebalancing is the process of realigning the weightings of your portfolio assets to maintain a desired risk and return profile. Over time, due to changes in market prices, your portfolio's allocation can drift away from its target allocation. Rebalancing helps bring your portfolio back to its original allocation.

How to Use the Portfolio Rebalancing Tool

Follow these steps to rebalance your portfolio:

  • Navigate to the Rebalancing page.
  • Review your current and target allocations for each category in your portfolio. The blue bar represents your current allocation, and the light blue bar indicates your target allocation.
  • Enter the amount you want to invest or withdraw in the "Amount to Allocate" field.
  • Select whether you are making a "Deposit" or a "Withdrawal".
  • Enable or disable selling by checking the "Allow Selling" option. Enable selling will increase the amount available to allocate from overallocated categories.
  • To minimize transactions, check the "Minimize Transactions" option. This will focus on the most impactful transactions to achieve the target allocation.
  • Click the "Rebalance" button to start the rebalancing process. The system will optimize the rebalancing based on your inputs and constraints.
  • Enable the "Recommend Based on Price" option to prioritize buying stocks that are currently cheaper compared to their average purchase price.

Rebalance Details

After clicking the "Rebalance" button, the Rebalance Details section will show the recommended transactions. Each transaction will indicate the category, current amount, target amount, action (Buy/Sell), amount, expected allocation, and target allocation. The results will be color-coded: green for Buy actions and red for Sell actions.

  • Current Amount: The amount currently allocated to a category.
  • Target Amount: The desired amount to be allocated to a category.
  • Action: Indicates whether you should buy or sell assets in the category.
  • Amount: The amount to be bought or sold.
  • Expected Allocation: The expected allocation percentage after the rebalancing.
  • Target Allocation: The target allocation percentage for the category.

Stock Details

In the Stock Details section, you can find detailed information about each stock in the selected category. The stock with the best price ratio (current price to average price) is marked as the "Cheapest".

  • Stock Name: The name of the stock along with its logo.
  • Average Price: The average purchase price of the stock.
  • Current Price: The current market price of the stock.
  • Total Value: The total value of the stock holdings.
  • Shares to Allocate: The number of shares that can be bought with the available amount.
  • Cheapest: The stock with the best price ratio is flagged as the "Cheapest".

FAQs

What if I don’t want to sell any assets?
Simply leave the "Allow Selling" option unchecked. The algorithm will only recommend buying actions.

Can I rebalance without adding new funds?
Yes, you can. If selling is allowed, the algorithm will use overallocated funds to buy underallocated assets.

How often should I rebalance my portfolio?
It depends on your investment strategy. Some investors rebalance annually, while others do so quarterly or when allocations drift significantly from targets.

What happens if my target allocations are not set up?
The system needs target allocations to provide rebalancing recommendations. Ensure your target allocations are set up in the Stock Management section.

Important Considerations

  • Target Allocations: Ensure that your target allocations are correctly set up in the Stock Management section.
  • Transaction Costs: Keep in mind that frequent buying and selling might incur transaction costs, which can affect your portfolio's overall performance.
  • Market Conditions: Rebalancing does not guarantee profits or protect against losses. Always consider current market conditions before making rebalancing decisions.

Reports Overview

The Reports feature in Allinvestview provides detailed insights into your financial activities. From tracking portfolio performance to managing tax reporting, our comprehensive reports are designed to help you maintain a clear overview of your investments. Access these informative reports through the reports page to view all your transactions, analyze your portfolio's performance, and prepare for tax season.

Have ready any report in a professional PDF format or Excel file as per your needs.

We are constantly enhancing our selection of reports to better meet your needs. If there is a specific report you would like to see, please contact us. Your feedback is invaluable as we strive to improve our services.

Key Reports

  • Tax Report: Provides an overview of holdings and realized returns, specifically designed to assist with tax preparation.
  • All Transactions: Displays all transactions within a specified time frame, allowing for detailed financial tracking and analysis.
  • Dividend Report: Provides a report for dividend income for the year including any dividend reinvestment plans.

Advanced Analytics

Access deep analytical tools on the "Analytics" tab in your dashboard to explore and optimize your investment strategy. These tools apply complex statistical models to provide insights into risk management and asset performance, enabling you to make informed decisions based on robust data analysis.

Efficient Frontier Analysis

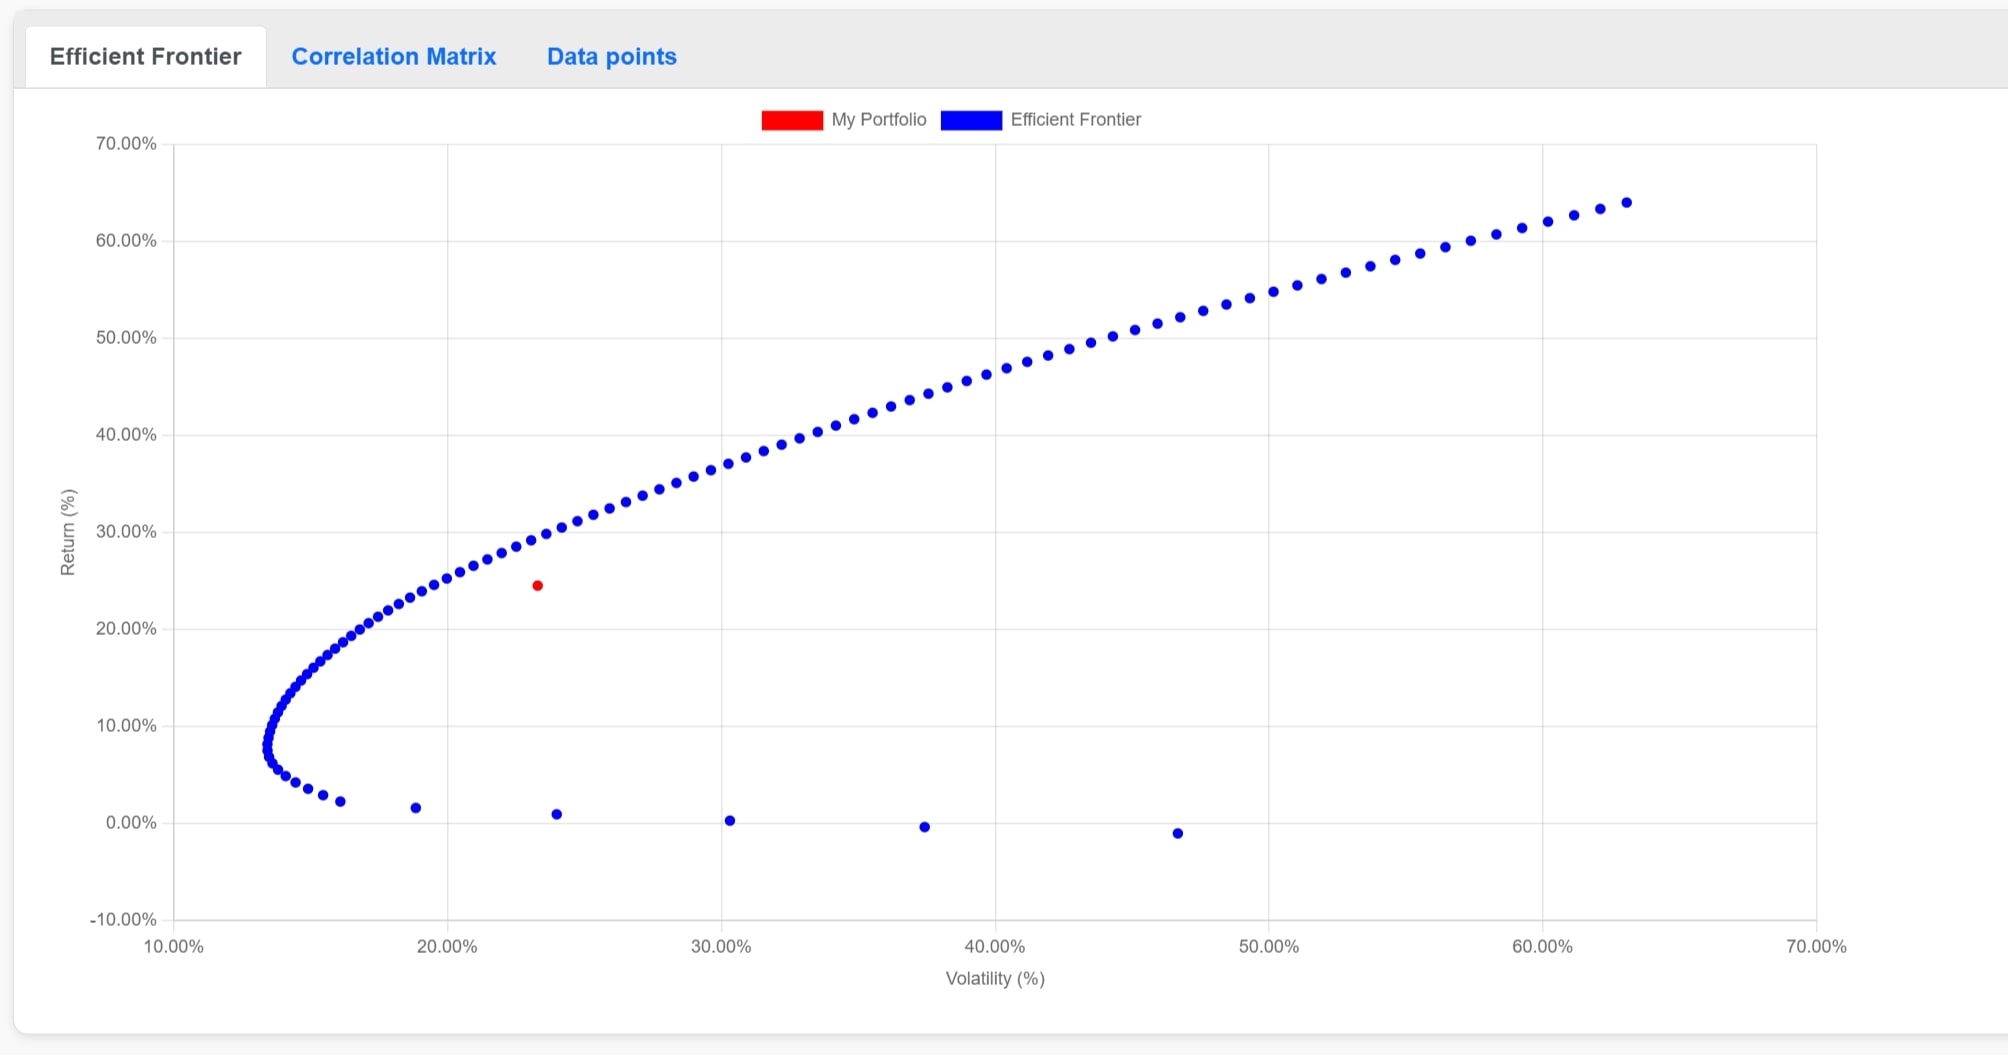
The Efficient Frontier represents portfolios that provide the highest expected return for a given level of risk, based on modern portfolio theory. This analysis allows you to:

  • Visualize and Optimize: Plot your current portfolio on the frontier to assess its efficiency against those that theoretically offer better returns for the same risk.
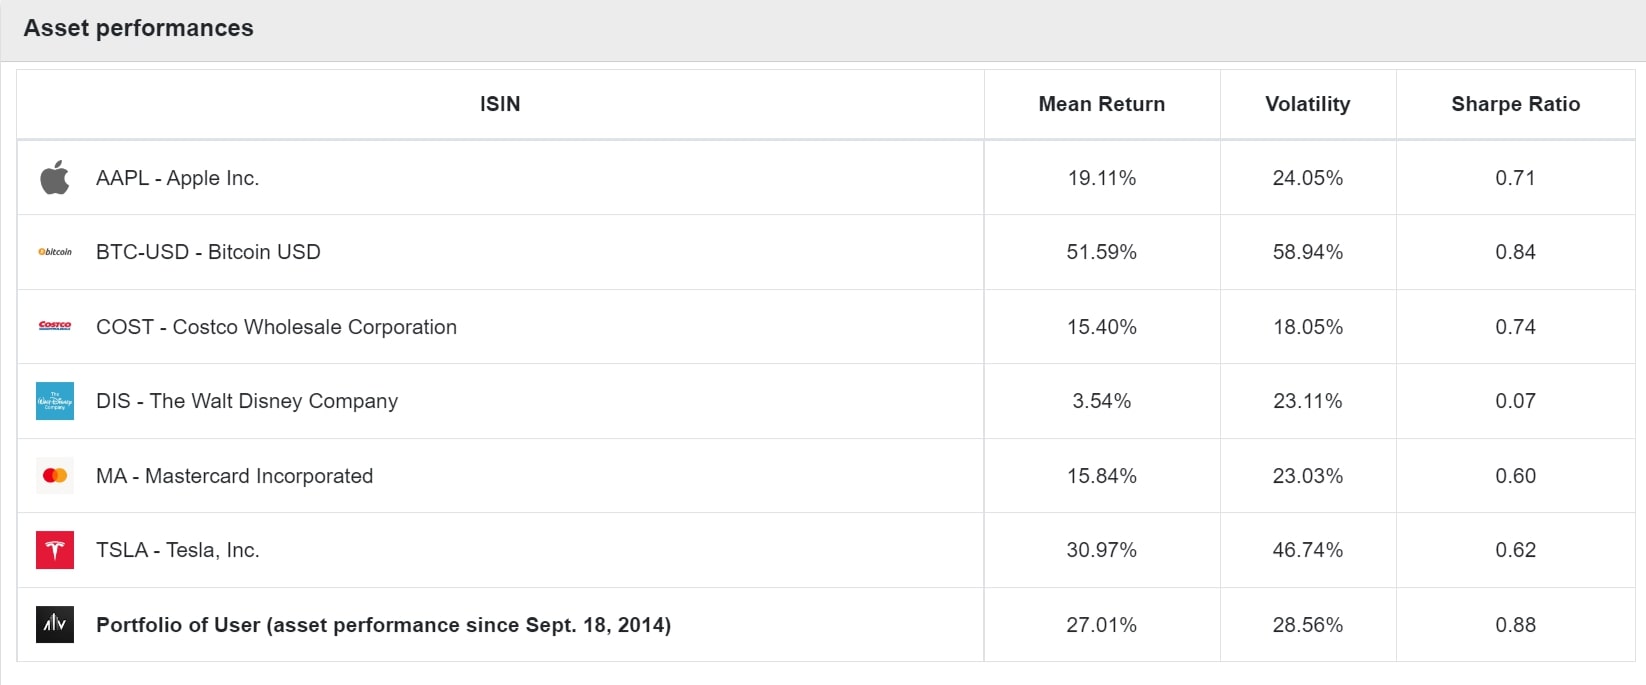
  • Dive Deeper: Access the Data Points tab to explore detailed metrics such as mean returns, volatility, and Sharpe ratios for portfolios along the frontier.

Correlation Matrix

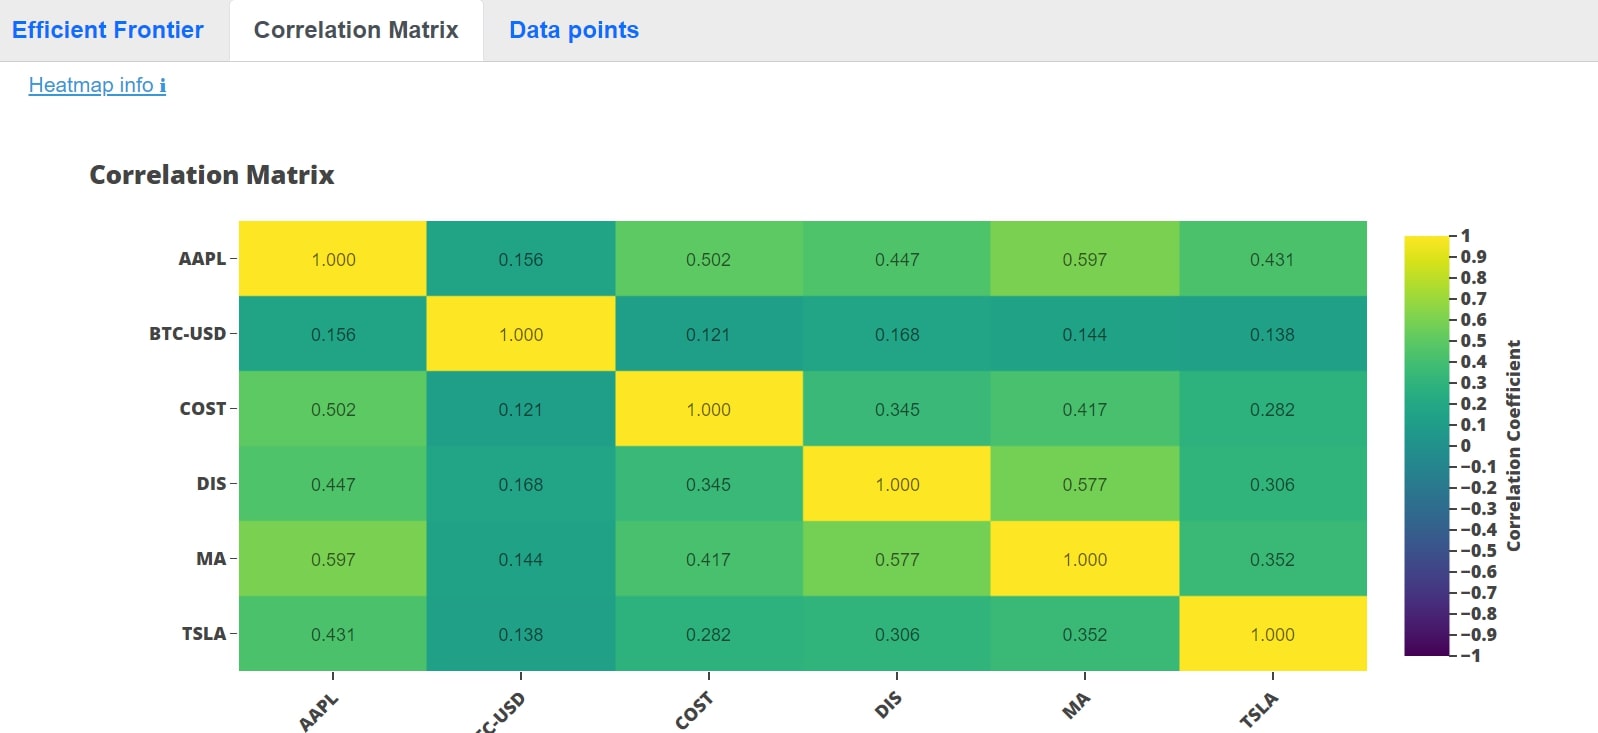
Analyze how different assets in your portfolio relate to each other using the Correlation Matrix. This tool provides:

  • Intuitive Heatmaps: Color-coded heatmaps show the strength of relationships between assets, helping you manage diversification and understand risk concentrations.
  • Correlation Coefficients Explained: Values range from -1 (perfect negative) to +1 (perfect positive), with zero indicating no correlation, aiding in strategic asset allocation.

Asset Performance Visualization

Examine the risk and return characteristics of various assets within your portfolio with our performance visualization tools. These graphics assist you in understanding which investments are performing well and which may be dragging down your portfolio's overall performance.

Dividend Management

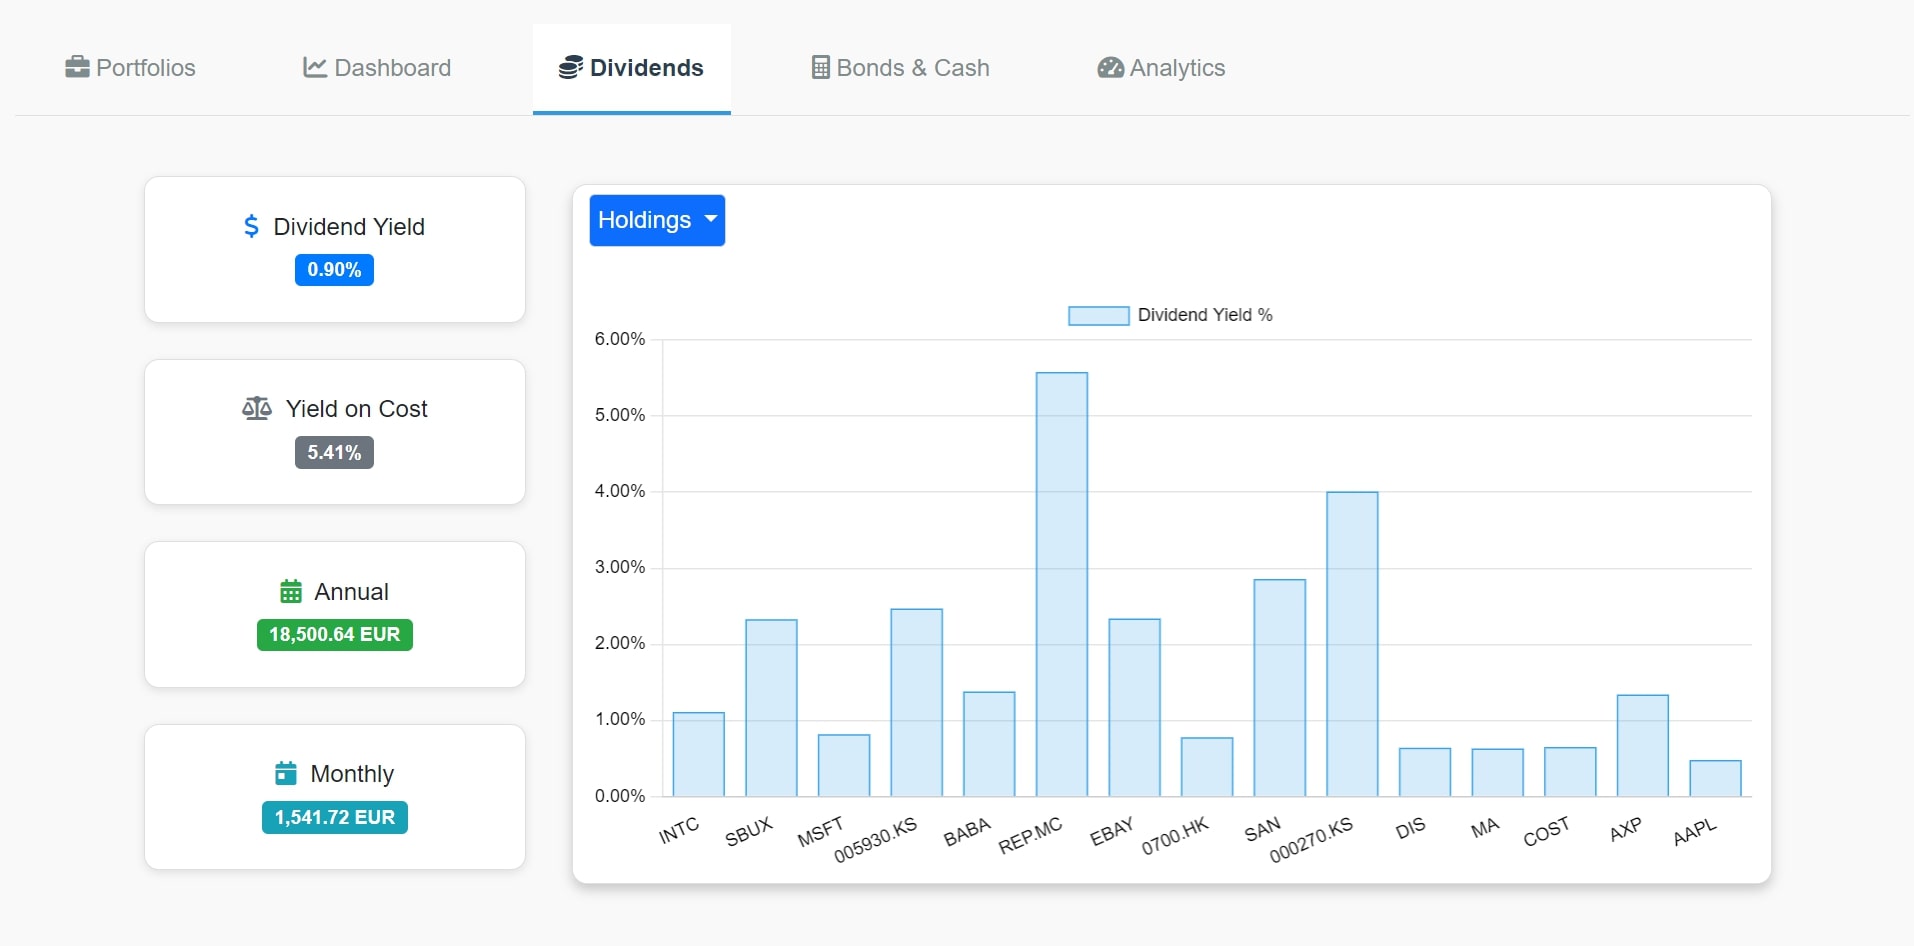
Dividends represent a significant part of investment returns. Allinvestview automates and simplifies the process of tracking and managing dividends through comprehensive analytics and real-time updates. This functionality is accessible from the 'Dividends' tab in your dashboard.

Automated Dividend Tracking

Allinvestview automatically calculates dividends based on your stock holdings, updating them in real time as new dividends are announced:

  • Real-Time Updates: The system tracks and updates your dividend receipts as soon as they are announced, ensuring you have the latest information.
  • Detailed Analytics: Dive deep into your dividend income with analytics that break down yield on cost, projected annual dividends, and more.

Dividend Analytics Tools

Understand and manage your dividends more effectively with tools designed to analyze and enhance your dividend strategy:

  • Yield on Cost Analysis: Monitor how much each stock contributes to your overall yield based on the cost of your investment.
  • Cross-Currency Dividend Tracking: Assess your dividend returns across multiple currencies, accommodating for any foreign investments.

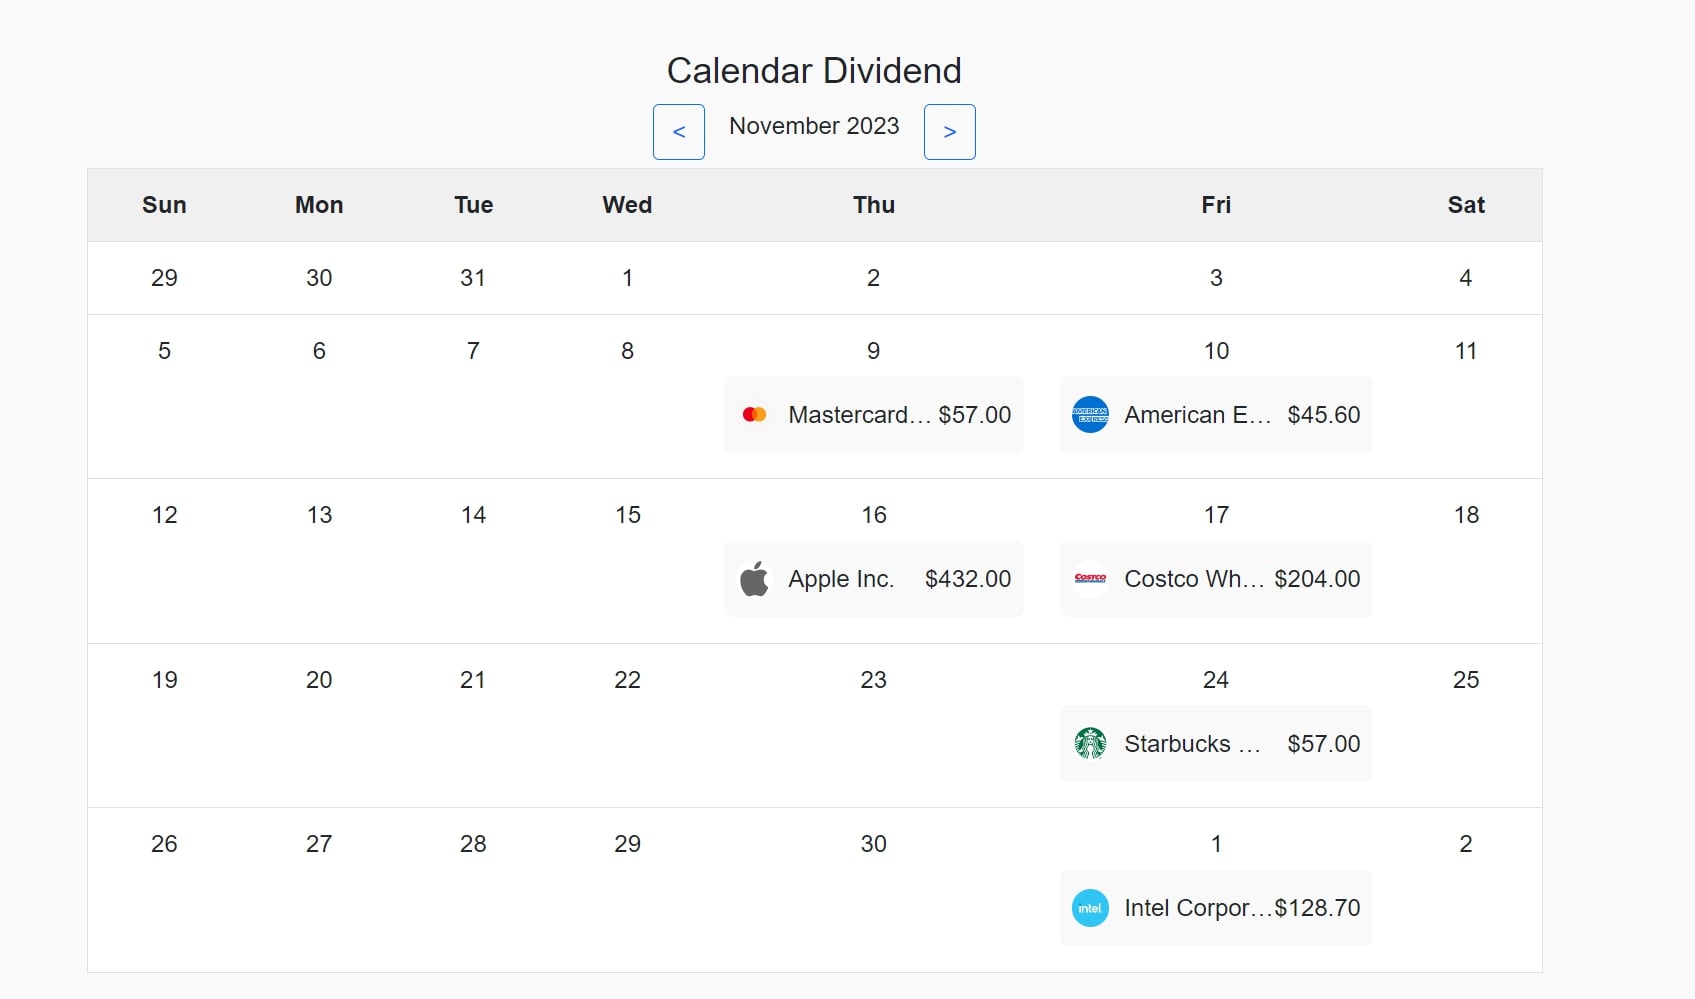
Dividend Calendar

The Dividend Calendar provides a visual representation of when to expect dividend payments, aiding in financial planning and investment decisions:

  • Interactive Calendar: Visualize and manage upcoming and past dividends, helping you plan your cash flow and reinvestment strategies.

Dividend Graphs

Dividend Growth and Estimated Monthly dividends graphs provide a comprehensive visual analysis of your dividend income over time, helping to enhance your strategic planning and investment decisions. These graphs are designed to:

  • Visualize Earnings Trends: Track the growth or decline of your dividend income through visually intuitive graphs. This enables you to quickly assess the performance of your investments and adjust strategies as needed.
  • Forecast Upcoming Dividends: With projections based on historical data and declared dividends, you can see future payments at a glance, which is essential for cash flow management and reinvestment planning.

Corporate Actions Management

Corporate actions such as stock splits, mergers, and dividends can significantly impact your portfolio. Allinvestview simplifies the management of these actions by automatically suggesting trades and allowing for easy amendments. This functionality is accessible from the Corporate Actions section.

Automated Corporate Action Tracking

Allinvestview tracks corporate actions and suggests trades that need to be booked based on your current holdings. Key features include:

  • View Suggested Trades: See a list of trades that need to be booked based on recent corporate actions.
  • Book Trades: Click the "Book" button to automatically book the suggested trades in Allinvestview.
  • Amend Trades: Use the "Amend" button to modify existing trades if necessary, ensuring all corporate actions are accurately reflected in your portfolio.

A synthetic trade is created at day of the split (price = 0), with the quantity of shares that has been received by the Split according to the number of shares you were holding at the time of the Split.

How to Use

To manage your corporate actions:

  1. Navigate to the Corporate Actions section in your dashboard.
  2. Review the list of suggested corporate actions.
  3. Click on "Book" to automatically book the suggested trades.
  4. If needed, click on "Amend" to make any necessary adjustments to existing trades.

Benchmarking Your Portfolio

Benchmarking allows you to compare your portfolio's performance against a standard index or ETF, helping you to assess the effectiveness of your investment strategy. Allinvestview makes this process easy by allowing you to select a benchmark and view comparative performance charts. This functionality is accessible from the Dashboard.

Selecting a Benchmark

You can choose a benchmark index or ETF to compare against your portfolio. Some popular options include:

  • VOO: SP500
  • IVV: iShares Core S&P 500 ETF
  • SPY: SPDR S&P 500 ETF Trust
  • DIA: SPDR Dow Jones Industrial Average ETF Trust
  • QQQ: Invesco QQQ Trust
  • IWM: iShares Russell 2000 ETF

Viewing Benchmark Performance

The Portfolio Growth chart on the dashboard shows your portfolio value, invested capital, and the benchmark's performance. This allows you to:

  • Compare Growth: See how your portfolio's value changes over time compared to the benchmark. Assuming you made the same contributions to the benchmark as to your portfolio.
  • Evaluate Performance: Assess whether your portfolio is outperforming or underperforming the benchmark.

How to Set a Benchmark

To set your benchmark index or ETF:

  1. Navigate to your Profile settings.
  2. Under Preferences, select your desired benchmark ticker from the dropdown menu.
  3. Save your preferences.
  4. Go to your Dashboard to see the updated Portfolio Growth chart with your selected benchmark.

Understanding Portfolio Growth

The Portfolio Growth Chart illustrates the value progression of your portfolio over time. It helps you visualize how your investments have grown or shrunk, taking into account both capital appreciation and any dividends received. This section aims to explain the components of the chart and how to interpret it effectively.

Include Realized Toggle

The Include Realized toggle allows you to choose whether to include realized gains and losses in the portfolio value:

  • On: Includes both realized and unrealized gains and losses, providing a more comprehensive view of your portfolio's performance.
  • Off: Shows only unrealized gains and losses, focusing on the current market value of your investments.

Time Frame Selection

You can select different time frames to view the growth of your portfolio over specific periods:

  • YTD: Year to date.
  • 1 Year: The past year.
  • 5 Years: The past five years.
  • Max: The entire available history.

Understanding Annual Returns

The Annual Returns Chart provides insights into the performance of your portfolio over each year. It allows you to compare Time-Weighted Return (TWR) and Money-Weighted Return (MWR) to understand different aspects of your portfolio’s performance. This section aims to explain these concepts and help you interpret the chart effectively.

Time-Weighted Return (TWR)

Time-Weighted Return (TWR) measures the compound rate of growth of your portfolio, excluding the impact of cash flows (deposits and withdrawals). TWR is particularly useful for comparing the performance of different portfolios or investment managers.

  • Calculation: TWR is calculated by dividing the portfolio into sub-periods and computing the return for each sub-period. The returns are then compounded to get the overall TWR.
  • Use Case: Ideal for assessing the performance of investment strategies without the distortion caused by cash flows.

Money-Weighted Return (MWR)

Money-Weighted Return (MWR), also known as the Internal Rate of Return (IRR), takes into account the timing and size of cash flows. It reflects the overall return of the portfolio, considering the impact of deposits and withdrawals. MWR provides a more personalized view of performance as it reflects the investor's actual return, considering the specific cash flow events.

  • Calculation: MWR is calculated by finding the discount rate that makes the net present value (NPV) of the cash flows equal to zero. It considers the exact dates and amounts of all cash inflows and outflows.
  • Use Case: Useful for understanding the impact of your investment decisions, such as the timing and amount of deposits and withdrawals.

Switching Between TWR and MWR

You can easily switch between TWR and MWR to get different perspectives on your portfolio's performance:

  • TWR: Provides a view that is independent of cash flow timing.
  • MWR: Offers a view that incorporates the impact of cash flows.
To toggle between TWR and MWR:
  1. Navigate to the Annual Returns section on the Dashboard.
  2. Click on the TWR or MWR button to switch the view.

Understanding Portfolio Returns

The Portfolio Returns Chart provides a visual representation of your portfolio's return over time. It helps you track the performance of your investments and understand the impact of market changes on your portfolio. This section aims to explain the components of the chart and how to interpret it effectively.

Data Displayed

The chart displays:

  • Portfolio Return %: The percentage return of your portfolio at each point in time.

Include Realized Toggle

The Include Realized toggle allows you to choose whether to include realized gains and losses in the return calculation:

  • On: Includes both realized and unrealized gains and losses, providing a more comprehensive view of your portfolio's performance.
  • Off: Shows only unrealized gains and losses, focusing on the current market value of your investments.

Time Frame Selection

You can select different time frames to view the returns of your portfolio over specific periods:

  • YTD: Year to date.
  • 1 Year: The past year.
  • 5 Years: The past five years.
  • Max: The entire available history.

Cash Account Management

The Cash Account feature in AllInvestView allows you to track the cash in your brokerage and automatically add or deduct the transactions in your portfolio, including deposits, withdrawals, accrued interest, stock transactions, and dividends. This feature helps you maintain a comprehensive view of your cash flow and manage your investments more efficiently.

Activating the Cash Account

To activate the Cash Account feature, navigate to your account settings and toggle the cash account option. Once activated, you can manage your cash transactions from the Bond & Cash tab of the dashboard.

If you'd like to use the Cash Account but prefer it not to impact your portfolio value, you can configure this in the Transaction screen of the Cash Account. Simply disable the "Include Cash in Portfolio Value" option. This way, you'll still be able to track and manage your cash transactions separately without affecting your overall portfolio metrics.

It's important to note that the Cash Account allows for negative balances. Therefore, it's highly recommended to add at least one initial deposit to act as the opening balance to reflect the desired cash value in your account. This ensures that your portfolio's cash flow is aligned with your actual cash position.

Adding Cash Transactions

To add a cash transaction, follow these steps:

  1. Click on the "Add Transaction" button in the Bond & Cash screen.
  2. In the modal that appears, select the type of transaction (Deposit, Withdrawal, Interest Accrued or Currency Conversion).
  3. Enter the amount of the transaction.
  4. Select the currency. By default, this will be set to your cash account currency or your default currency.
  5. If the transaction is a deposit or interest accrued, you can also specify an interest rate if applicable. This is the interest rate your broker applies to the cash balance in your account.
  6. Select the date of the transaction.
  7. Click "Save" to add the transaction to your cash account.

Transaction Types

There are four transaction types available:

  • Deposit: Add funds to your cash account.
  • Withdrawal: Remove funds from your cash account.
  • Interest Accrued: Add interest earnings to your account. Specify the interest rate if applicable. More details below.
  • Currency Conversion: Convert funds from one currency to another. More details next.

Currency Conversion

The Currency Conversion feature enables you to transfer funds between two different currencies within your cash account. This is particularly useful when managing multi-currency portfolios, allowing you to convert between currencies based on exchange rates and optimize your cash balances.

Currency conversions create two automatic transactions: a withdrawal in the original currency, and a deposit in the new currency. This keeps your cash accounts balanced and ensures that currency movements are properly reflected in your overall portfolio.

How to Perform a Currency Conversion:

  1. Select Currency Conversion from the transaction type dropdown menu in the "Add Transaction" form.
  2. Specify the target currency you wish to convert to (e.g., EUR).
  3. Enter the amount you wish to convert from in the original currency (e.g., 10,000 USD).
  4. Select the original currency from which you are converting (e.g., USD).
  5. Provide the FX rate (exchange rate) for the conversion (e.g., 1.12 for USD/EUR). The system will automatically calculate the equivalent amount in the new currency based on this rate.
  6. The equivalent amount in the new currency (e.g., EUR) will be displayed based on the provided FX rate (e.g., 8,928 EUR for 10,000 USD at 1.12).
  7. Review the transaction details:
    • A withdrawal in the original currency will be logged (e.g., 10,000 USD).
    • A corresponding deposit in the new currency will be created (e.g., 8,928 EUR).
  8. Click Save to confirm and record the currency conversion.

Managing Multi-Currency Cash Accounts

Multi-currency cash accounts allow you to hold balances in different currencies. The Currency Conversion feature facilitates seamless transfers between these currencies, helping you manage international investments, take advantage of exchange rate fluctuations, and ensure that each currency account remains balanced.

These multi-currency accounts are created automatically based on the currencies specified in your transactions. If you set a transaction's currency, a cash account in that currency will be created. Additionally, if the transaction currency is the same as the stock’s denominated currency, the cash account will be adjusted accordingly. This allows for easy handling of various currencies within your portfolio.

For example, if you maintain balances in both USD and EUR in your portfolio’s cash accounts, you can convert funds between these currencies based on the prevailing exchange rate. This is particularly useful when you have transactions or investments in different currencies and need to adjust your holdings accordingly.

By using the Currency Conversion feature, you ensure that your portfolio reflects accurate cash balances across multiple currencies and prevents imbalances from developing in your accounts. You can easily transfer funds between these currency accounts to keep everything aligned.

Viewing and Managing Transactions

All your cash transactions can be viewed in the Bond & Cash screen. You can sort and filter transactions by date, amount, and type. For deposits and withdrawals, you also have the option to remove transactions if needed.

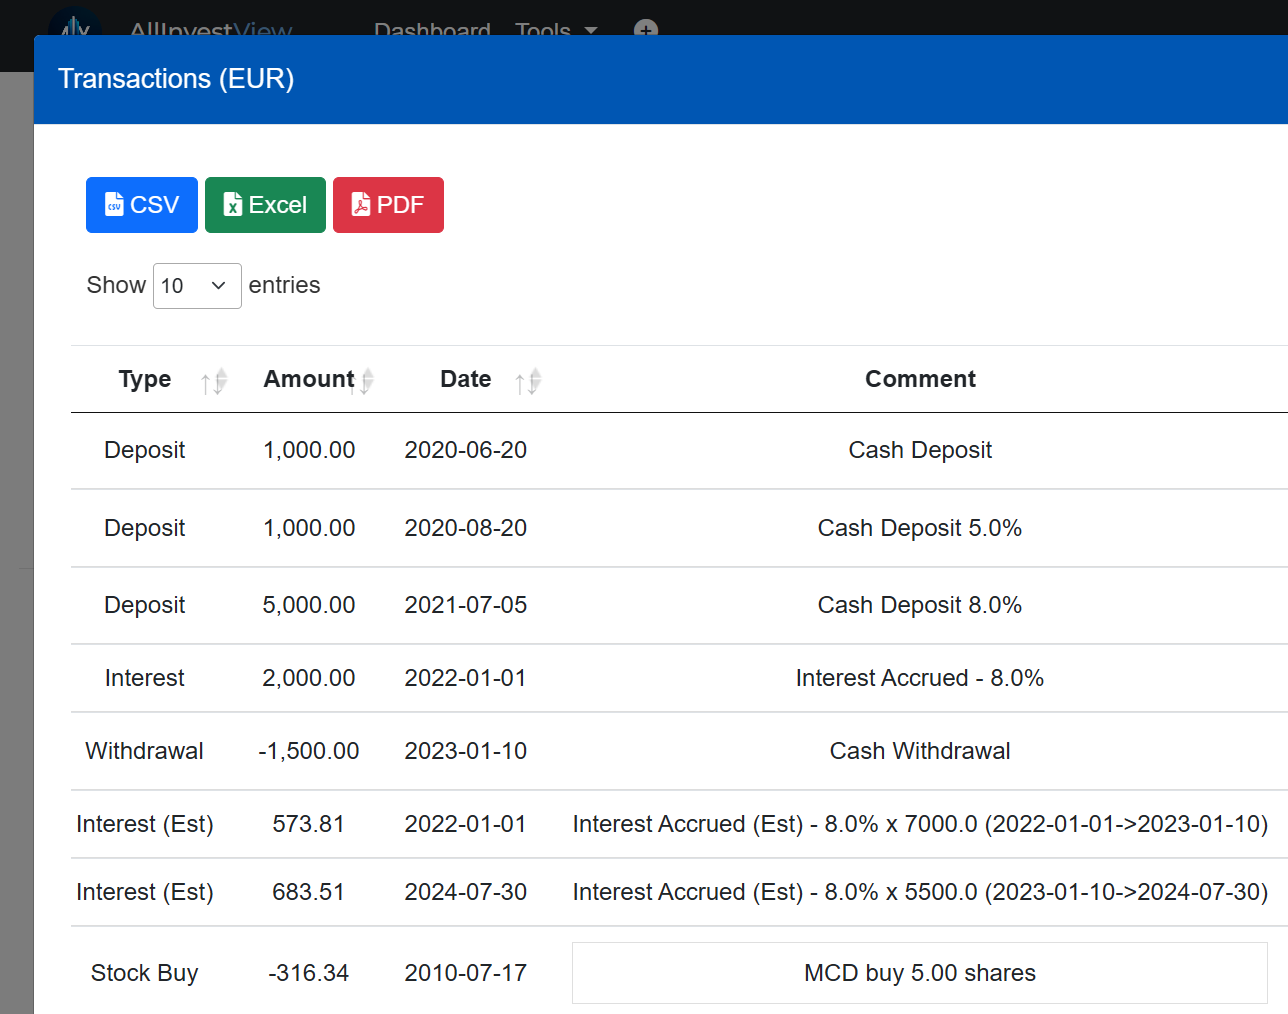
Each transaction is displayed with the following details:

  • Type (Deposit, Withdrawal, Interest, Stock Buy/Sell, or Dividend)
  • Amount
  • Date
  • Comment (e.g., reason for the transaction)
  • Currency Exchange (if applicable)

The Cash Account can also handle transactions in multiple currencies automatically. This is based on the transaction currency — whether the stock was bought in the original currency (so it would be added to the cash account in that currency or in another currency, where an FX rate would apply. This ensures that your cash account reflects accurate balances across different currencies, helping you manage your portfolio more efficiently.

Accrued Interest Functionality

The Cash Account feature also includes functionality to automatically estimate accrued interest on your cash balance. Here's how it works:

  • Manual Interest Transactions: When you add an interest accrued transaction, you specify the interest rate and the date. This transaction records the interest accrued up to that date, and the system uses this rate to estimate future interest accruals until a new interest rate is specified.
  • Estimated Interest Accruals: The system estimates and adds interest accrued transactions based on the last specified interest rate. These estimates are calculated daily and added whenever you view your transactions. The interest accrual stops when a new deposit or withdrawal is added, and a new interest rate is applied from that date onwards.
  • Interest Calculation Periods: Interest is calculated for the periods between your transactions. For example, if you deposit €1,000 on January 1st at a 5% interest rate, and then deposit another €1,000 on March 2nd at a 4% interest rate, the system will estimate interest accrued from January 1st to March 2nd using the 5% rate, and from March 2nd onwards using the 4% rate.
  • Accuracy and Transparency: Each estimated interest accrued transaction is clearly marked as "Estimated Interest Accrued" in the comments. This ensures transparency and allows you to distinguish between manually added and system-generated interest transactions.

Example

Here's an example of how to use the Cash Account feature:

Suppose you deposit €1,000 into your brokerage account on January 1, 2024, at an interest rate of 5%. You would add a transaction with the type "Deposit," amount "1,000," currency "EUR," date "2024-01-01," and interest rate "5%."

If you later withdraw €500 on February 1, 2024, you would add a transaction with the type "Withdrawal," amount "500," currency "EUR," and date "2024-02-01." The system will estimate and add interest accrued for the period between January 1 and February 1 at the 5% rate.

On March 2, 2024, you deposit another €1,000 but specify a new interest rate of 4%. You would add a transaction with the type "Deposit," amount "1,000," currency "EUR," date "2024-03-02," and interest rate "4%." The system will estimate and add interest accrued from February 1 to March 2 at the 5% rate and continue accruing at 4% from March 2 onwards.

If you buy 10 shares of AAPL at $150 each on April 1, 2024, a transaction with the type "Stock Buy," amount "1,500," currency "USD," and date "2024-04-01" will be automatically created. This amount will be subtracted from your cash account.

If you sell those 10 shares of AAPL at $160 each on June 1, 2024, a transaction with the type "Stock Sell," amount "1,600," currency "USD," and date "2024-06-01" will be automatically created. This amount will be added to your cash account.

If you receive a dividend of $50 from your AAPL shares on July 1, 2024, a transaction with the type "Dividend," amount "50," currency "USD," and date "2024-07-01" will be automatically created. This amount will be added to your cash account.

Cash Account Example

Combined Portfolio Management

The Combined Portfolio feature in AllInvestView allows you to aggregate multiple portfolios into a single combined portfolio. This functionality helps you manage and view the collective performance and value of several portfolios together, giving you a comprehensive overview of your investments.

Creating a Combined Portfolio

To create a Combined Portfolio, follow these steps:

  1. Navigate to the Portfolio tab from your dashboard, or in the portfolio section of your Account Settings.
  2. Click on the "Add Combined Portfolio" button.
  3. In the modal that appears, provide a name for your Combined Portfolio.
  4. Select the portfolios you want to combine from the list.
  5. Click "Save" to create the Combined Portfolio.

Viewing and Managing Combined Portfolios

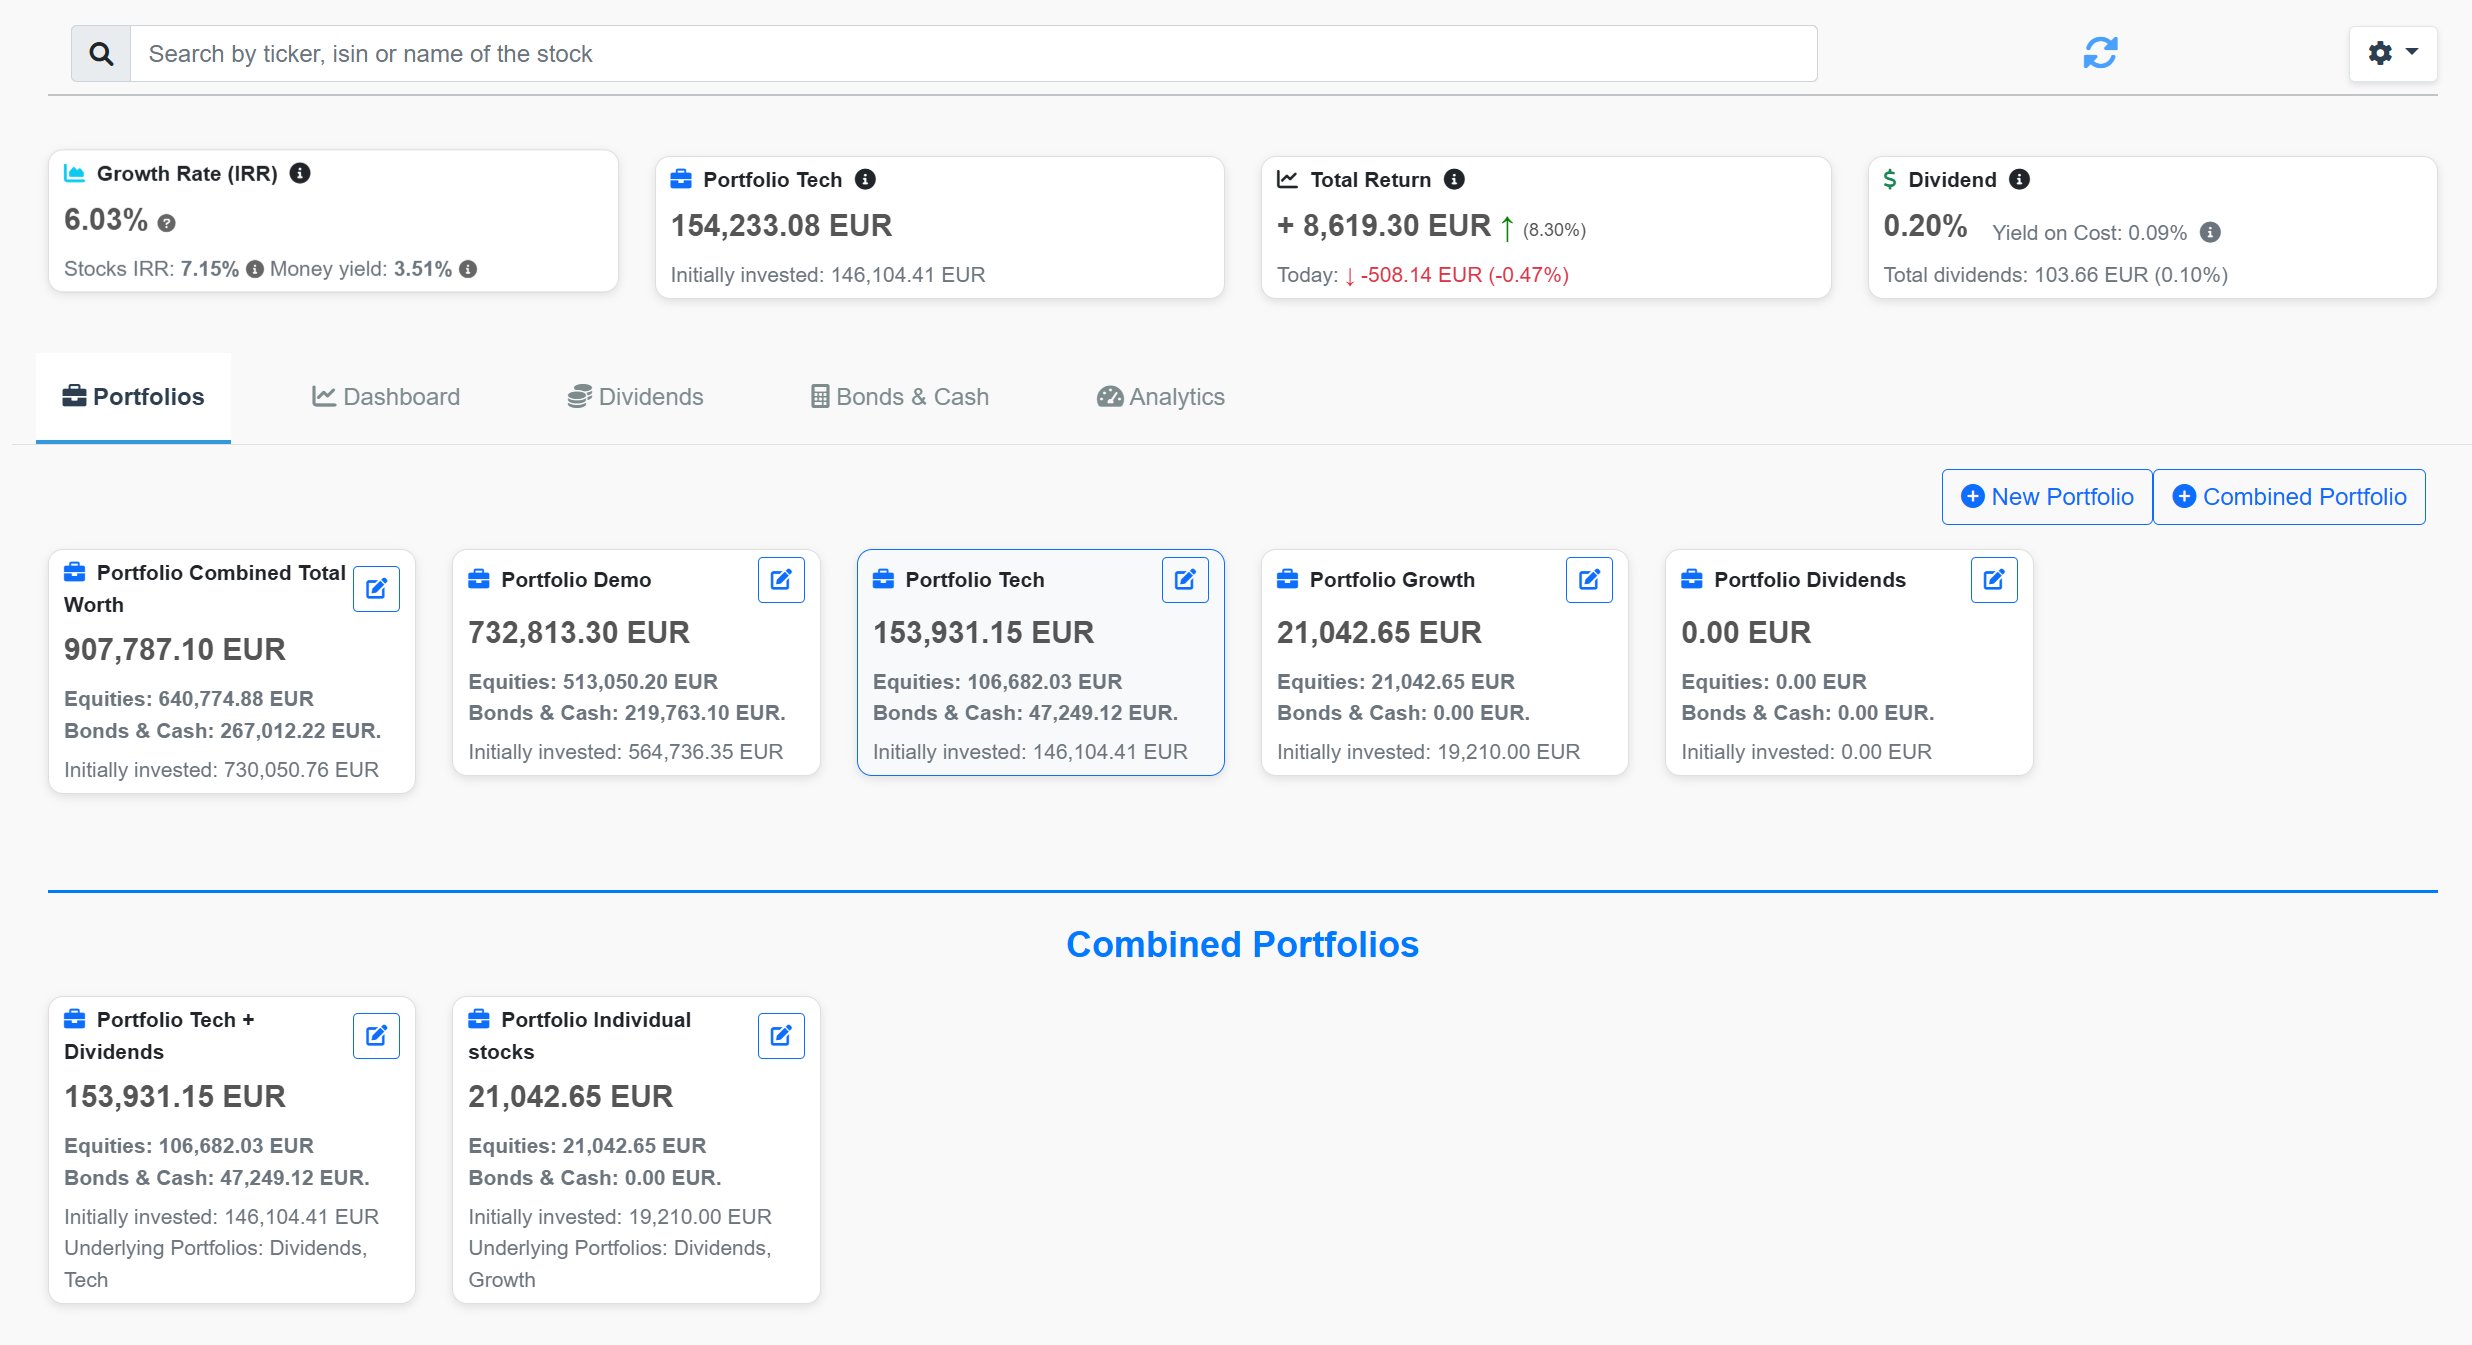
All your Combined Portfolios can be viewed in the Combined Portfolio section of your dashboard. Each Combined Portfolio displays the aggregated values and performance metrics of the underlying portfolios.

Each Combined Portfolio is displayed with the following details:

  • Total Value (EUR)
  • Initial Value (EUR)
  • Equity/Bond Allocation
  • Cash and Bond Value
  • Underlying Portfolios

Editing a Combined Portfolio

To edit a Combined Portfolio, follow these steps:

  1. Click on the "Edit" button on the Combined Portfolio card.
  2. In the modal that appears, update the name and the underlying portfolios as needed.
  3. Click "Save Changes" to update the Combined Portfolio.

Deleting a Combined Portfolio

To delete a Combined Portfolio, follow these steps:

  1. Click on the "Edit" button on the Combined Portfolio card.
  2. In the modal that appears, click the "Delete" button.
  3. Confirm the deletion in the confirmation dialog that appears.

Example

Here's an example of how to use the Combined Portfolio feature:

Suppose you have three portfolios: "Tech Stocks," "Bonds," and "Real Estate." You can create a Combined Portfolio called "Diversified Investments" that includes these three portfolios. This allows you to view the collective performance and values of these portfolios in one place.

If you later want to add a new portfolio called "Commodities" to your Combined Portfolio, you can edit the Combined Portfolio and select the new portfolio to include it.

This feature ensures you have a holistic view of your investments and can easily manage and analyze your diversified portfolios.

Combined Portfolio Example

Displaying Dashboard as of a Past Date

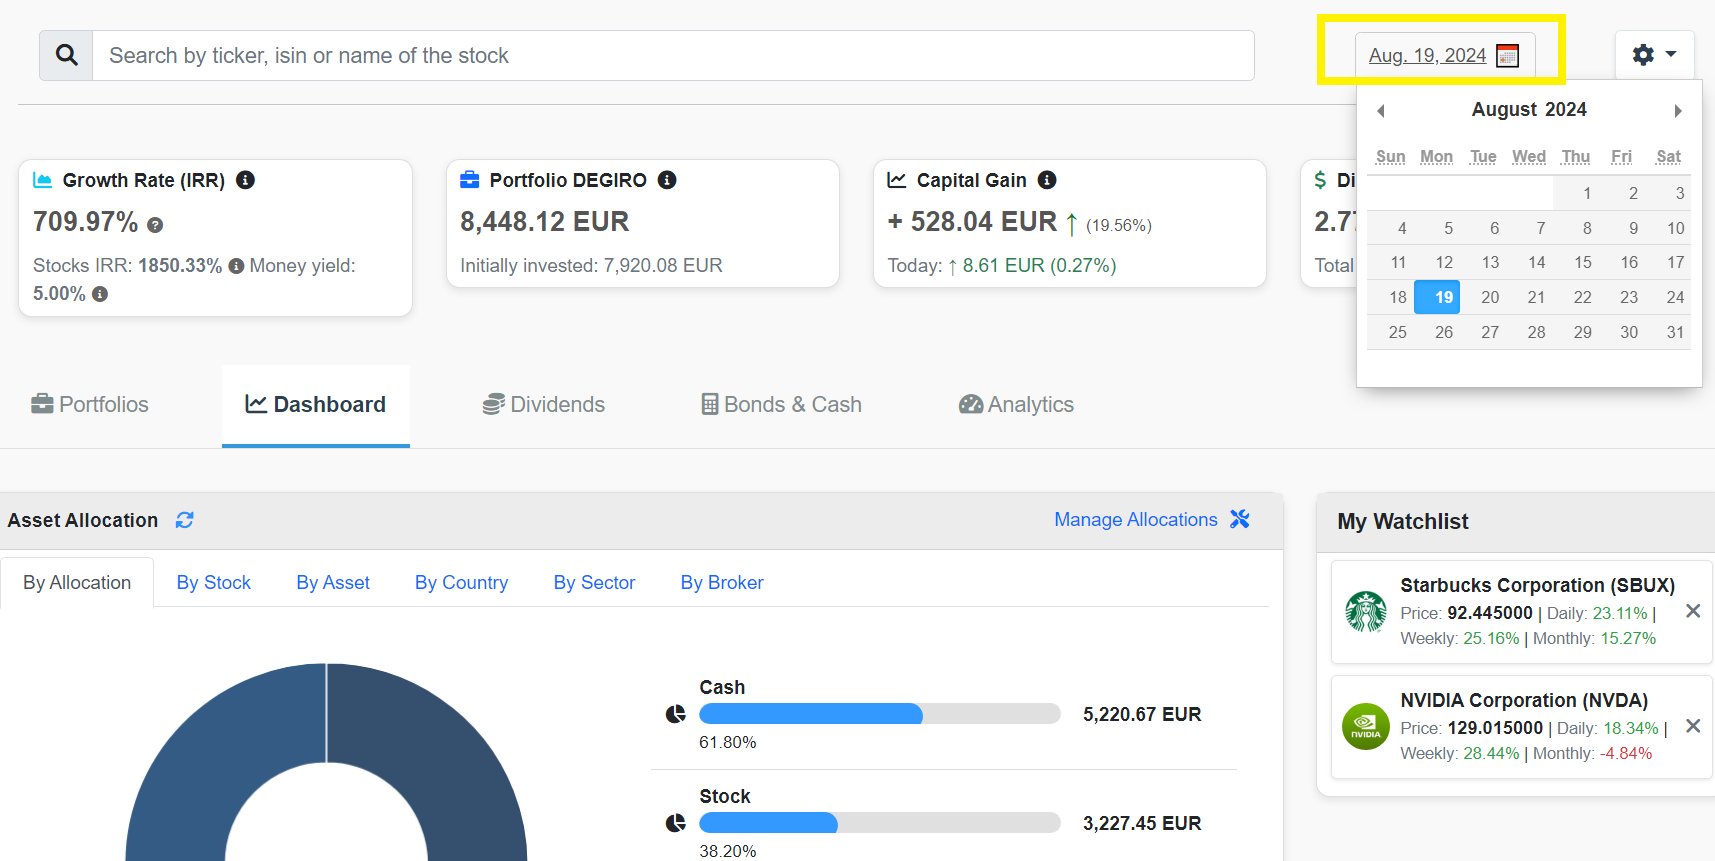
The "Dashboard as of a Past Date" feature allows you to view your portfolio's performance and holdings as they were on a specific date in the past. This tool is invaluable for analyzing historical data, understanding the impact of market events, and backtesting investment strategies.

How to Use the Past Date Dashboard

To display your dashboard as of a specific past date, follow these steps:

  1. Navigate to the Dashboard section from your account.
  2. Locate the date selector at the top of the dashboard page.
  3. Click on the date selector to open the calendar.
  4. Select the desired date from the calendar. Ensure that the date is in the past.
  5. The dashboard will automatically update to reflect your portfolio's status as of the selected date.

Understanding the Data

When you view your dashboard as of a past date, you will see the following information based on the selected date:

  • Portfolio Value: The total value of your portfolio on the selected date.
  • Asset Allocation: The distribution of your assets (e.g., stocks, bonds, cash) as of that date.
  • Individual Holdings: The specific stocks, bonds, and other investments in your portfolio, along with their values on the selected date.
  • Performance Metrics: Historical performance indicators such as daily returns and changes in portfolio value.

Why Use the Past Date Dashboard?

This feature is particularly useful for:

  • Reviewing how your portfolio was affected by specific market events.
  • Comparing your portfolio's performance at different points in time.
  • Backtesting investment strategies by simulating your portfolio's performance during historical periods.
  • Gaining insights into your portfolio's historical risk and return profiles.

Example

Suppose you want to see how your portfolio performed during a market downturn. You can use the past date feature to select a date during that period and analyze how your investments were impacted. This can help you understand your portfolio's resilience to market volatility and make more informed decisions in the future.

For instance, if you choose to view your portfolio as of March 23, 2020, you'll see how your holdings and overall portfolio value were affected during the COVID-19 market crash.

Dashboard Past Date Example

Price Alerts

The Price Alerts feature allows you to monitor specific assets and receive notifications when their prices reach your specified targets. This tool is perfect for staying on top of market movements without having to constantly check prices manually.

Setting Up a Price Alert

You can set up price alerts directly from the stock’s individual details page within your dashboard. Here’s how:

  1. Navigate to the stock you want to monitor by searching for it or by clicking on it from your portfolio dashboard.
  2. Once on the stock’s detail page, look for the "Set Price Alert" option.
  3. Enter the target price at which you want to be notified.
  4. Choose whether you want to be alerted when the price is above or below this target.
  5. Save your alert. You’re all set!

Managing Price Alerts

You can view and manage all your price alerts from the Account Settings page. This allows you to edit, disable, or delete any of your alerts as needed.

Notifications

When the price of the stock reaches your target, you’ll receive an email notification. This ensures you’re always in the loop, whether the price goes above or below your specified threshold.

Example

Let’s say you own shares of XYZ Corp and want to sell if the price rises above $150, or buy more if it drops below $100. You can set up two price alerts for XYZ Corp: one at $150 and another at $100. When the stock price crosses these thresholds, you’ll get an email alert, allowing you to take action quickly.

Stock Screener

The Stock Screener feature allows you to filter and search for stocks based on a variety of metrics and criteria.

Accessing the Stock Screener

You can access the Stock Screener directly from the Stock Screener tab within your dashboard. It’s easy to navigate and helps you stay on top of market movements.

Exchanges Covered

Please note that the data in the stock screener is sourced from TradingView, and due to data constraints, the scope is more limited. The data is focused on U.S. exchanges like NYSE, NASDAQ, NYSE ARCA, and OTC markets.

The stock screener currently covers the following exchanges:

  • NYSE
  • NYSE ARCA
  • NASDAQ
  • OTC Markets

These exchanges provide a wide range of stocks to explore, from large-cap companies to smaller firms trading over-the-counter. You can also filter stocks from other countries that are listed on the NYSE, NASDAQ, and other supported exchanges, giving you a broader view of international markets.

How to Use the Stock Screener

Here’s how you can use the stock screener to find stocks based on your preferences:

  1. Navigate to the Stock Screener page from the dashboard or the navigation menu.
  2. Choose your filters, such as market capitalization, price, sector, or dividend yield.
  3. Click "Apply Filters" to narrow down the list of stocks that match your criteria.
  4. Review the filtered results and click on any stock to view more details, including price history, financials, and recent news.

Example

Suppose you’re looking for a tech stock with a market capitalization of over $10 billion and a dividend yield of at least 2%. You can apply these filters in the Stock Screener, and it will display a list of stocks that match these criteria on the NYSE, NASDAQ, or other supported exchanges.