How can we help?
Find answers, step-by-step guides, and tips for getting the most out of AllInvestView. Contact support
Short walkthroughs of every part of AllInvestView. Click any one to watch it right here, or open the full playlist on YouTube.
AllInvestView lets you track stocks, ETFs, bonds, crypto, options, mutual funds, real estate, and custom assets — all in one place.
Here's how to get started:
- Create an account — Sign up for free at allinvestview.com
- Add your investments — Manually, via CSV import, or by connecting your broker
- Set your currency — Visit your account settings to set your default display currency
- Explore your dashboard — View analytics, performance charts, allocations, and more
Got ideas or feedback? Visit our community forum to share your thoughts and vote on feature requests.
AllInvestView is a web app that can also be installed as a standalone app on any device.
Desktop (Chrome, Edge, Brave):
- Visit allinvestview.com
- Click the install button on the right side of the address bar
- AllInvestView will appear in your dock or application folder
iOS (Safari):
- Open Safari and navigate to allinvestview.com
- Tap the share icon, then select 'Add to Home Screen'
- Confirm the name and tap 'Add'
Android (Chrome):
- Visit allinvestview.com on Chrome
- Look for the installation prompt or select 'Install App' from the browser menu
- Confirm to add it to your home screen
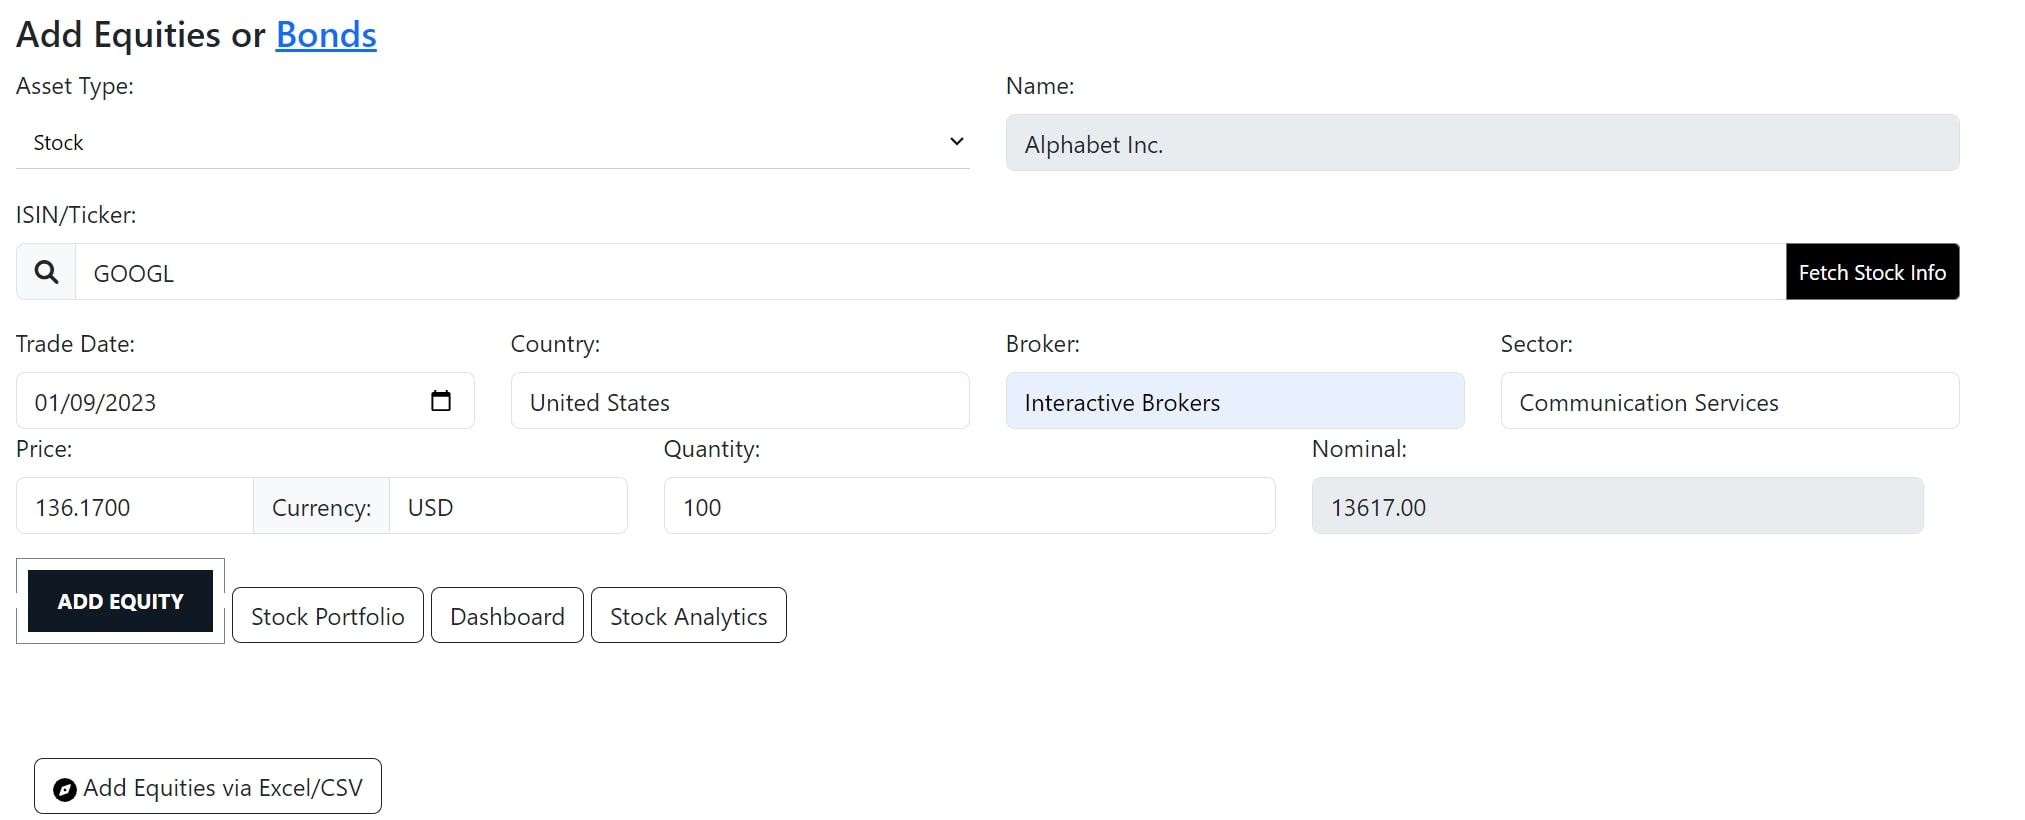
Add and follow any stock, ETF, or mutual fund from exchanges worldwide.
- Go to the equity booking page
- Enter the ticker symbol (e.g., AAPL, VWRL.L, SAN.MC)
- Click 'Fetch Stock Info' to load market data
- Enter trade details (date, quantity, price) and save
Prices update throughout the day (up to 15-minute delay). End-of-day data is available for all supported exchanges.
Click any stock name in the dashboard to see its details, financials, and to set up price alerts.
Keep tabs on your bonds with yield to maturity, duration, coupon rates, implied credit spreads, and upcoming payment dates.
- Navigate to the bond calculator page
- Enter an ISIN or CUSIP — we'll auto-convert CUSIPs to ISINs and look up bond details from our database and OpenFIGI
- Fill in any missing details (price, interest rate, maturity, issuer) and book to your portfolio
- View your bond portfolio under the "Bond & Cash" tab in your dashboard
For a full bond analytics view, visit Bond Holdings — it shows aggregated positions by ISIN with yield curve repricing, implied spreads, maturity ladder, and coupon projections.
For cash positions, use the cash booking page to add holdings and monitor yields, transactions, and liquidity.
Add any cryptocurrency to your portfolio — Bitcoin, Ethereum, Solana, and thousands more.
- Go to the equity booking page
- Enter the crypto symbol followed by the fiat currency: BTC-USD for Bitcoin in USD, ETH-EUR for Ethereum in EUR
- Click 'Fetch Stock Info' to confirm the asset
- Enter your trade details (date, quantity, price) and save
Common formats:
- BTC-USD, ETH-USD, SOL-USD (with dash)
- BTCUSD, ETHUSD (without dash — both work)
- BTC-EUR, ETH-GBP (any fiat currency pair)
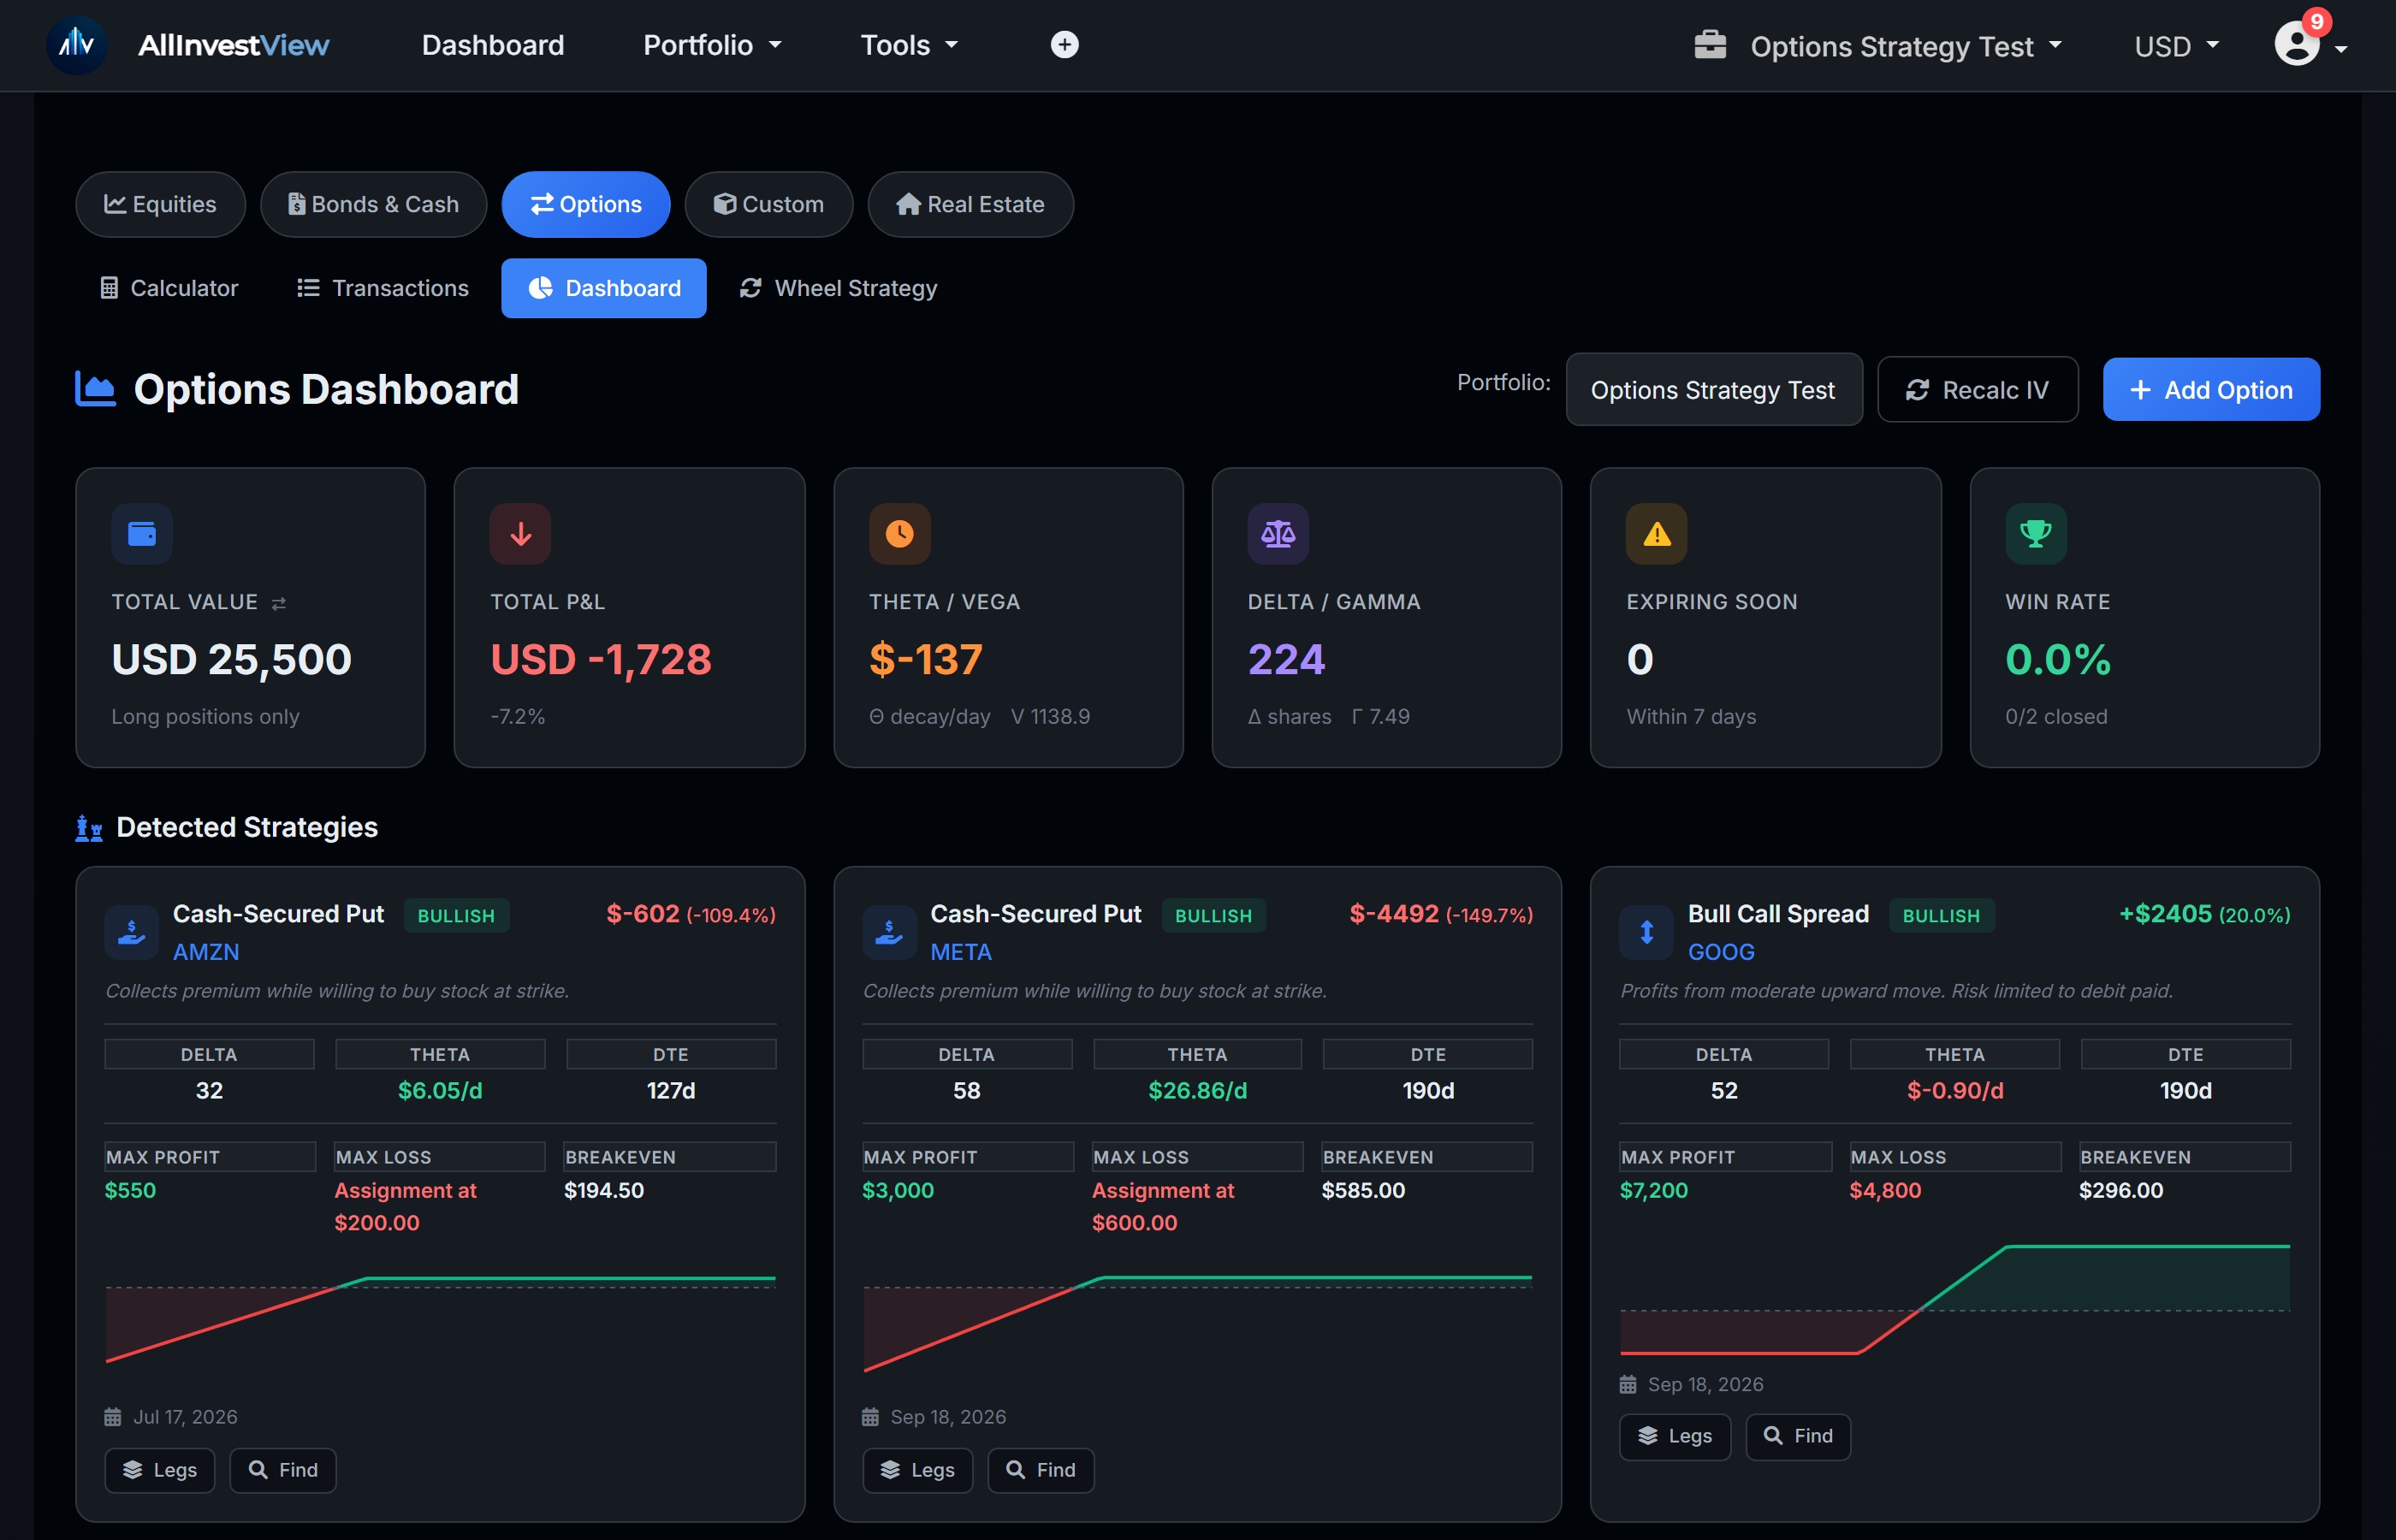
Price, book, and manage options with Black-Scholes pricing, live Greeks, and full lifecycle tracking.
Adding an option:
- Go to the Option Calculator
- Enter underlying price, strike, expiration, volatility, and interest rate
- See the premium and Greeks (Delta, Gamma, Theta, Vega)
- Click 'Book' to add it to your portfolio
Managing open positions:
- Roll: Close the current option and open a new one at a different strike or expiration. The system links them so you can see the full roll chain and total P&L across all rolls.
- Close: Close the position at a specific price before expiration.
- Mark as Expired: For options that expired worthless (close price = $0).
- Exercise & Book Stock: Marks the option as exercised and auto-creates a stock trade at the strike price (adjusted for premium). Great for CSP assignments.
- Exercise Only: Marks exercised without booking the stock — if you want to enter it separately.
Options Dashboard:
The Options Dashboard gives you a full picture: total portfolio value, aggregate Greeks, P&L by position, and auto-detected strategies (spreads, iron condors, straddles, covered calls, wheel cycles, and more).
Wheel Strategy:
The Wheel Strategy Tracker follows the full wheel cycle: sell a cash-secured put → if assigned, receive shares → sell a covered call → if called away, sell shares → repeat. It tracks premium collected, cost basis adjustments, and cycle status.
Other tools:
- Income Tracker — monthly premium income from selling strategies
- Trading Journal — trade log with win/loss stats and notes
- Payoff Calculator — visual profit/loss diagrams before entering a trade
- Covered Call Calculator and Cash-Secured Put Calculator
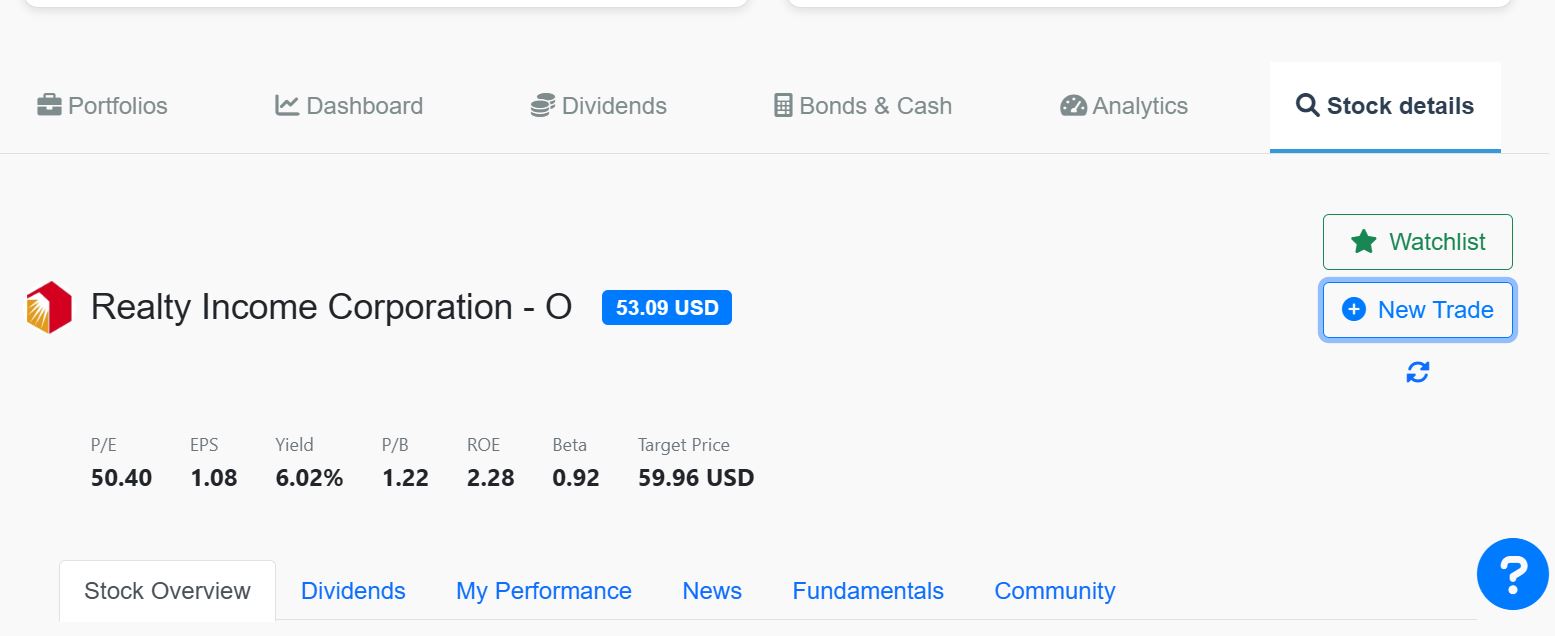
Click any stock name in your dashboard to open its detail page. You'll see:
- Price chart with your average cost line
- Key metrics: P/E ratio, market cap, 52-week range, analyst target price
- Dividends tab — history, yield, ex-dividend dates, next payment
- My Activity — your personal buy/sell history for this stock
- My Performance — your personal P&L chart since purchase
- News — latest financial news articles
- Fundamentals — EPS, revenue growth, margins, financial ratios
- DCF valuation — intrinsic value estimate based on discounted cash flows (when available)
You can also set price alerts and add new trades directly from this page. See the DCF valuation section for intrinsic value estimates.
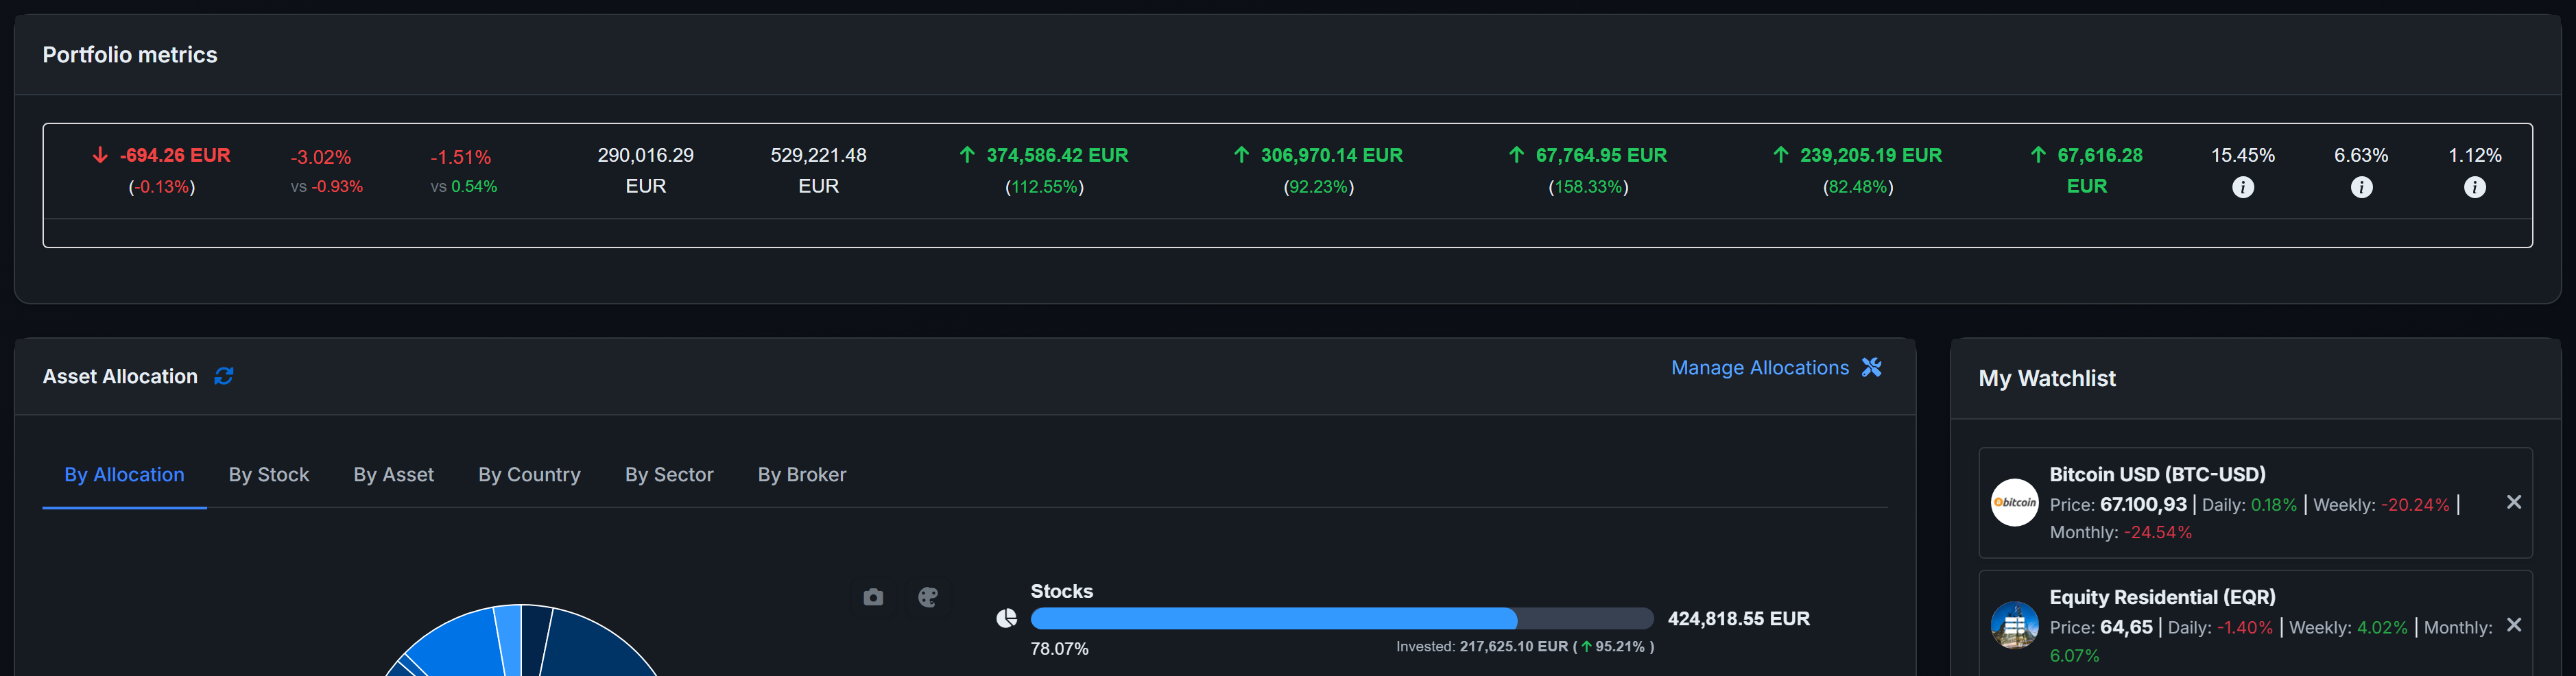
Keep an eye on stocks you're interested in without adding them to your portfolio.
- Go to any stock's detail page
- Click 'Add to Watchlist'
- View your watchlist from your dashboard — shows current price and daily/weekly/monthly changes
Each portfolio has its own watchlist. Remove items anytime by clicking the remove button.
Track anything that isn't on a public exchange — collectibles, private equity, wine, art, or any other investment.
- Go to the equity booking page
- Select 'Custom' as the asset type
- Enter the asset name, purchase price, quantity, and category
- Update the price manually whenever the value changes
Custom assets appear in your dashboard alongside all other holdings. Their value is based on the most recent price you entered.
Add your properties and track valuations, rental income, and expenses alongside the rest of your portfolio.
- Navigate to the real estate section
- Enter property details: name, purchase price, current value, and currency
- Add rental income and track expenses (property tax, insurance, maintenance, utilities, management fees)
- View your properties in the dashboard alongside other assets
Additional features:
- Update property valuations over time
- Record property sales with automatic capital gains calculation
- Mortgage amortization calculator — see interest vs principal breakdown
- Track rental income and confirm payments
- Log all expenses for cash flow analysis
- Set ownership percentages for co-owned properties
AllInvestView handles multi-currency portfolios automatically — everything gets converted to your chosen display currency.
Key concepts:
- Transaction Currency: The currency you record the trade in (e.g., USD, EUR, GBP)
- Stock Quoted Currency: The currency the stock trades in on its exchange — this can differ from your transaction currency
- Display Currency: The currency you see everything in on your dashboard. All values get converted to this automatically.
- FX Rate: Applied automatically when currencies differ. You can also override the FX rate on individual trades for precision.
Set your default display currency in account settings. AllInvestView supports 50+ currencies.
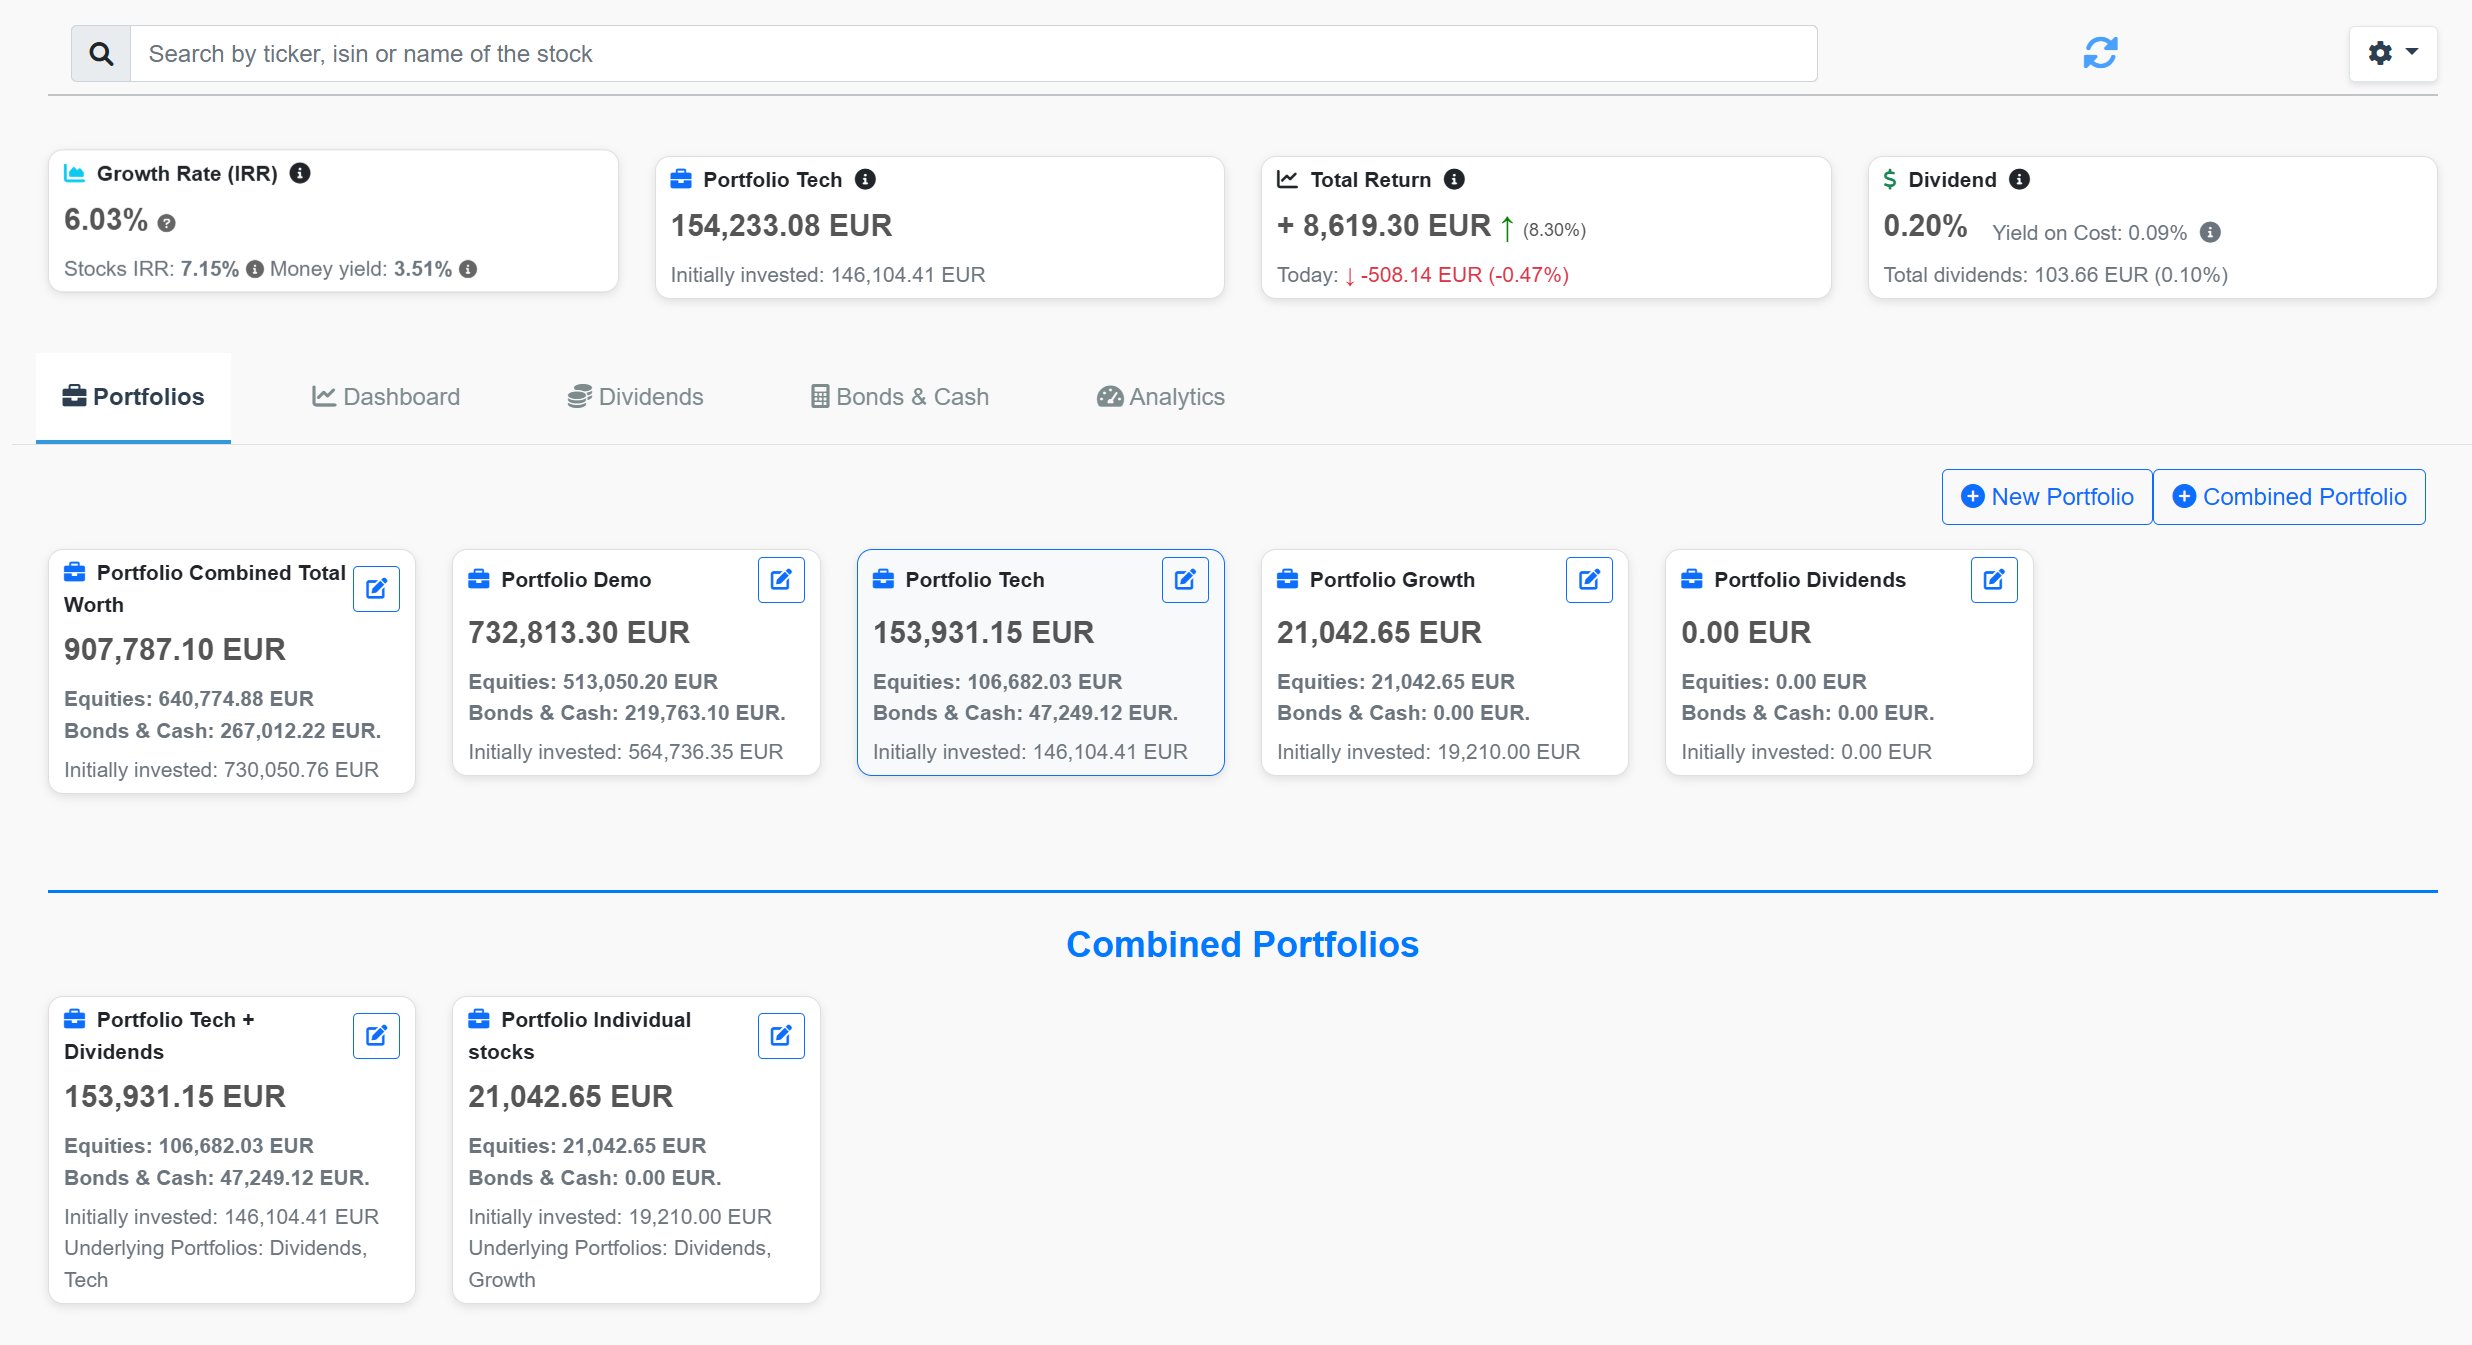
Each portfolio can be set as Public or Private:
- Public Portfolio: Anyone with the shared link can view it. Share via the link or share button in your dashboard.
- Private Portfolio: Only accessible by the account owner. Cannot be viewed even with the link.
You can also create Combined Portfolios to group and visualize multiple portfolios together. Combined portfolios are always private.
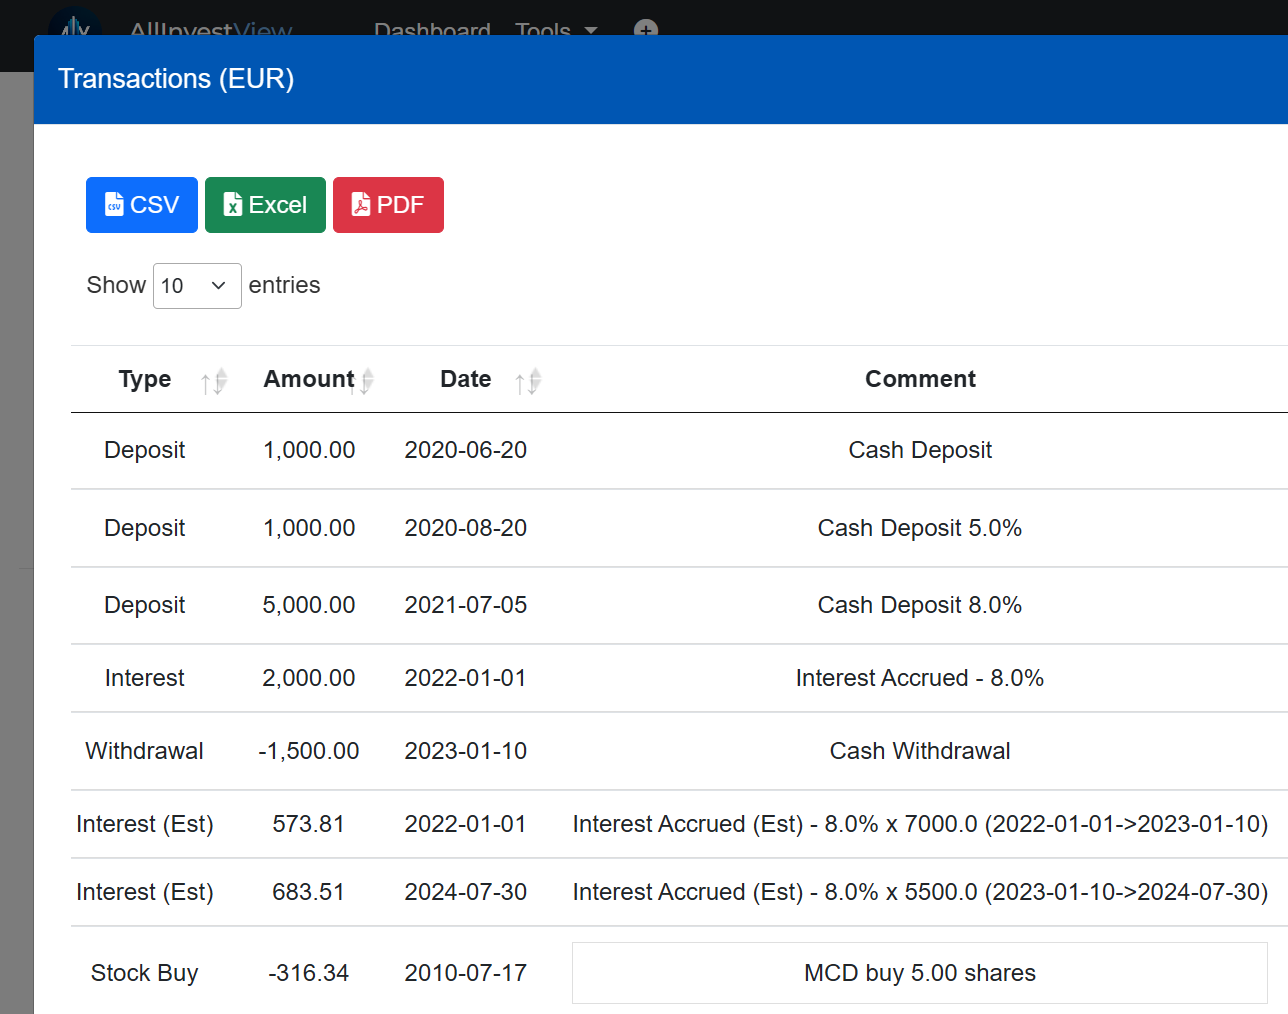
All your trades are listed on the Transactions page (Portfolio → Transactions in the menu).
- Click on any transaction to open it and edit the details — date, price, quantity, fees
- Filter by portfolio, asset type, or date range
- Delete trades you no longer need
Trades are shown in a ticket format — click to expand, edit, and save.
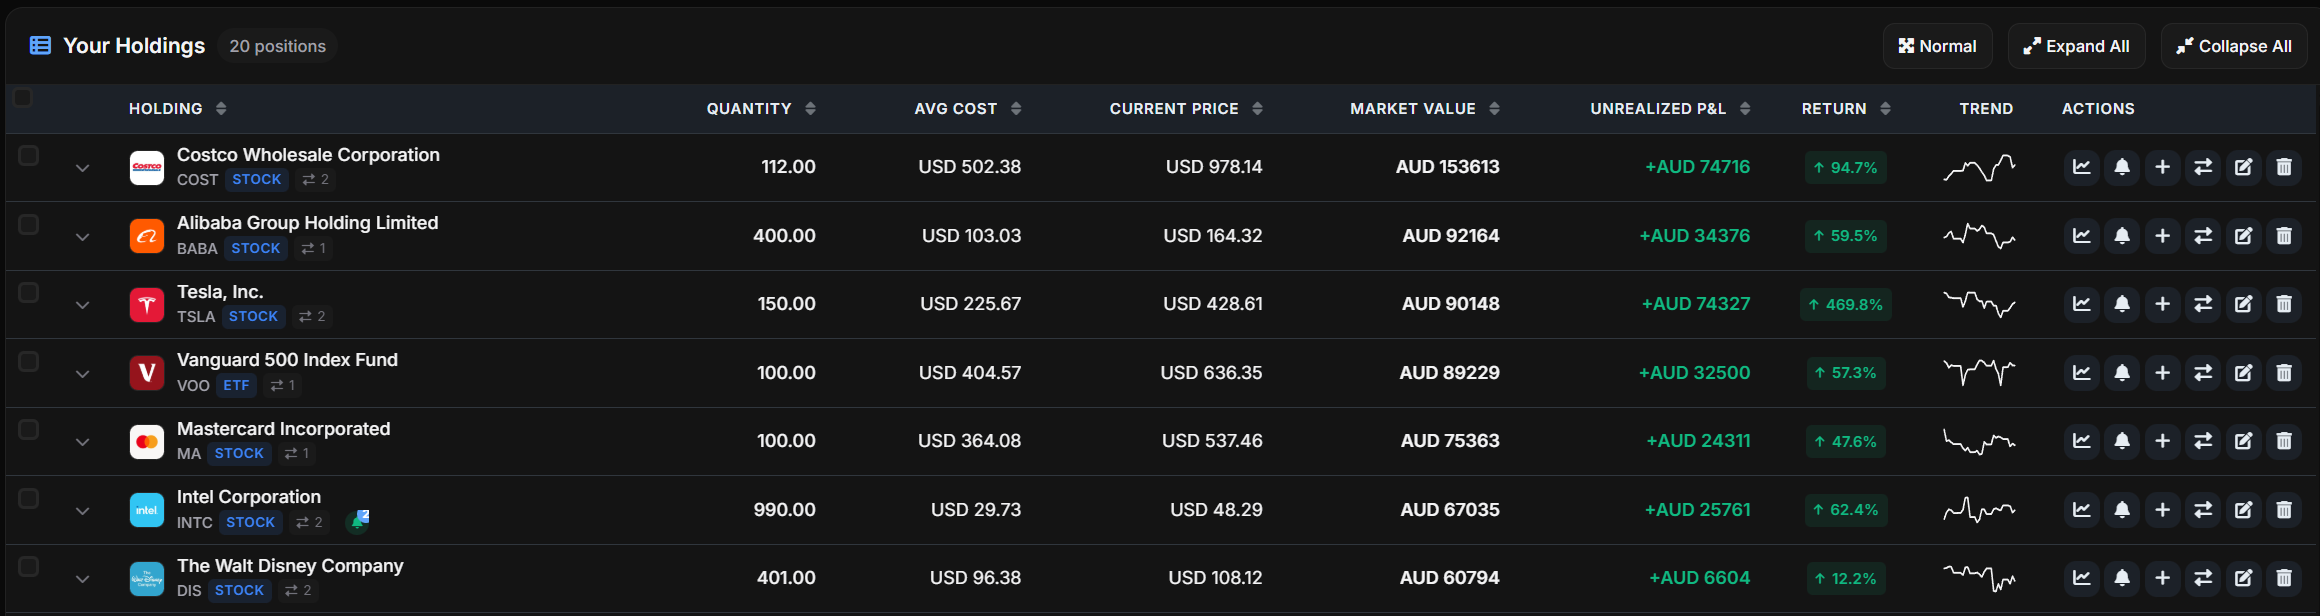
The Holdings page (Portfolio → Holdings) gives you a bird's-eye view of everything across your portfolios.
- See all positions at a glance with ticker logos, cost basis, P&L, and mini sparkline charts
- Transfer holdings between portfolios
- Bulk edit or delete multiple positions
- Click any holding to expand and see individual transactions
- Edit or delete specific transactions within a holding
- Update ISIN or ticker if a holding was mapped incorrectly
Close a position by adding a Sell transaction:
- Go to the booking page
- Select the stock and choose 'Sell' as the transaction type
- Enter the quantity to sell (check 'Available quantity' for your current shares)
- Review and confirm the transaction
New to AllInvestView? The onboarding checklist guides you through the first steps:
- Add your first stock or ETF
- Set your display currency
- Connect a broker or import trades
- Explore the analytics tab
The checklist appears in your dashboard sidebar. Completing all steps earns you bonus community votes for the feature request board.
Got a CSV from your broker? Just drag it in. We support files from 30+ brokers including Trading 212, DEGIRO, Interactive Brokers, Fidelity, Schwab, and more.
- Find Your Broker: AllInvestView provides built-in templates for common brokers. If yours isn't listed, you can create a custom template or contact support.
- Export Transactions: Export your transactions from your broker according to their instructions, then drag and drop the file into AllInvestView.
- Match Your Assets: Review and confirm the proposed asset matches or select alternatives.
- Review & Confirm: Review the imported data, make adjustments, and confirm.
Import transactions from any file format using our interactive import tool. You can also copy and paste data directly.
- Open Your File: Open your CSV or XLSX file directly in AllInvestView, or copy and paste from any table.
- Match Columns: Map your file columns to AllInvestView fields.
Required columns:
- Asset — Name or identifier of the investment
- Date — Transaction date
- Quantity — Amount of the asset
- Price — Price per unit or total value
- Currency — Transaction currency
- Portfolio — Portfolio to assign to
Optional columns: Broker, FX Rate, Fee, Type (Buy/Sell)
Bond-specific columns: Rate, Maturity Date, Issue Date, Quotation, Issuer, Frequency, Lot Size
You can always add trades one by one using the booking page:
- Search for the asset by ticker symbol or name
- Enter trade details: date, quantity, price, and portfolio
- Save the transaction
You can mix all three import methods — whatever works best for you.
Import your dividend history from a CSV or enter dividends manually. Use the Import Page for bulk uploads, or add individual dividends from the Dividends tab in your dashboard.
Each dividend entry needs: stock/ISIN, date, amount, and currency. You can also include withholding tax information.
If an import didn't look right, you can undo it. On the Import Page, find your recent imports and click "Undo" to roll back all trades from that batch.
This removes all trades added in that specific import without touching anything else in your portfolio.
Beyond stock and bond trades, the Import Page also lets you bulk import other types of data:
- Cash Deposits & Withdrawals — Import cash movements to your portfolio. Columns: date, amount, currency, type (deposit/withdrawal).
- Custom Dividends — Import dividend payments for unlisted or custom assets. Columns: stock/ISIN, date, amount, currency, withholding tax (optional).
- Custom Asset Prices — Bulk update prices for custom assets you track manually. Columns: asset name/ISIN, date, price, currency.
- Option Trades — Bulk import calls and puts via CSV. Columns: underlying, strike, expiration, option type (call/put), quantity, premium, date.
Find these options on the Import Page under the "Non-Trade Data" section. Upload a CSV or paste your data directly.
AllInvestView offers three ways to get your trades in. Here's when to use each:
- Broker Sync — Best if your broker is supported. Trades sync automatically every night. Start here.
- CSV Import — Best for historical trades your broker doesn't send via sync, or if your broker isn't supported for auto-sync. Also great for bulk imports.
- Manual Entry — Best for one-off trades, corrections, or assets not available through import.
You can mix all three — many users connect their broker for automatic updates and import older history via CSV.
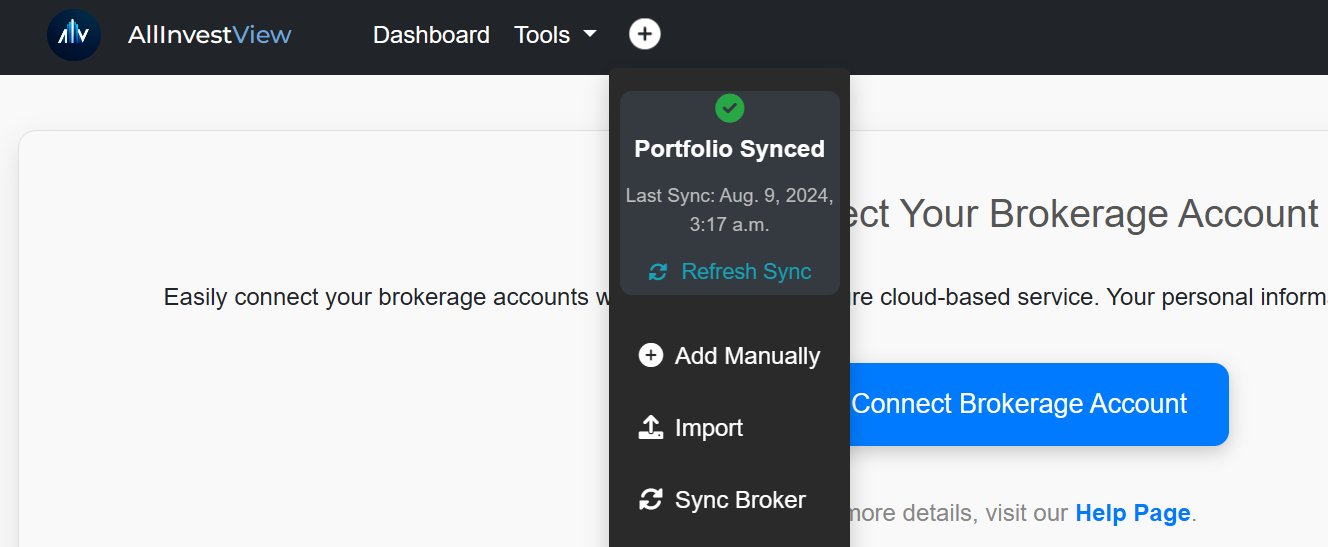
Connect your brokerage and your holdings sync automatically every night — no manual updates needed.
- Choose your brokerage and connect securely via SnapTrade (encrypted, read-only)
- Your portfolio syncs automatically every night
- Manually refresh anytime from the Broker Connection page or the 'Add' button
1 Portfolio = 1 Broker Link: Each portfolio maps to a specific broker account. If you have multiple accounts at the same broker, create a separate portfolio for each.
Manage and assign accounts to portfolios on the Sync Brokers page. Create a combined portfolio for a unified view.
Broker sync is available with Trial and premium plans.
- Go to the Sync Brokers page
- Click 'Connect' and select your broker
- Log in to your brokerage through the secure SnapTrade window
- Your holdings will be imported and mapped to your active portfolio
We connect with 25+ brokerages worldwide through SnapTrade, including:
For a full list, visit Broker Capabilities. For status and limitations per broker, see SnapTrade Brokerage Support.
To connect Interactive Brokers (IBKR), you need to enable SnapTrade as a Third-Party Service:
- Log in to your IBKR account
- From the Menu, go to Reporting → Third-Party Reports
- Click the gear icon and enable SnapTrade
- Save — SnapTrade will appear under your enabled Third-Party Services
See the full Interactive Brokers connection guide.
Transactions labeled "Needs Review" are auto-synced trades created to ensure your portfolio matches your broker's current holdings.
Why they appear:
- Your broker provides limited transaction history (e.g., last 90 days)
- Corporate actions (stock splits, mergers) changed the ticker or share count
- Very recent trades that haven't fully synced yet
- Positions transferred in from another broker
How to resolve:
- Review and edit: Click the transaction, verify the trade date. Once updated, the badge disappears.
- Import History: Upload a CSV of your full trade history via the Import Page. The auto-synced trade will be replaced on the next sync.
After connecting your broker, some historical data may be missing. Here's how to complete it:
- Connect your brokerage account
- Review the imported trade history — if all data is present, you're done
- If historical data is missing, visit the Import Page and upload a spreadsheet or import from your broker's report
Once real history is imported, auto-synced reconciliation trades will be replaced automatically on the next sync.
How secure is my data during synchronization?
We use SnapTrade, a trusted third-party service. All login credentials are encrypted, and no sensitive information is stored by AllInvestView.
How often is my portfolio synchronized?
Automatically every night. You can also manually trigger a sync from the Sync Brokers page or the 'Add' button.
What if I encounter issues with synchronization?
Contact support at [email protected] for assistance.
Trades not showing up after sync?
- Check that the correct broker account is assigned to the right portfolio on the Sync Brokers page
- If you have multiple accounts at the same broker (e.g., individual + joint), make sure you're syncing the right one
- Some brokers only provide the last 90 days of history — older trades won't appear. Import them via CSV.
Connection expired or disabled?
- Broker connections need re-authentication roughly every 90 days
- Go to the Sync Brokers page and click "Reconnect" to refresh the connection
- If the broker's systems are temporarily down, try again later
Wrong prices or quantities?
- Check for unmapped trades — some broker symbols need manual mapping
- Stock splits or ticker changes can cause temporary mismatches — they usually resolve on the next sync
As a workaround, you can always import trades via CSV while troubleshooting.
Still stuck? Email [email protected] with your username and broker name — we'll look into it.
After a broker sync, some trades might show as "unmapped" — this means AllInvestView couldn't automatically match a broker symbol to a known stock. Go to the Unmapped Trades page to resolve them.
How to resolve unmapped trades:
- Check for suggestions — If other users have already mapped this symbol, you'll see a community suggestion. Click "Apply" to use it.
- Search manually — If no suggestion exists, search for the correct ticker by name or symbol. Select the right match and click "Map."
- Track as custom — If the asset isn't in any exchange, track it as a custom asset instead.
- Dismiss — If you don't want to track this asset at all, dismiss it. You can restore dismissed trades later if you change your mind.
Why trades show as unmapped:
- Your broker uses a different symbol than the standard ticker (common with European and international brokers)
- The stock underwent a ticker change or merger
- The asset is a money market fund, currency instrument, or internal broker product
Some instruments from your broker don't belong in your portfolio — currency conversion vehicles (like DLR), money market sweeps, or internal broker products. You can exclude them so the sync skips them entirely.
How to exclude a ticker:
- Go to the Unmapped Trades page
- Find the instrument you want to exclude
- Click "Exclude" — the symbol will be skipped on all future syncs
When to exclude:
- Currency hedging instruments (DLR, HO, etc.) that aren't real holdings
- Internal broker sweep funds or cash equivalents you don't want tracked
- Instruments that cause phantom trades or duplicate positions
Excluded tickers stay excluded permanently. You can remove an exclusion anytime from the Unmapped Trades page to start syncing that ticker again.
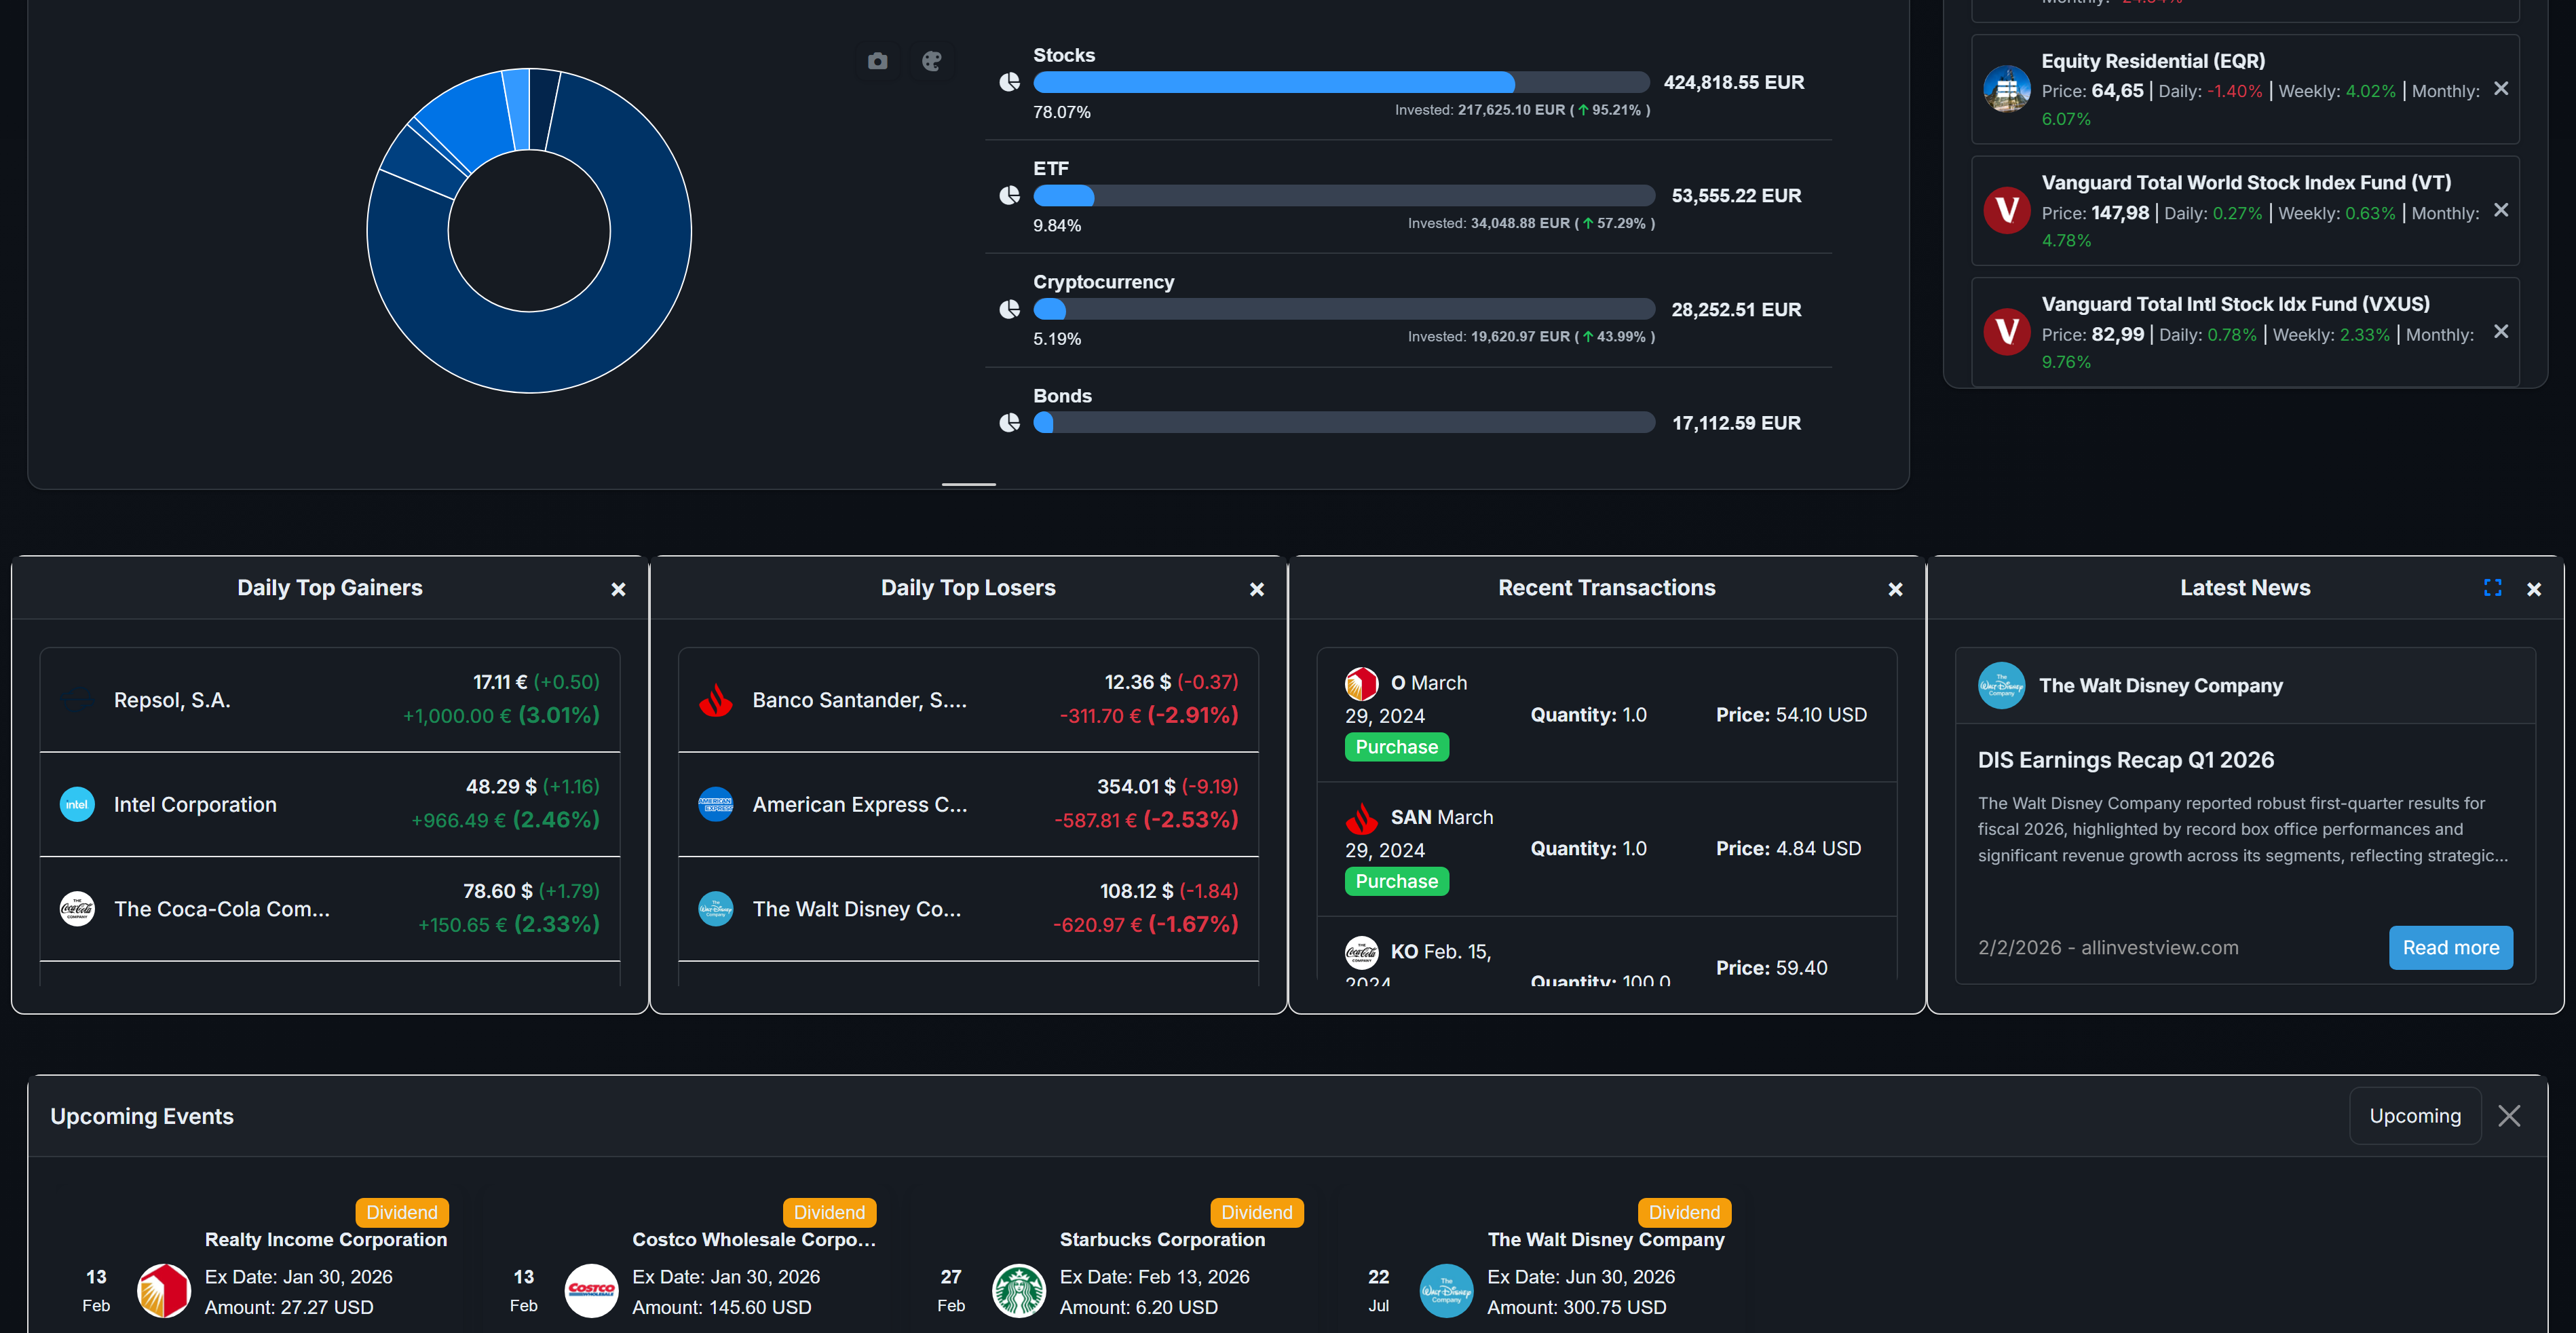
Group your holdings by asset class, sector, or any category you want — so you can see exactly how your money is spread.
- Go to the stock management page
- Create allocation categories (e.g., Equities, Bonds, Real Estate)
- Drag and drop assets into their allocations
- Set target percentages for each allocation
- Save your changes
Drifted from your targets? The rebalancing tool tells you exactly what to buy or sell to get back on track.
- Go to the Rebalancing page
- Review your current vs. target allocations (blue = current, light blue = target)
- Enter the amount to invest or withdraw
- Choose Deposit or Withdrawal
- Optional: Enable 'Allow Selling' to use overallocated funds
- Optional: Enable 'Minimize Transactions' for fewer trades
- Optional: Enable 'Recommend Based on Price' to prioritize cheaper stocks
- Click 'Rebalance' to see recommended transactions
Rebalance results show:
- Current and target amounts per category
- Buy/Sell actions with amounts (green = buy, red = sell)
- Expected allocation after rebalancing
- Stock-level details with price ratios and the 'Cheapest' flag
Have multiple portfolios (e.g., one per broker)? Combine them into a single view to see the big picture.
- Navigate to the Portfolio tab in your dashboard, or Account Settings
- Click 'Add Combined Portfolio'
- Name it and select the portfolios to combine
- Click 'Save'
Combined portfolios display aggregated values: total value, initial value, equity/bond allocation, and underlying portfolios.
To edit or delete: click 'Edit' on the combined portfolio card, update as needed, and save.
Keep track of the cash sitting in your brokerage. Stock buys, sells, dividends, and interest are all reflected automatically.
Activating: Toggle the cash account option in your account settings. Manage from the Bond & Cash tab.
Adding a transaction:
- Click 'Add Transaction' in the Bond & Cash screen
- Select type: Deposit, Withdrawal, Interest Accrued, or Currency Conversion
- Enter amount, currency, and date
- For deposits/interest: optionally specify an interest rate
- Click 'Save'
Transaction types:
- Deposit: Add funds
- Withdrawal: Remove funds
- Interest Accrued: Add interest earnings with rate
- Currency Conversion: Transfer between currencies (creates paired withdrawal + deposit)
Accrued interest: The system estimates daily interest based on the last specified rate. Estimates are clearly marked and recalculate when you add new transactions.
Currency conversion:
- Select Currency Conversion from the transaction type
- Enter the amount in the original currency and the target currency
- Provide the FX rate — the system calculates the equivalent amount
- Two transactions are created automatically: a withdrawal in the original currency and a deposit in the new currency
Example: Deposit €1,000 on Jan 1 at 5% interest. Withdraw €500 on Feb 1. The system estimates interest accrued between those dates at 5%. On March 2, deposit another €1,000 at 4% — interest re-estimates from Feb 1 to March 2 at the old rate, then continues at 4%.
The Net Worth Projection tool shows where your portfolio might be headed. Enter your planned monthly contributions, expected return rate, and time horizon.
The tool shows a projected growth chart with different scenarios (conservative, moderate, optimistic). Great for setting long-term goals or seeing how extra contributions could compound over time.
Want to create a new portfolio based on an existing one? Use the Copy Portfolio feature from Portfolio Management. It duplicates all your trades into a new portfolio — useful for creating a "what-if" scenario or splitting things up.
The copy is independent — changes to one don't affect the other.
Need to move positions from one portfolio to another? You don't need to delete and re-enter trades.
- Go to the Holdings page
- Select the holdings you want to transfer
- Click "Transfer" and choose the destination portfolio
- Confirm — all trades for those holdings move to the new portfolio
The cost basis and trade history transfer with the holding. This is useful when reorganizing portfolios or splitting a large portfolio into smaller ones.
The Portfolio Overview (a Pro-plan feature) gives you an overview of all your Combined Portfolios — ideal for managing multiple accounts, family portfolios, or client households.
Per-portfolio metrics:
- Total value across all accounts in the combined portfolio
- Maximum allocation drift from target (highlights rebalancing needs)
- Bonds maturing within 90 days (reinvestment planning)
- Last reviewed date and notes
Quick actions:
- Click any row to go to its dashboard
- Use the three-dot menu for quick links: Dashboard, Bond Report, Tax Report, Dividends, Rebalancing
- Mark portfolios as reviewed to track your review cadence
- Add private notes per portfolio (saved per click, supports Ctrl+Enter)
Shows the best possible risk/return combinations for your portfolio, based on Modern Portfolio Theory.
Find it in the 'Analytics' tab on your dashboard. You can:
- Plot your current portfolio on the frontier to assess its efficiency
- Access the Data Points tab for detailed metrics (mean returns, volatility, Sharpe ratios)
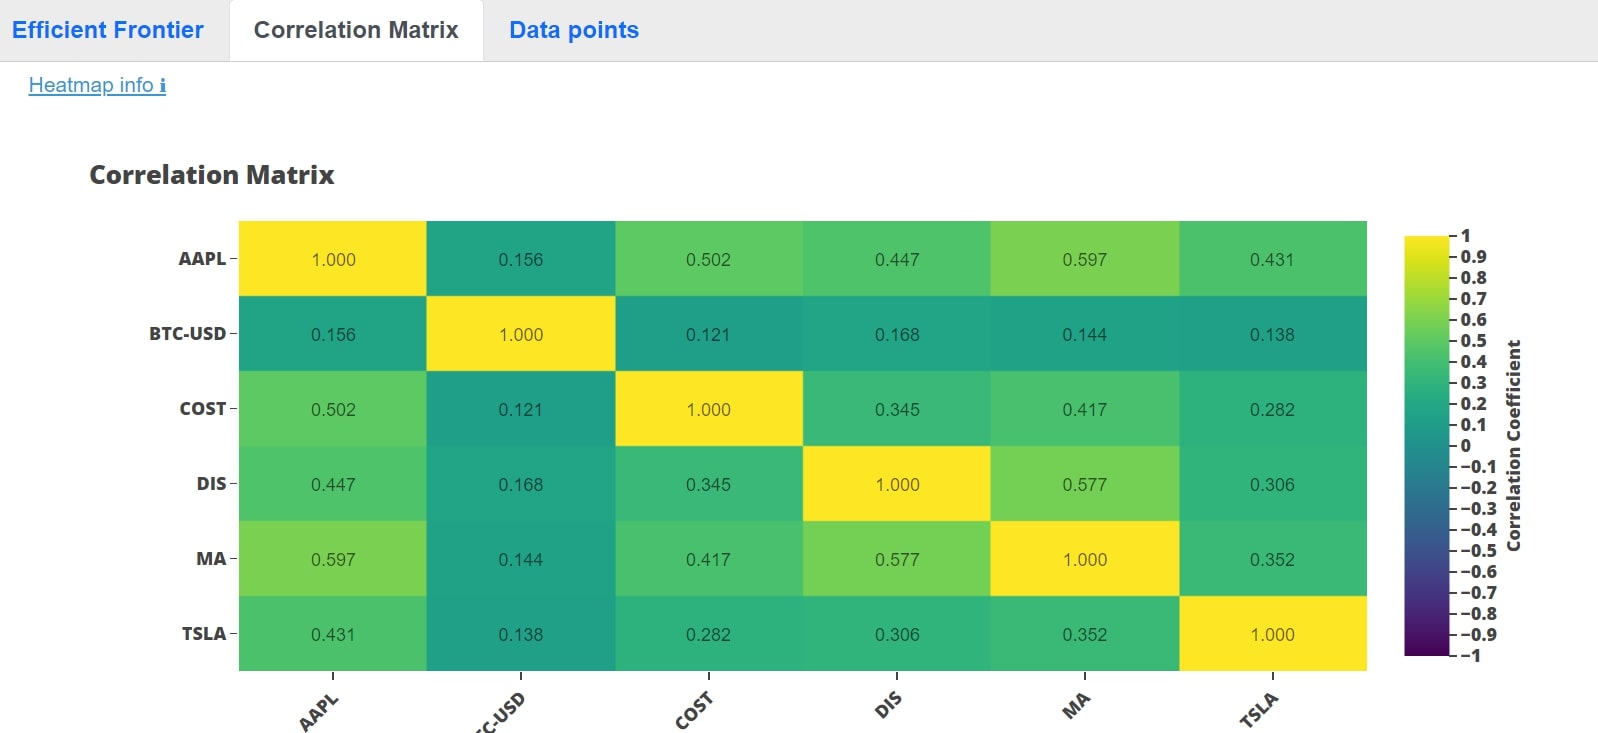
See how your assets move relative to each other — useful for checking how diversified you really are.
- Color-coded heatmaps show relationship strength between assets
- Values range from -1 (perfect negative) to +1 (perfect positive), with 0 = no correlation
- Low correlation between your holdings means better diversification
See how your portfolio stacks up against a major index or ETF.
- Go to your Profile settings
- Under Preferences, select a benchmark ticker (e.g., VOO, SPY, QQQ, IWM)
- Save your preferences
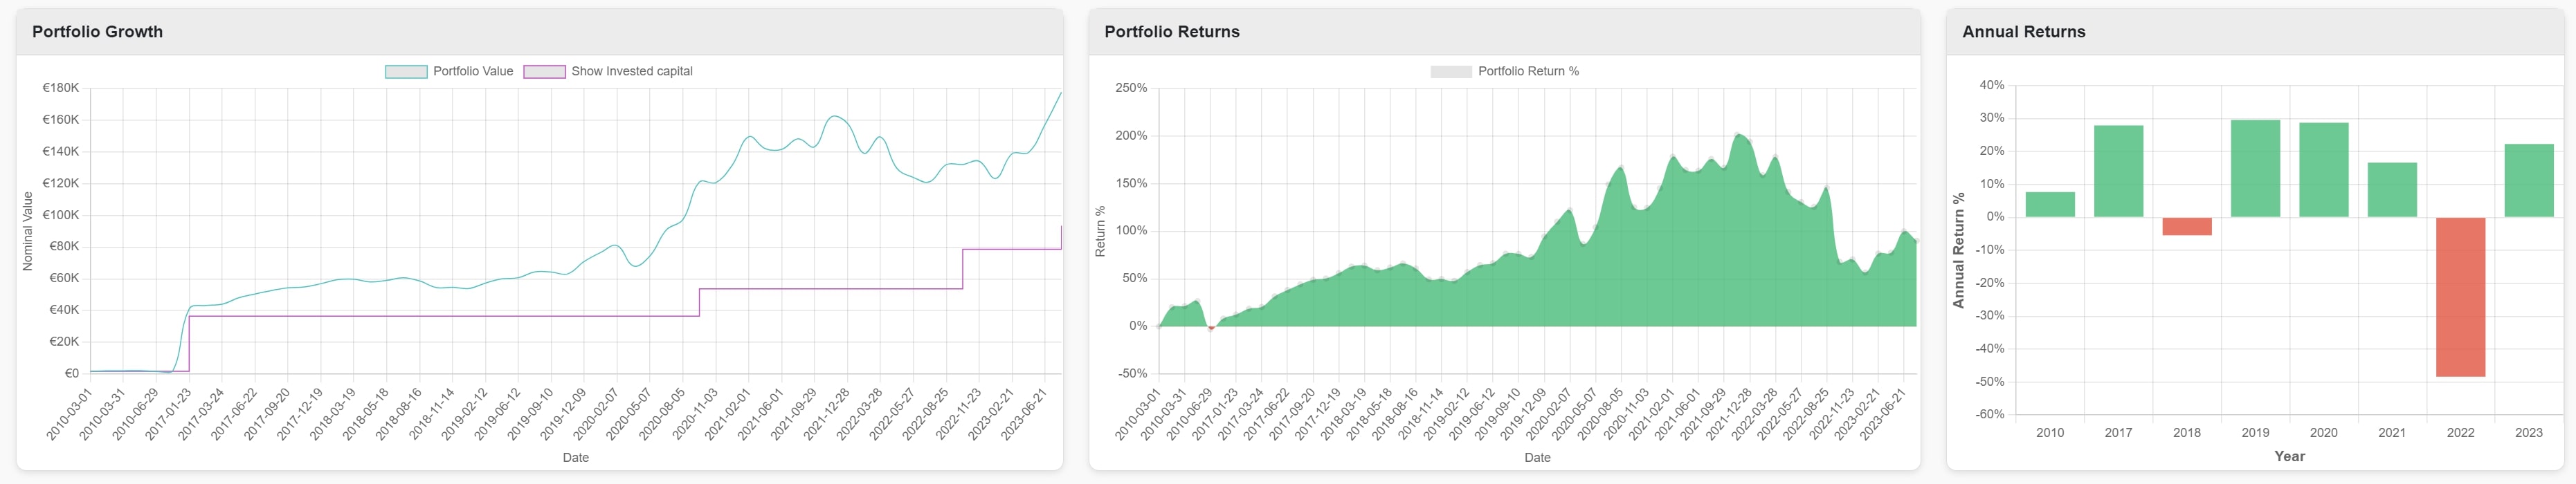
- View the Portfolio Growth chart on your Dashboard with benchmark comparison
The chart shows your portfolio value, invested capital, and the benchmark's performance — assuming the same contributions were made to the benchmark.
Portfolio Growth options:
- Include Realized toggle: On = includes realized + unrealized gains. Off = unrealized only.
- Time frames: YTD, 1 Year, 5 Years, Max
View your portfolio's yearly performance with two return metrics:
- TWR (Time-Weighted Return): Measures portfolio growth excluding the impact of cash flows. Best for comparing strategies.
- MWR (Money-Weighted Return / IRR): Accounts for the timing and size of deposits and withdrawals. Reflects your actual personal return.
Toggle between TWR and MWR on the Annual Returns section of your Dashboard.
Visualize your portfolio's return percentage over time.
- Include Realized toggle: On = comprehensive view including sold positions. Off = current market value only.
- Time frames: YTD, 1 Year, 5 Years, Max
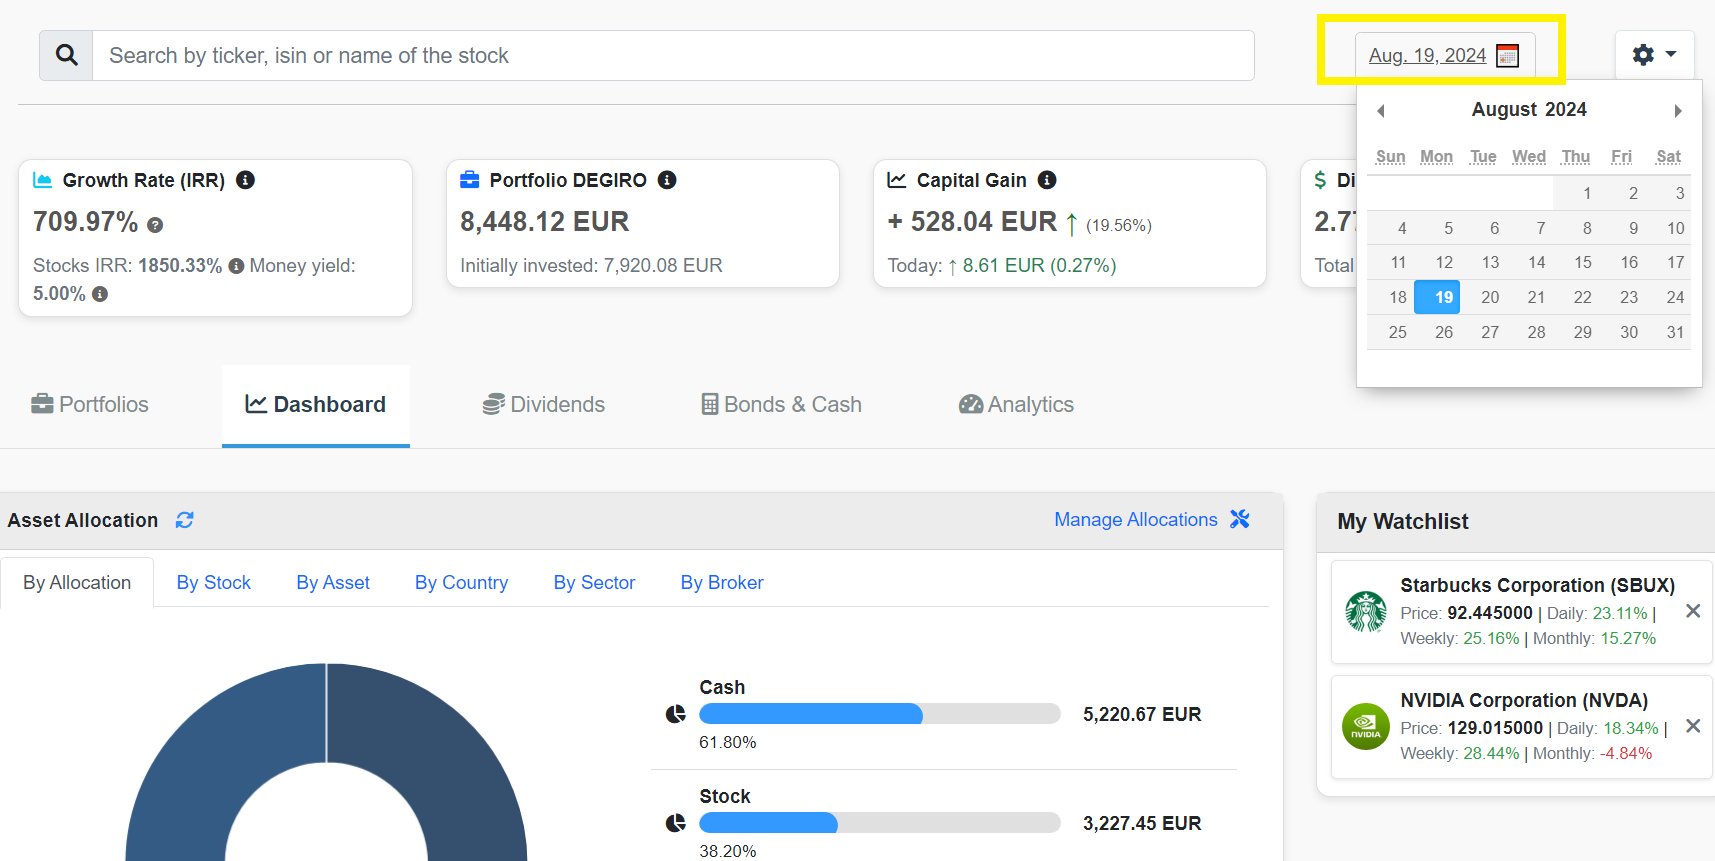
Go back in time and see exactly what your portfolio looked like on any past date.
- Navigate to your Dashboard
- Click the date selector at the top of the page
- Select a past date from the calendar
- The dashboard updates to show: portfolio value, asset allocation, individual holdings, and performance metrics as of that date
Use this to review how market events impacted your portfolio, compare performance at different points, or backtest strategies.
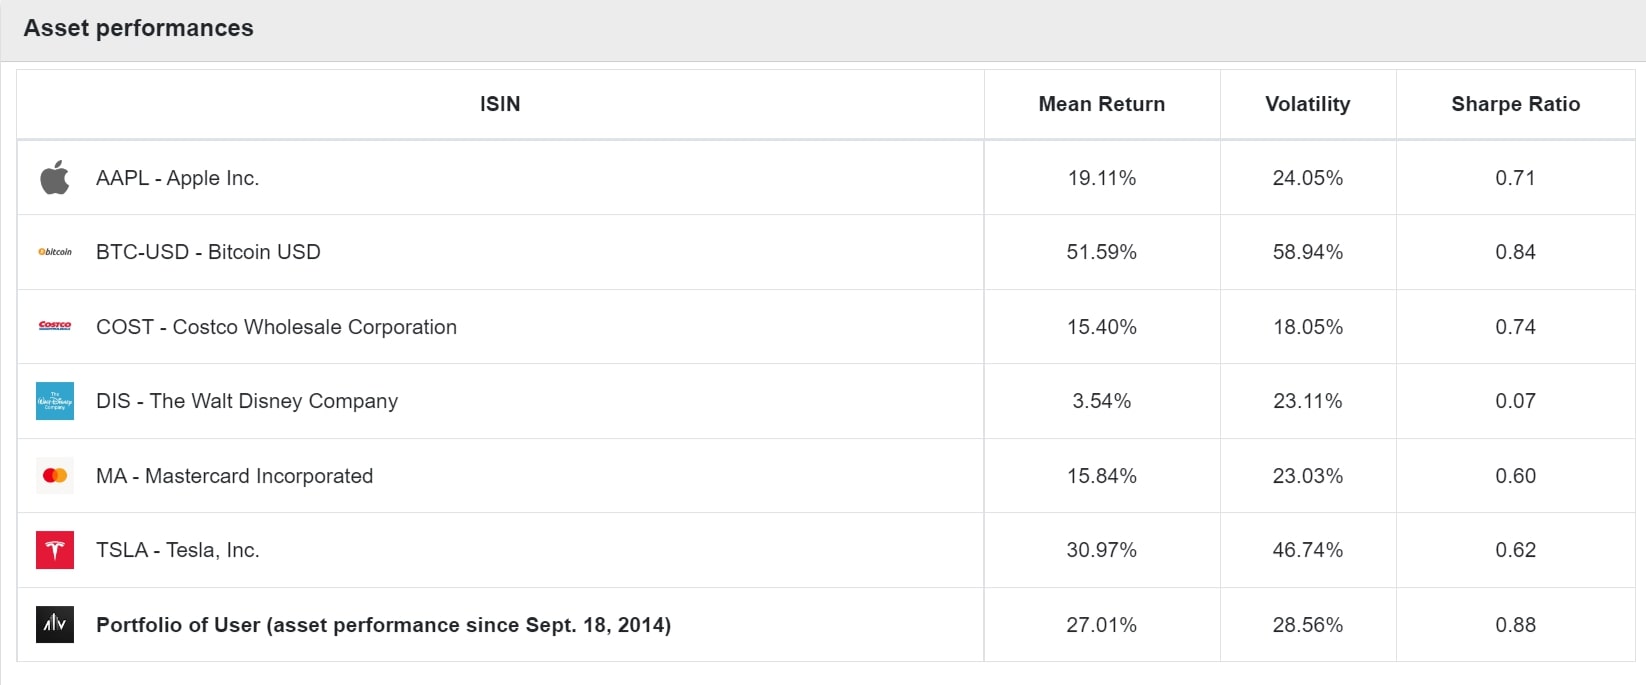
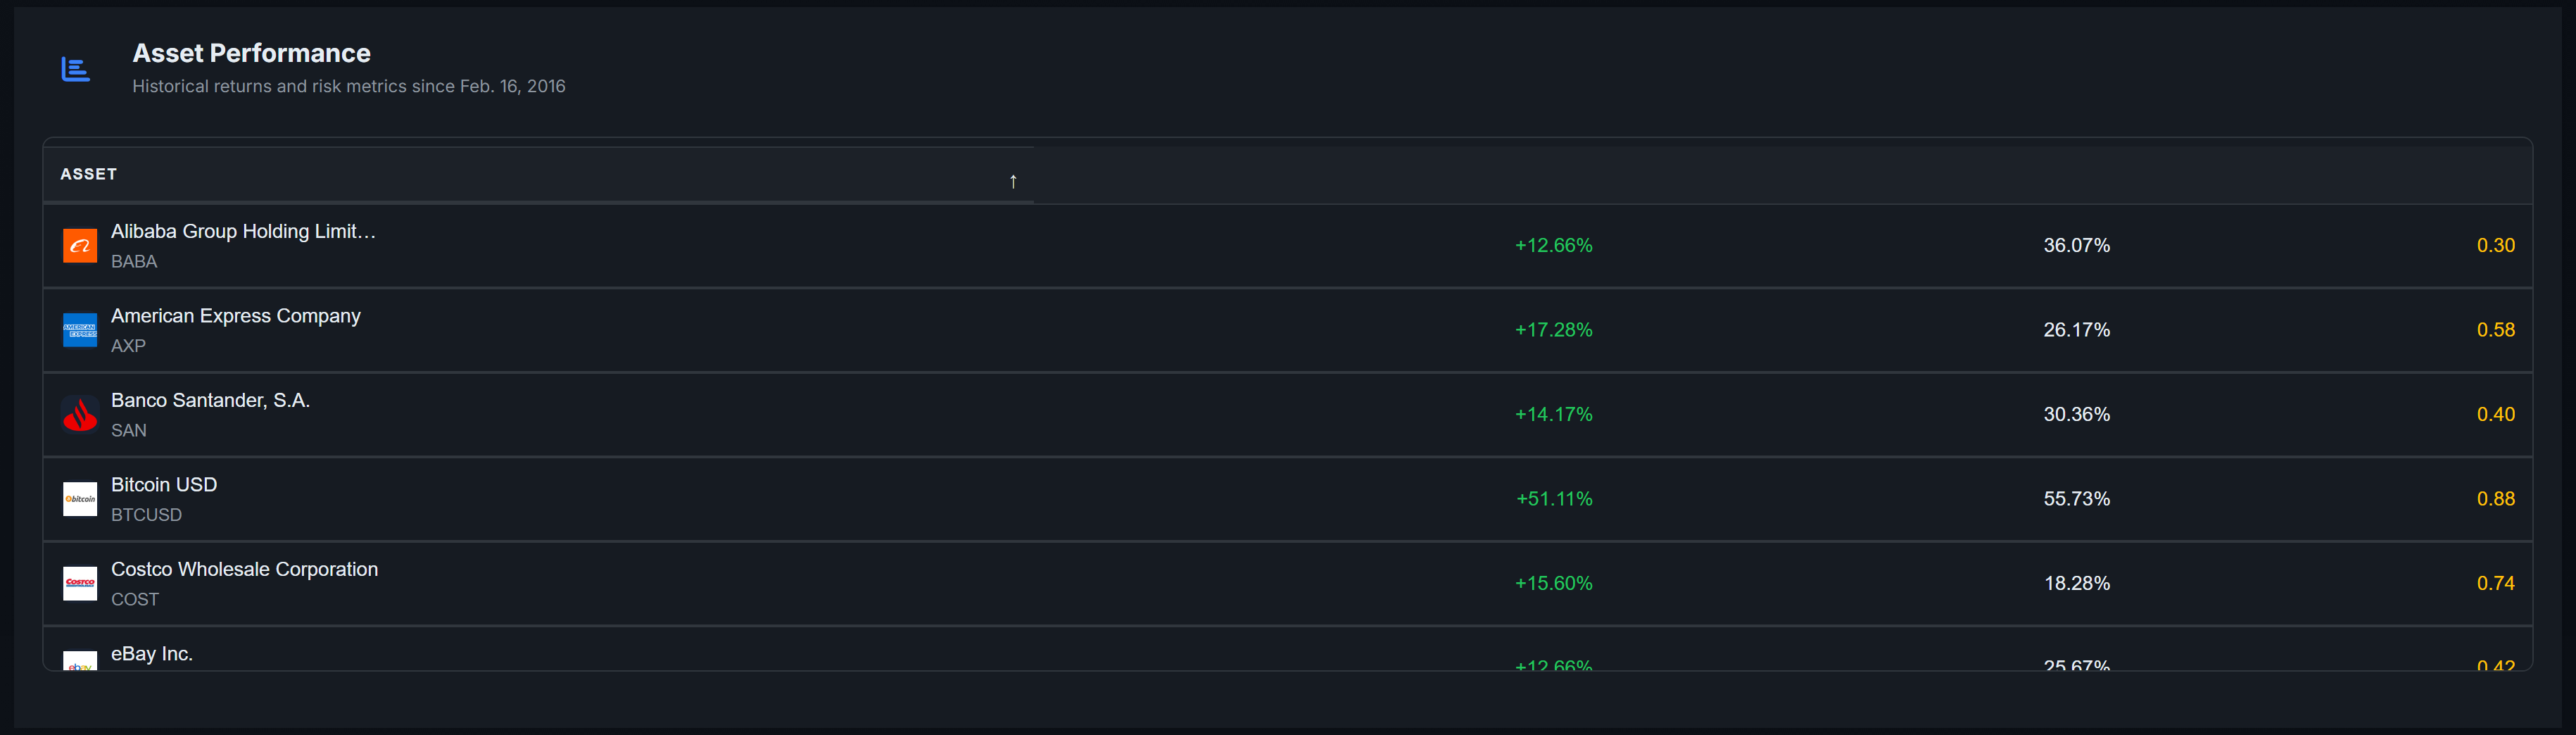
See which of your holdings are pulling their weight and which ones are dragging performance down. Each asset is plotted by its return vs volatility — high-return, low-volatility assets are your stars.
Find it in the Analytics tab. The chart includes your overall portfolio position so you can see how individual holdings compare to your aggregate performance.
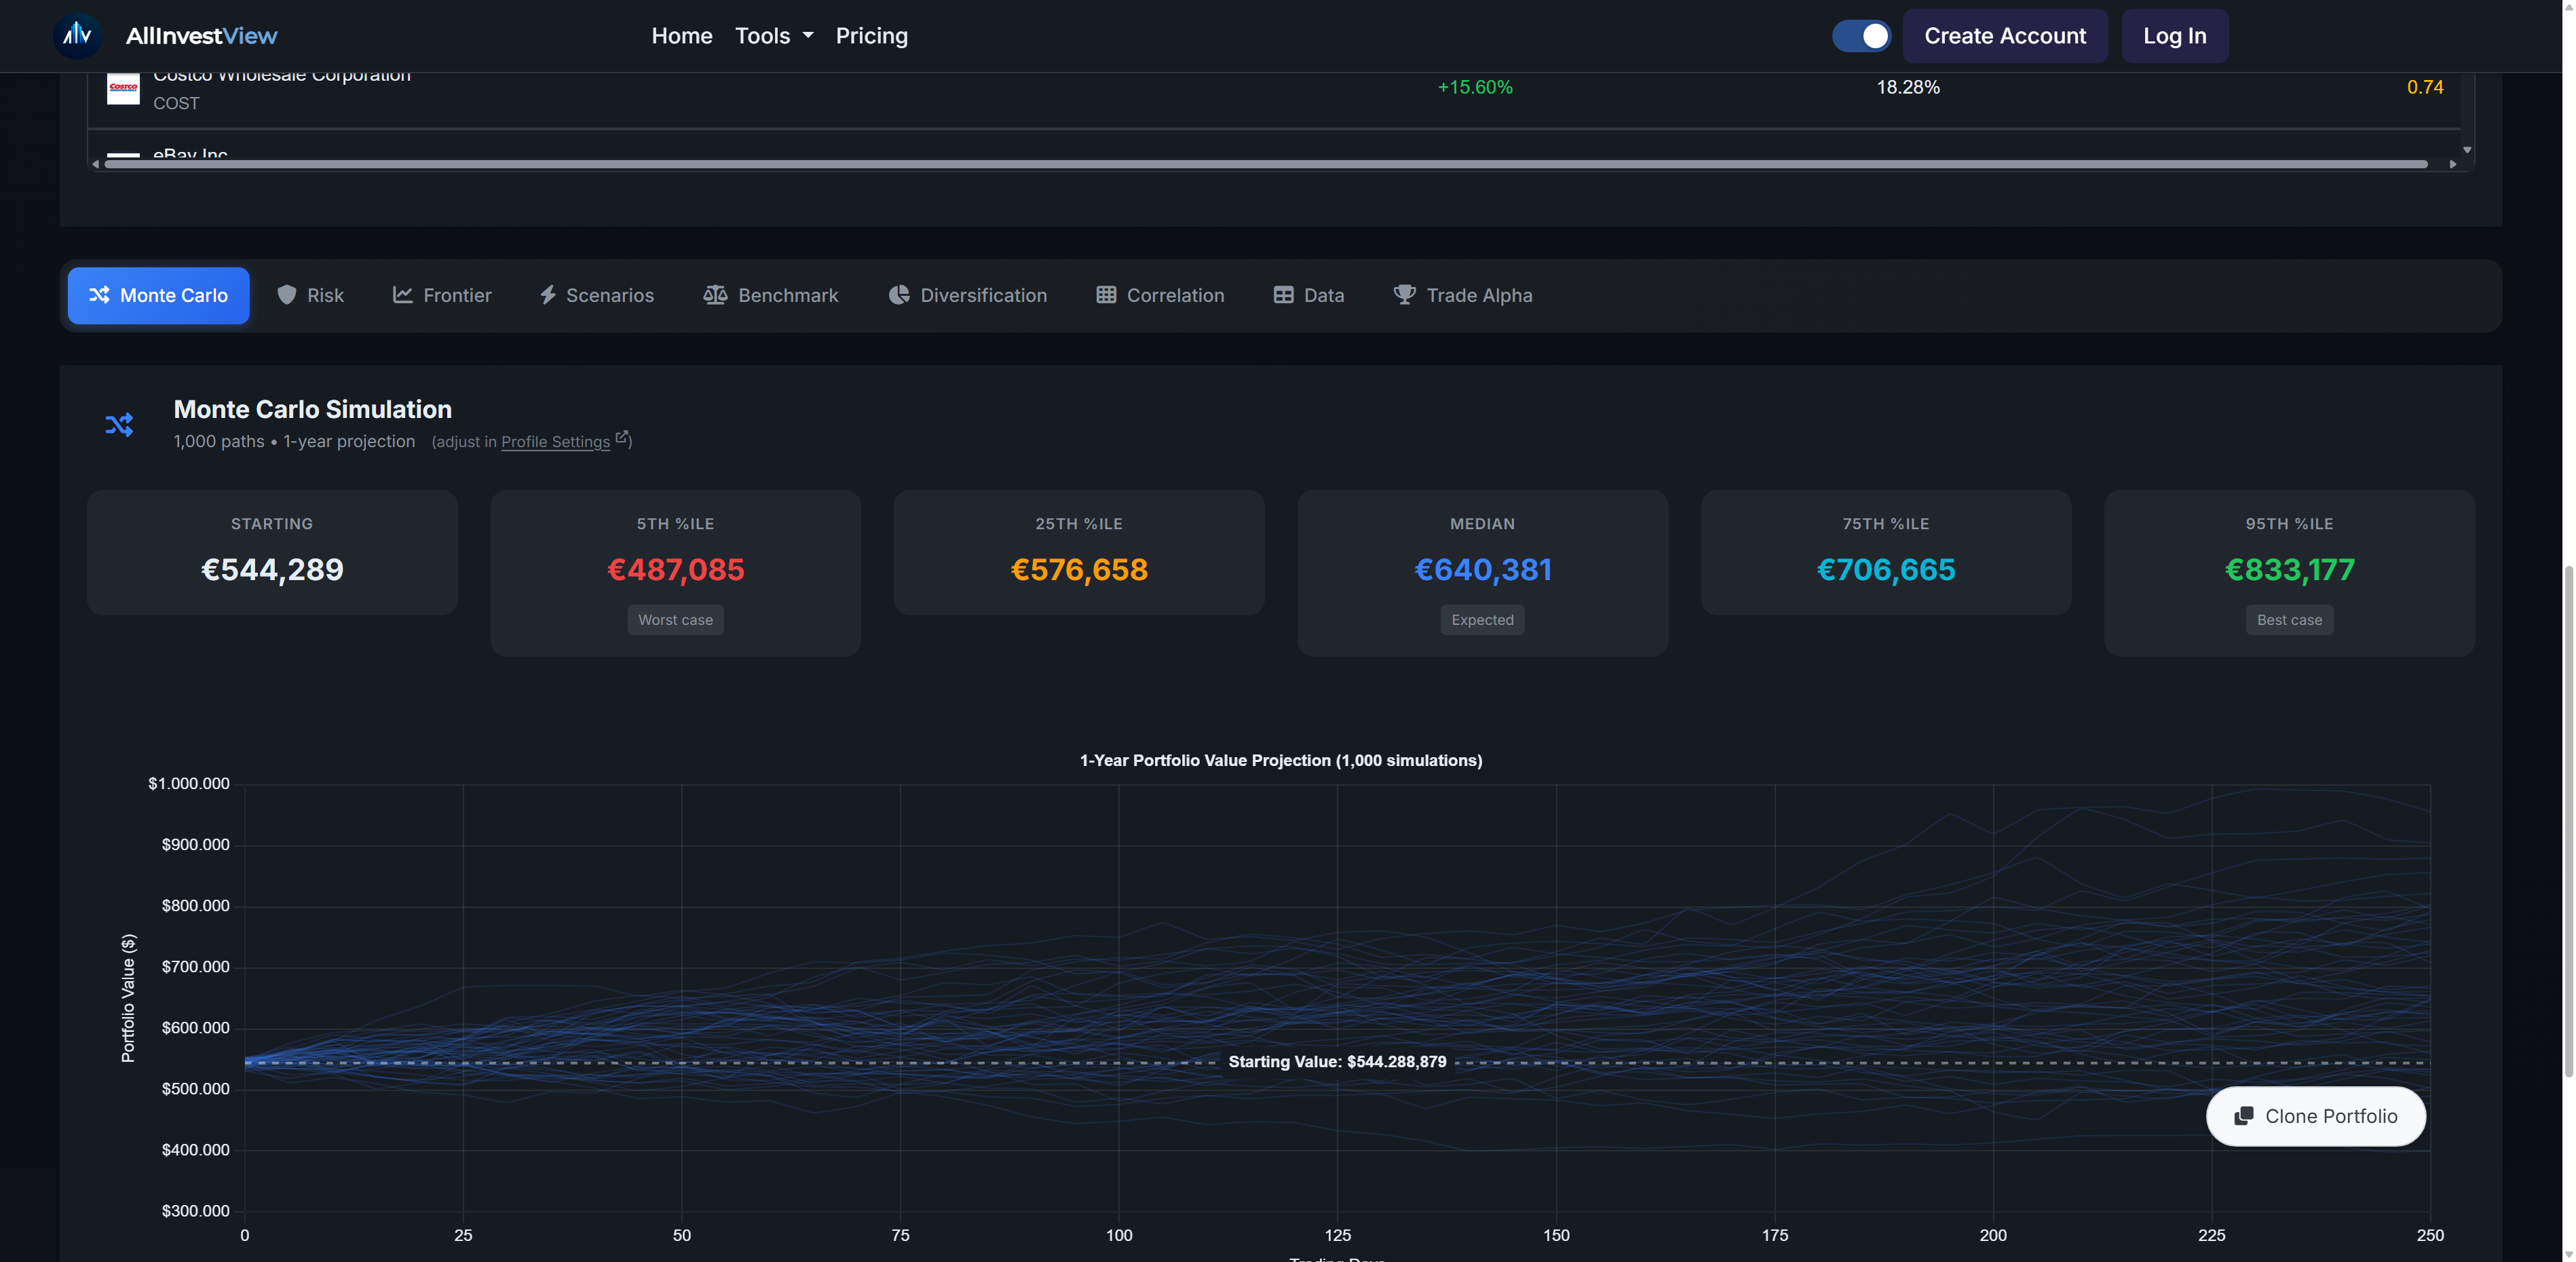
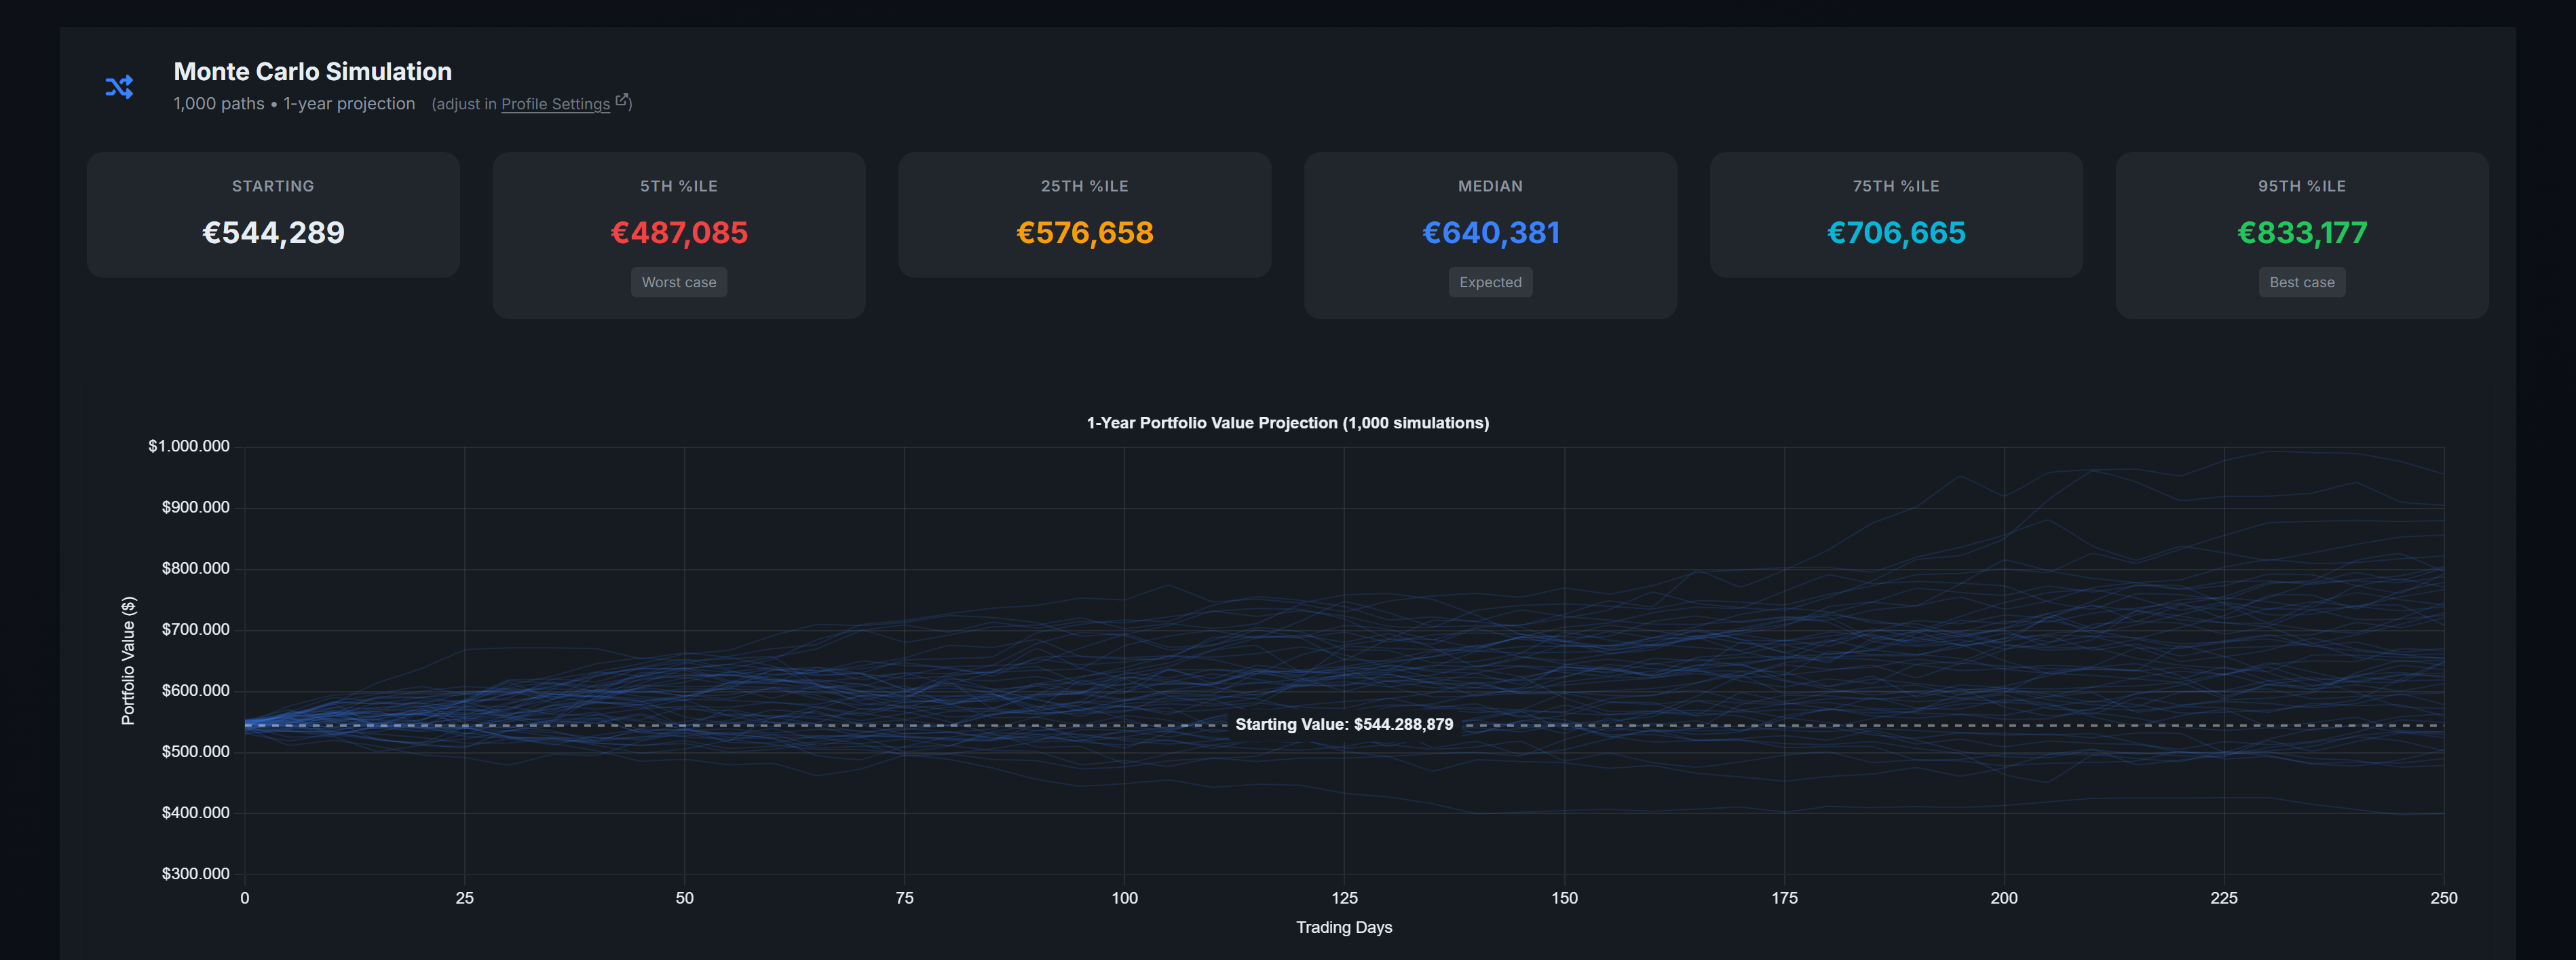
The Monte Carlo simulation runs 1,000 random scenarios based on your portfolio's actual historical returns and volatility. It shows you a range of possible outcomes over time.
Find it in the Analytics tab of your dashboard. The chart shows percentile bands (10th, 25th, 50th, 75th, 90th) so you can see best case, worst case, and most likely paths. It uses your real portfolio composition, not theoretical data.
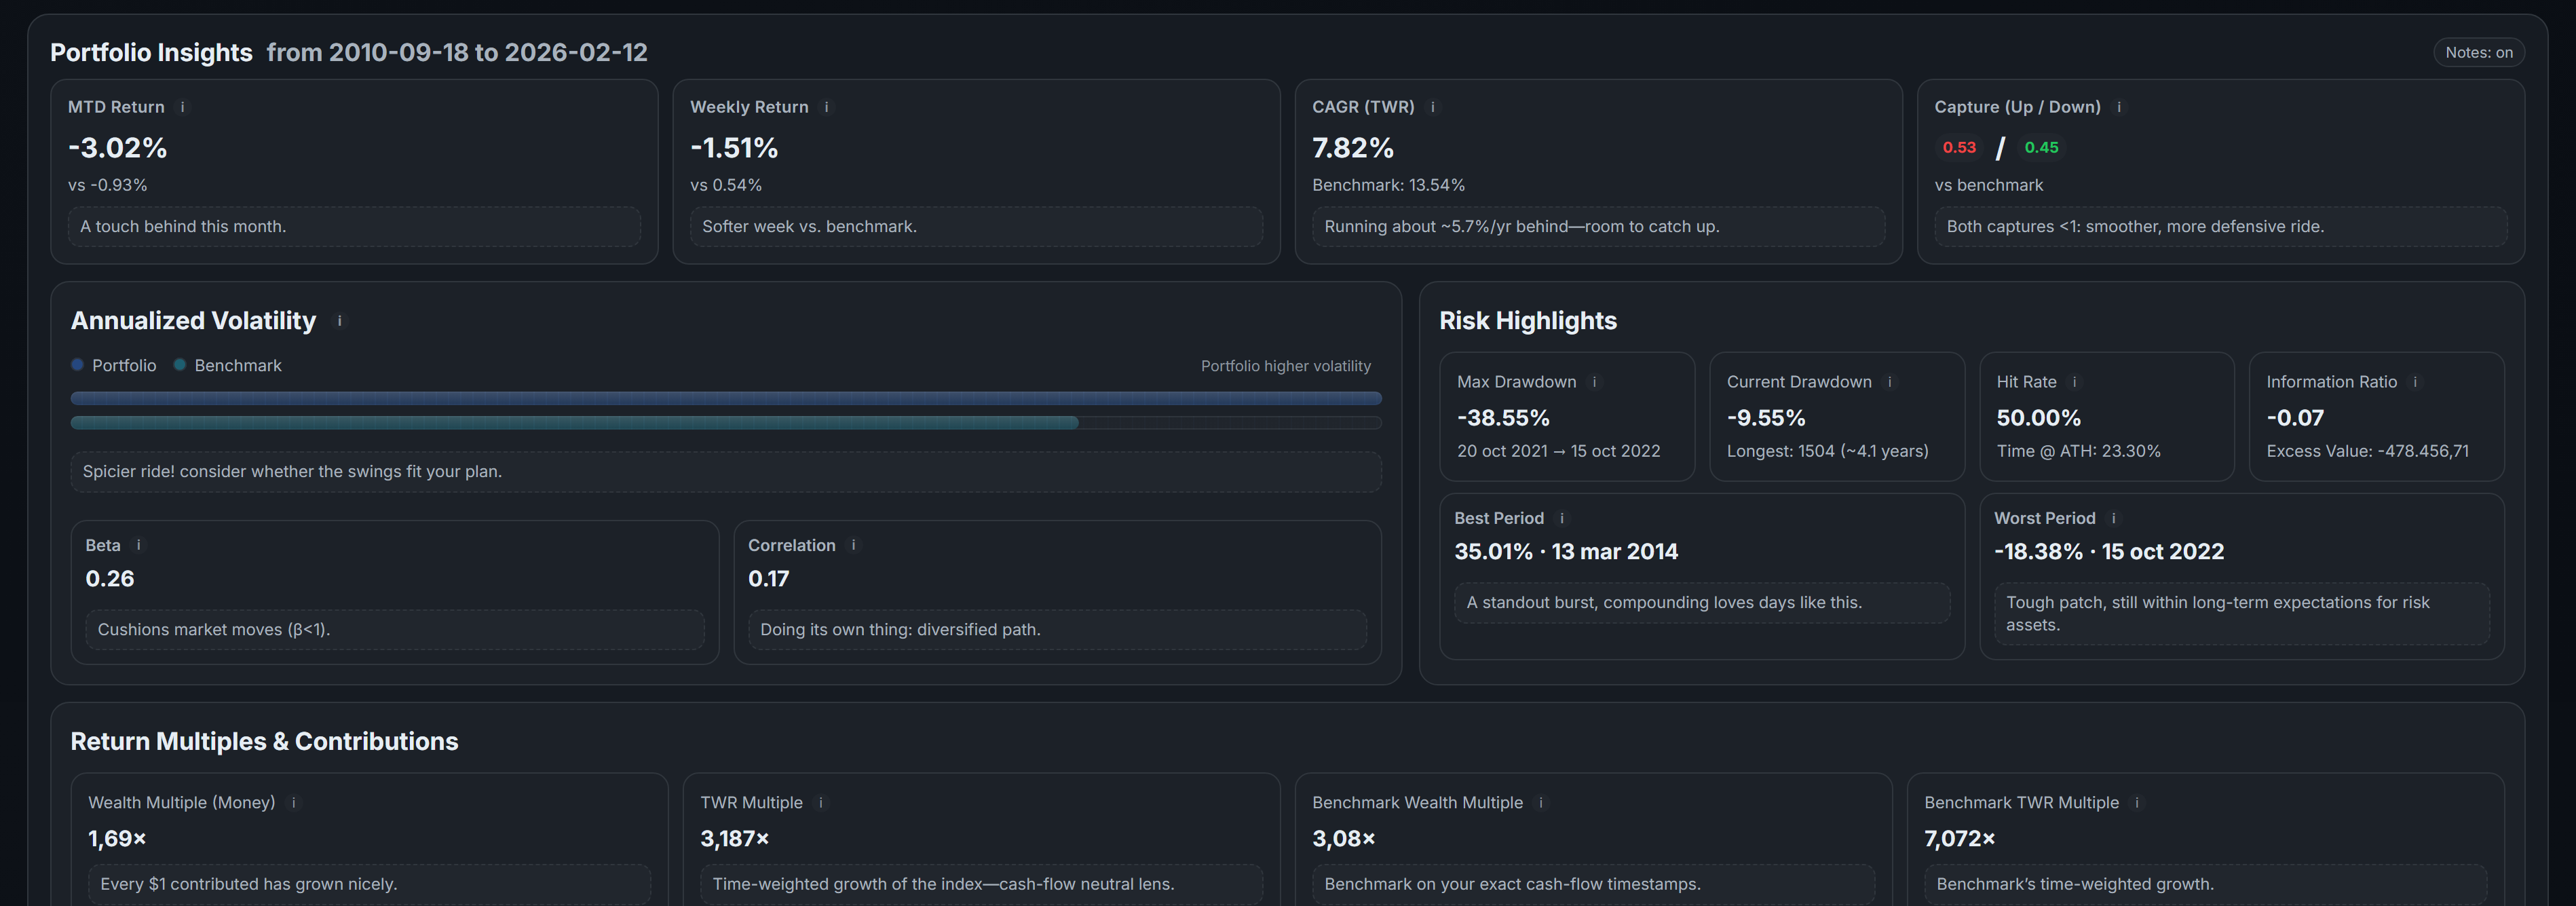
The Insights panel shows your portfolio's key risk and return metrics at a glance: CAGR (compound annual growth rate), total return multiple, best and worst day, maximum drawdown, volatility, Sharpe ratio, and Sortino ratio.
Find this in the Analytics tab. These numbers update automatically as your portfolio changes.
Keep track of when your stocks report earnings. The earnings calendar shows upcoming earnings dates for all holdings in your portfolio.
Click any stock in your dashboard to see its next earnings date, recent analyst upgrades and downgrades, and the latest financial news. Earnings dates also appear in your dashboard calendar alongside dividend dates and bond coupon payments.
Own ETFs like SPY, QQQ, or VTI? The ETF Holdings Breakdown shows you what's actually inside them — the individual stocks that make up the fund.
Click on any ETF in your dashboard to see its top holdings and their weights. This helps you understand your true underlying exposure across multiple ETFs and avoid unintentional concentration in specific stocks.
For stocks with available financial data, AllInvestView calculates an intrinsic value estimate using a Discounted Cash Flow (DCF) model.
Find it on any stock's detail page — click the stock name in your dashboard, then look for the Valuation section. The DCF shows whether the stock might be trading above or below its estimated fair value based on projected future cash flows.
The Analytics Table breaks down key metrics for every holding in your portfolio: return, volatility, Sharpe ratio, beta, weight, and more — all in one sortable table.
Find it in the Analytics tab of your dashboard. Sort by any column to quickly identify your best performers, riskiest holdings, or most volatile positions.
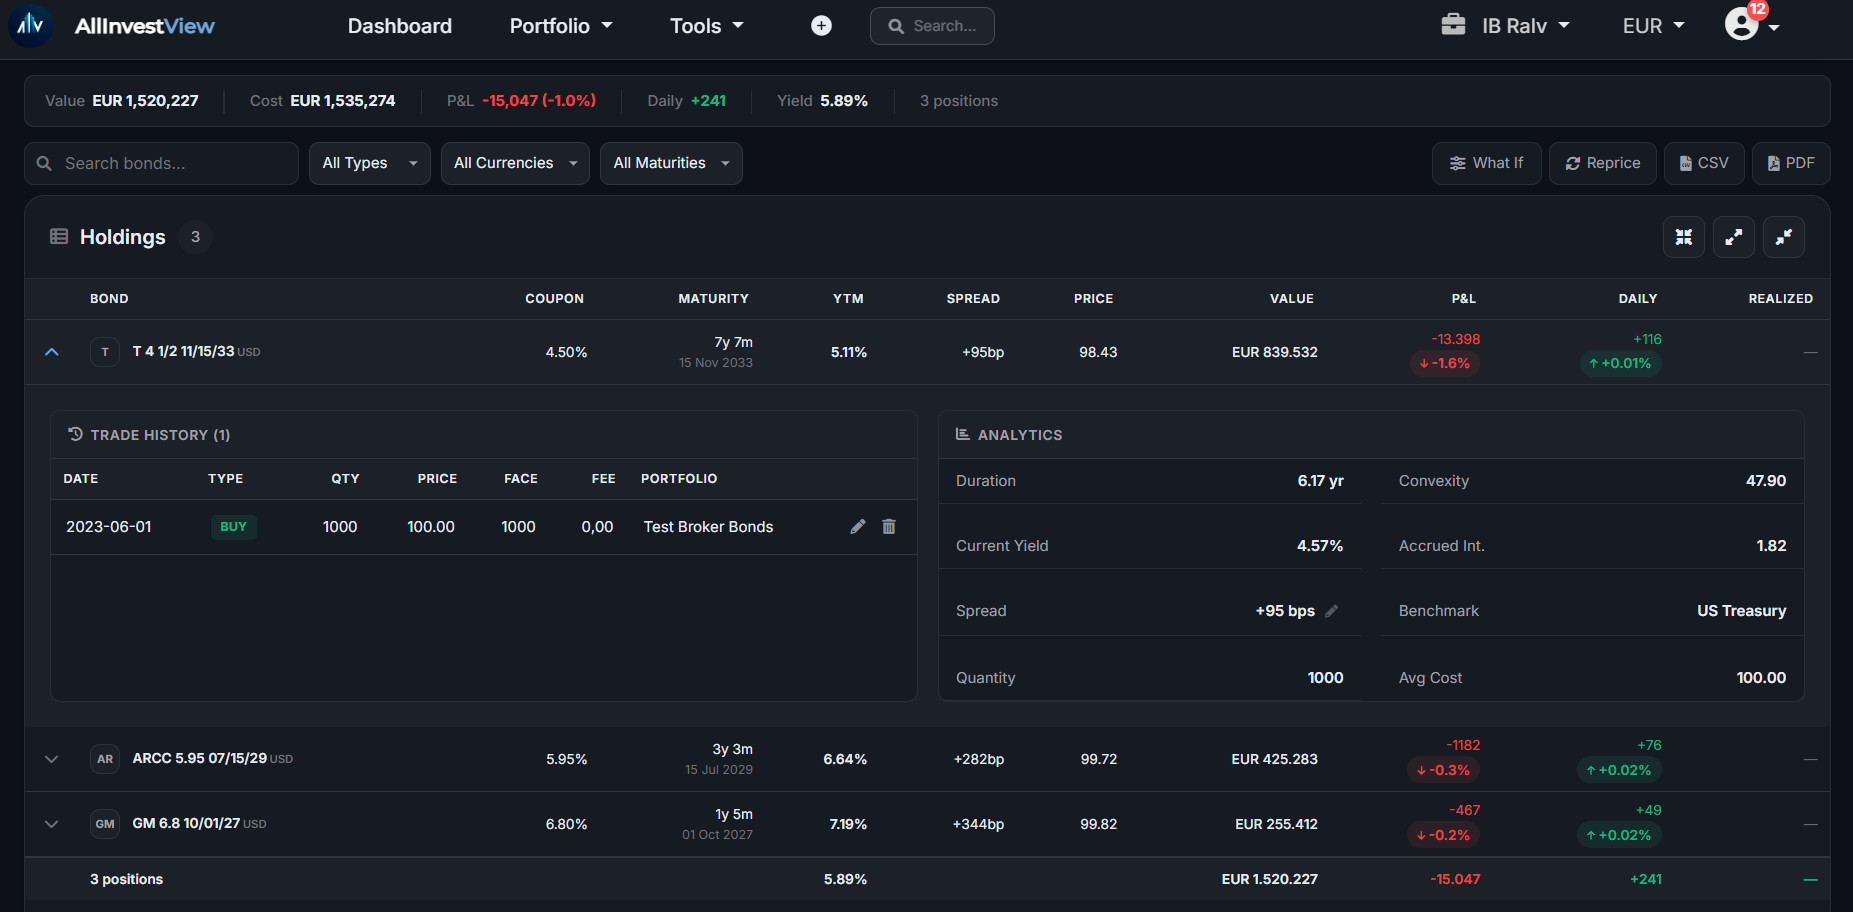
The Bond Holdings page gives you a consolidated view of your fixed income positions — aggregated by ISIN (not individual trades), with yield curve analytics, maturity ladder, and coupon projections.
What you'll see:
- Summary cards: weighted average yield, market value, unrealized P&L, bonds maturing within 12 months
- Positions table: each bond ISIN as one row showing net quantity, average cost, theoretical price, YTM, spread, and P&L
- Click any row to expand: trade history (all buys/sells), duration, convexity, accrued interest, benchmark info
- Maturity ladder: visual breakdown by year with bond type coloring and percentage allocation
- Coupon calendar: projected income by month for the next 12 months
- Yield curve chart: benchmark curves (GoC, Treasury, ECB, Gilt) with your bond positions overlaid as dots
Filtering: Filter by bond type (government, corporate, provincial, municipal), currency, maturity range (< 1Y, 1-5Y, 5-10Y, 10Y+), or text search. All filters are instant (client-side).
AllInvestView calculates theoretical bond prices using yield curve data from official central bank sources. Here's how it works:
- Benchmark assignment: Each bond is matched to a risk-free yield curve based on its currency — CAD bonds use the Bank of Canada curve, USD uses US Treasury, EUR uses ECB, GBP uses UK Gilts.
- Implied spread (once): When a bond is first repriced, the system calculates: your YTM at purchase minus the benchmark rate on your trade date. This spread represents the credit premium you paid. It's stored once and held constant.
- Daily theoretical price: Each time you visit the Bond Holdings page, the system looks up today's benchmark yield for the bond's remaining maturity, adds your implied spread, and discounts all future cash flows at that combined rate to get a theoretical present value.
- Reprice button: Click 'Reprice' in the filter bar to fetch the latest yield curves from central banks and recalculate all your bond prices. The page loads instantly with cached prices; repricing runs in the background.
Only bonds in supported currencies (CAD, USD, EUR, GBP) receive yield curve repricing. Other currencies show the purchase price without theoretical repricing.
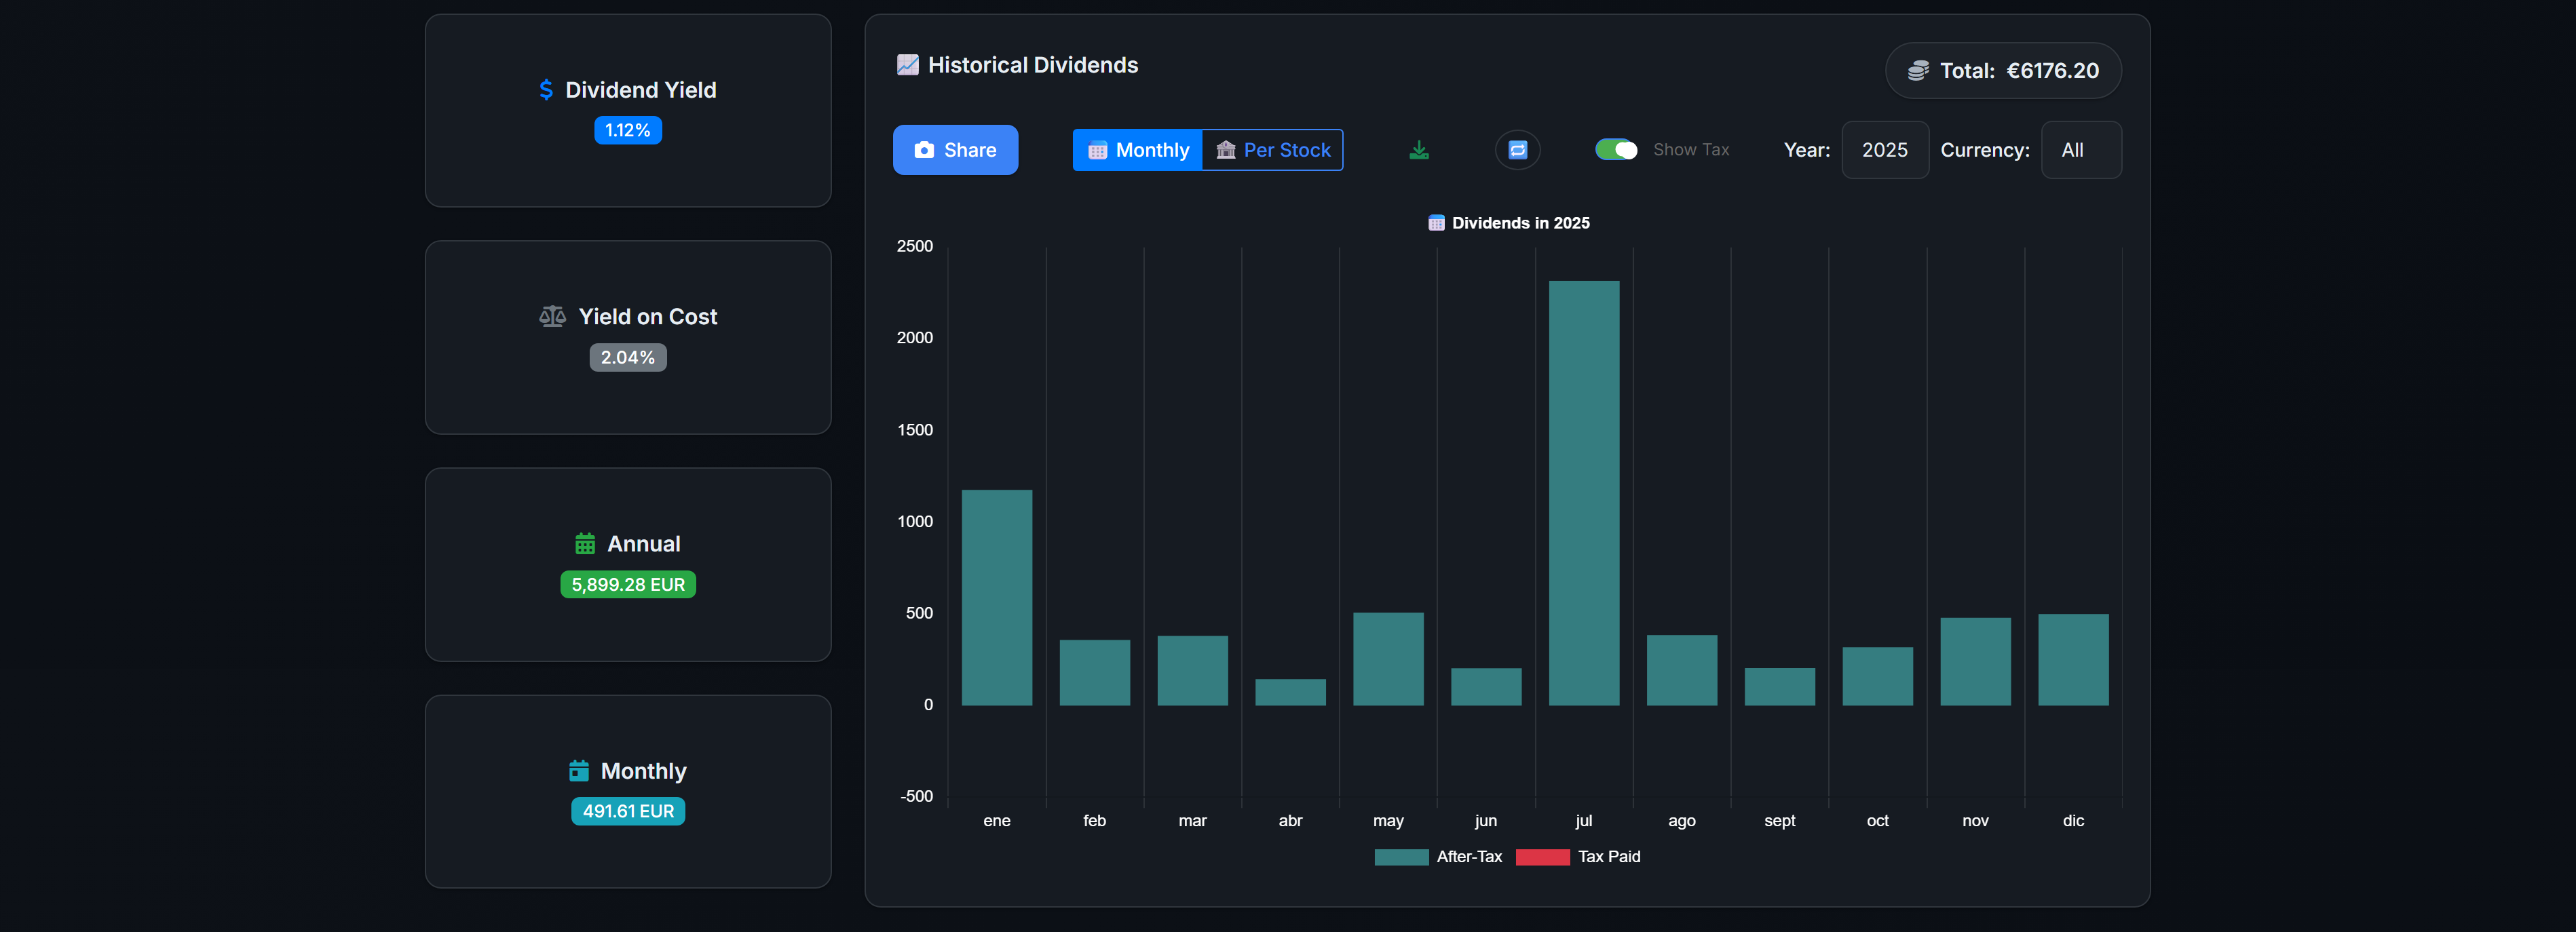
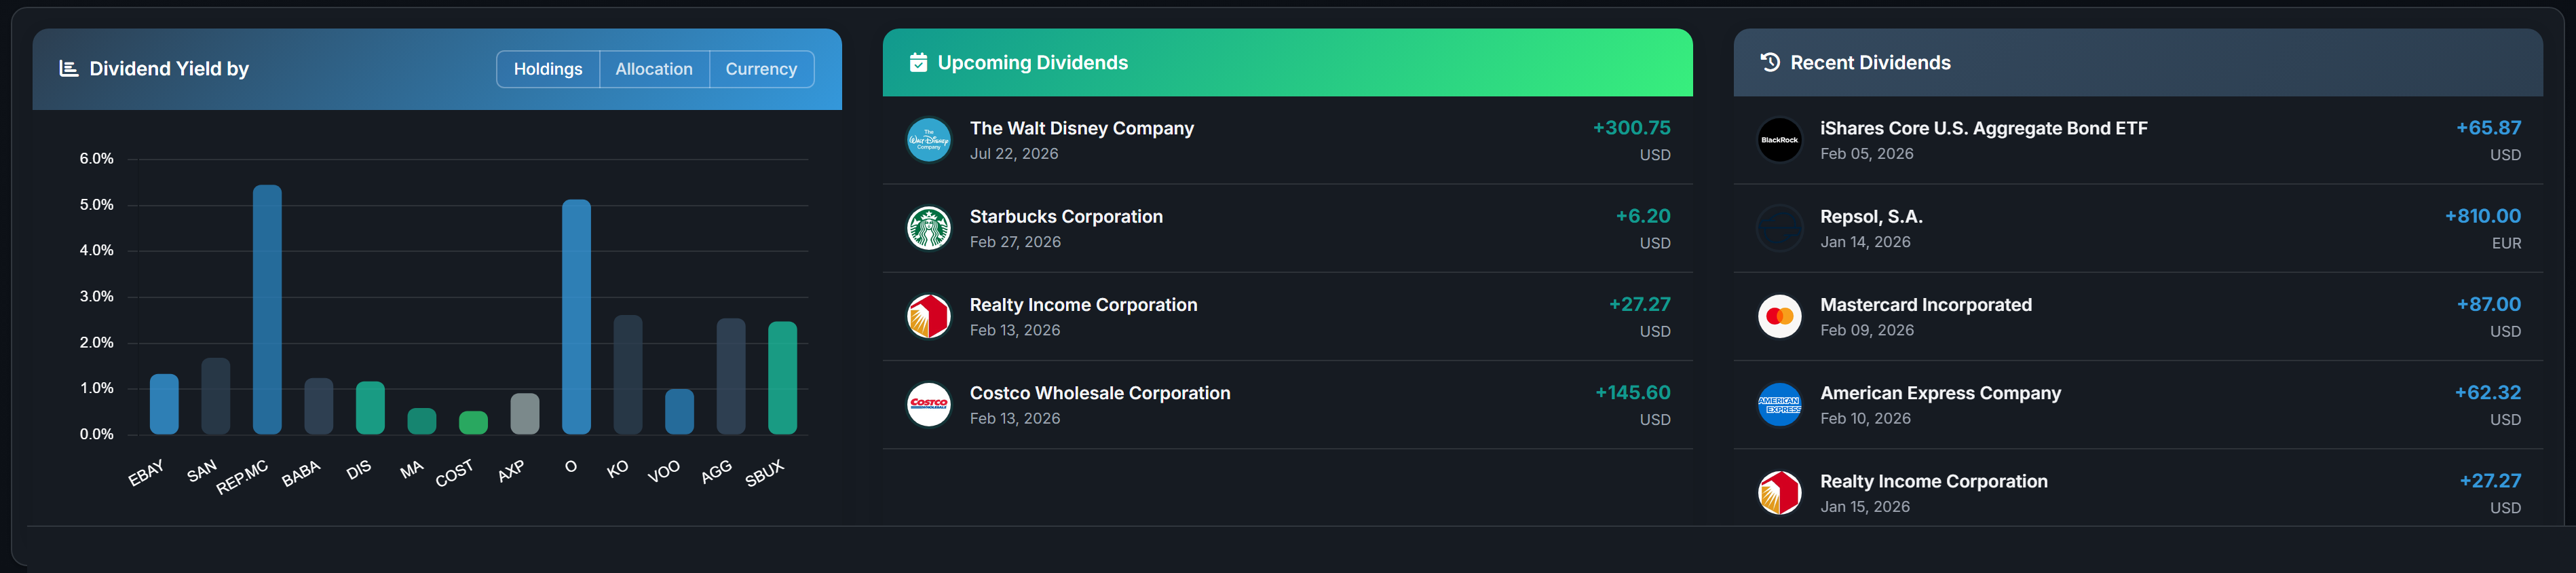
Dividends are tracked automatically for all your holdings. Check the 'Dividends' tab in your dashboard for the full picture.
- Total dividend income received (by month, quarter, or year)
- Projected annual dividends based on current holdings
- Yield on cost — your actual yield based on what you paid
- Dividend per holding with company logos and next payment dates
- Cross-currency tracking — dividends in any currency, converted to your display currency
- Gross vs net toggle — see income before or after withholding tax
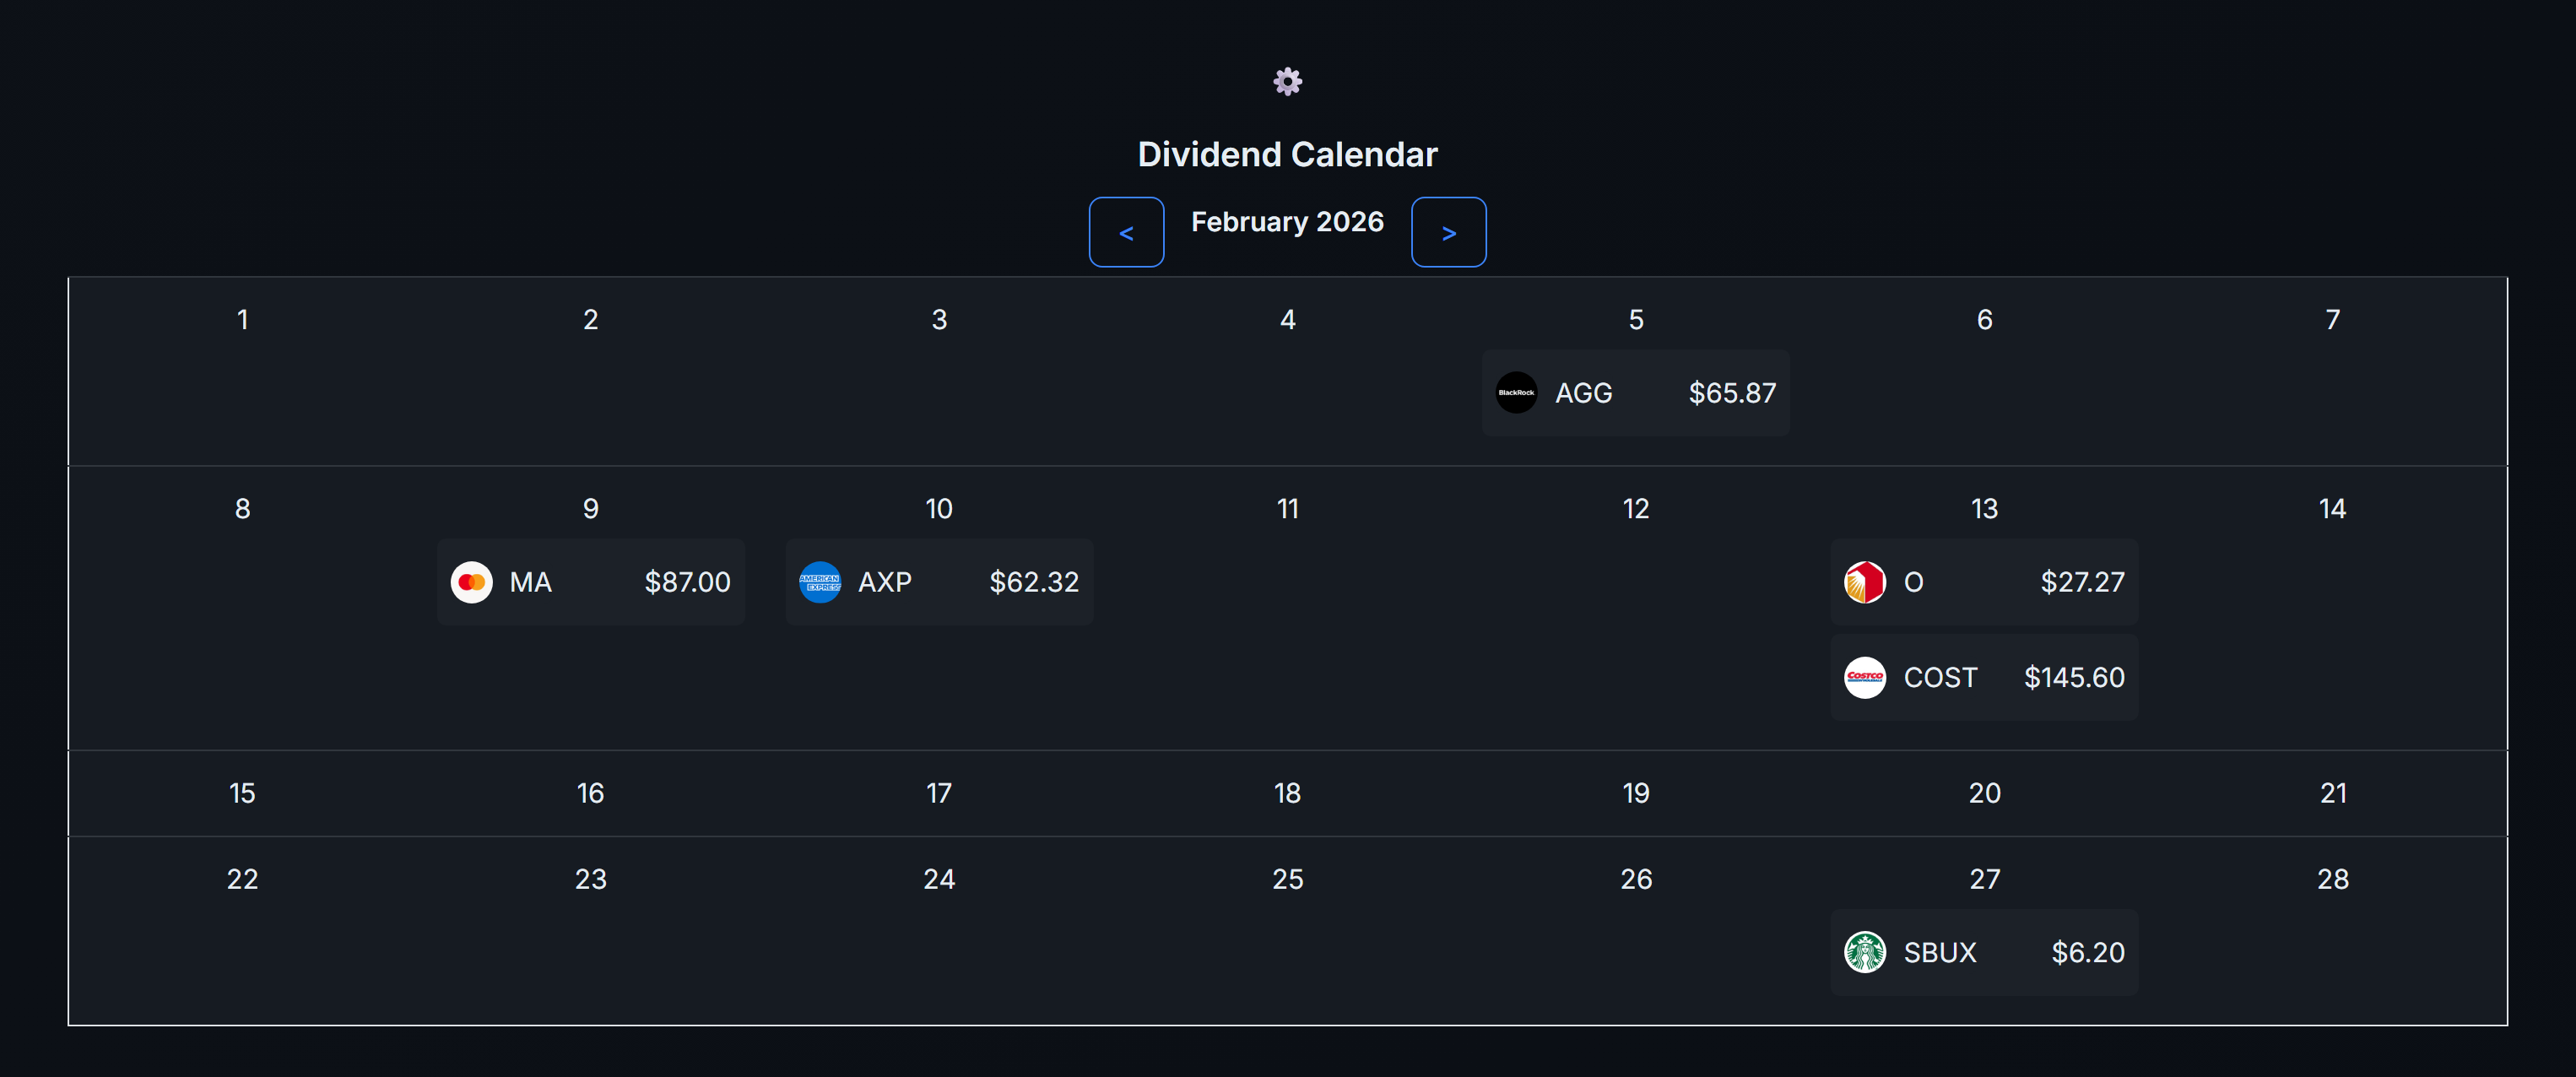
See exactly when your next dividends are coming in — great for planning reinvestments or knowing what to expect each month.
The calendar shows:
- Upcoming ex-dividend dates for your holdings
- Expected payment dates and amounts
- Bond coupon payment dates
- Earnings report dates for your stocks
Find the calendar in the Dividends tab of your dashboard.
Comprehensive visual analysis of your dividend income over time:
- View Toggles: Switch between Monthly view (growth over time) and Per Stock view (contribution by holding). Monthly view supports Bar and Line chart styles.
- Data Filtering: Filter by Year and Currency
- Tax & Amount Control: Toggle between Gross (Before-Tax) and Net (After-Tax) amounts
- Shareable Snapshot: Generate a professional image with optional Projection Ring
- Data Export: Download CSV for external tools
The Safety Score assesses the risk of a dividend cut, ranging from 0 (High Risk) to 100 (Excellent).
Calculated from:
- Free Cash Flow Payout (40%): Can the company cover the dividend with actual cash?
- Earnings Payout (35%): Is the dividend covered by accounting profits?
- Net Debt / EBITDA (15%): Could high debt jeopardize payments?
- Track Record (10%): History of consistent payments
When a stock splits, merges, or has another corporate action, AllInvestView picks it up and suggests the trades you need to book.
- Navigate to Corporate Actions
- Review the list of suggested actions
- Click 'Book' to automatically apply the suggested trade
- Click 'Amend' to modify if needed
For stock splits, a synthetic trade is created at the split date (price = 0) with the additional shares received.
Generate a full dividend report for any date range. Go to Reports and select "Dividend Report."
Pick your time range — or use a tax year preset (US, UK, Australia, and most EU tax years are supported). The report shows every dividend payment with dates, amounts, withholding tax, and net received.
Export as PDF, Excel, or CSV for your records or tax filing.
If you hold Australian stocks, AllInvestView tracks franking credits (imputation credits) on your dividends. When adding or editing a custom dividend, you can set the franking percentage — the system calculates the credit amount automatically.
Your dividend reports include franking credit totals, which is useful for Australian tax returns where franking credits reduce your tax liability.
For assets where dividends aren't tracked automatically (custom assets, some international stocks, bond coupons), you can add them manually.
Go to your dashboard's Dividends tab and click "Add Custom Dividend." Enter the stock, date, amount, currency, and any withholding tax. Custom dividends appear alongside auto-tracked ones in all reports and charts.
The Price Alerts Dashboard gives you full control over all your alerts in one place. At the top you'll see your stats: total alerts, active, triggered, and which one is closest to firing.
Creating an alert:
- Click "Create Alert" and enter the stock symbol
- Set your target price
- Choose whether to trigger when the price goes above or below the target
- Save — you're done
Bulk create: Set up alerts for multiple stocks at once. Enter a percentage (e.g., ±10%) and the system creates alerts for all your holdings automatically.
Portfolio Protection: One click creates a protective alert for every open position. Set a drop threshold (e.g., -15%) and you'll be notified if any holding falls by that amount. Great for peace of mind.
When an alert triggers:
- Email notification
- Push notification (if you use the mobile app)
- In-app notification (bell icon)
Alerts are one-time — once triggered, they deactivate automatically. Reactivate them anytime from the dashboard.
Bulk actions: Select multiple alerts and delete, activate, or deactivate them all at once.
Find stocks that match what you're looking for — filter by market cap, sector, dividend yield, price range, and more.
- Open the Stock Screener from the Tools menu
- Set your filters: market cap, price, sector, industry, dividend yield
- Click "Apply Filters" to see matching stocks
- Click any result for full details, or add it directly to your portfolio
Exchanges covered: NYSE, NYSE ARCA, NASDAQ, OTC Markets. You can also filter international stocks listed on these exchanges.
Track your income from selling options with the Options Income Tracker. It shows your total premium collected, broken down by month.
See which strategies earn the most, your win rate, and average days held. Useful for covered call and cash-secured put sellers who want to see options income separate from capital gains.
Keep a log of your options trades with the Trading Journal. It shows your trade history with win/loss stats, average return, and notes for each trade.
Add notes about why you entered a position and what you learned. Filter by date, strategy, or outcome.
Visualize profit and loss before entering a trade with the Payoff Calculator.
Enter the legs of your trade — calls, puts, different strikes and expirations — and see the breakeven points, max profit, max loss, and the full payoff curve. Works for single options or multi-leg strategies like spreads, iron condors, and straddles.
Two dedicated calculators for the most popular income strategies:
- Covered Call Calculator — evaluate selling calls against shares you own. See max profit, downside protection, and annualized return.
- Cash-Secured Put Calculator — evaluate selling puts. See the effective purchase price if assigned, premium yield, and break-even.
To record a short sale, add a Sell transaction for a stock you don't own. AllInvestView will show a negative quantity, representing your short position.
When you close the short (buy to cover), add a Buy transaction for the same quantity. Your realized P&L will reflect the difference between sell and buy prices.
Check out exclusive offers from partner brokers at Partner Brokers. These include sign-up bonuses, free trades, or account funding matches available through AllInvestView.
If you open an account through a partner link, you may be eligible for bonus rewards.
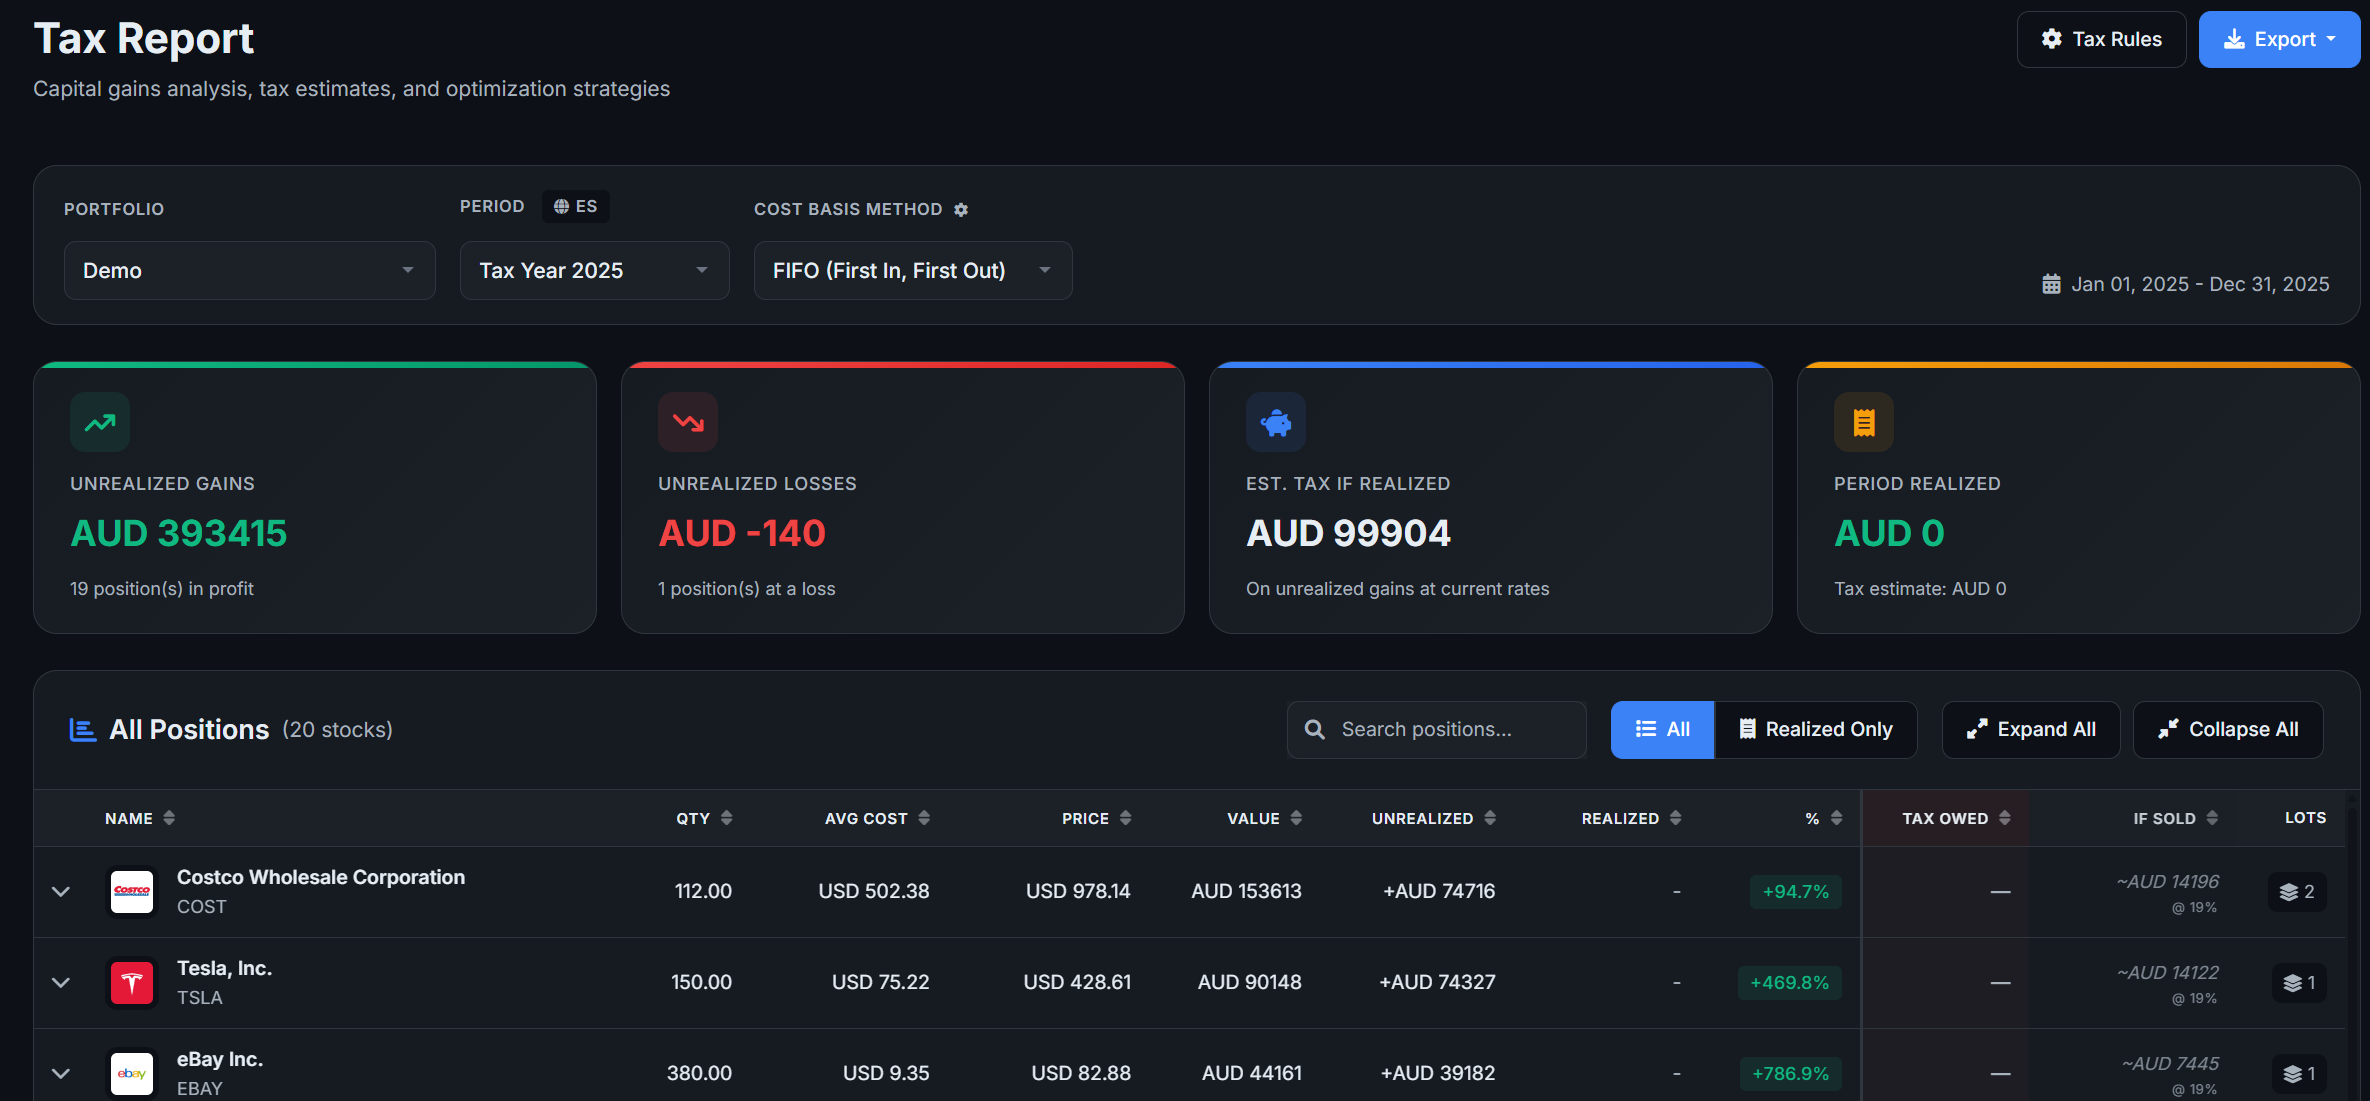
Generate a capital gains and losses report for any date range. Go to Reports and select "Tax Report."
Pick your tax year — AllInvestView supports tax year presets for 13 jurisdictions: US, UK, Australia, Canada, Germany, Denmark, Spain, France, Ireland, Italy, Sweden, Switzerland, and more. Or set a custom date range.
Choose your cost basis method: FIFO (First In, First Out), LIFO (Last In, First Out), Average Cost, or Specific Identification. Each method can produce different tax outcomes.
The report shows: realized gains/losses by holding, short-term vs long-term classification, wash sale warnings, total tax liability estimate, and unrealized gains for tax planning.
Export as PDF, Excel, or CSV for your accountant or tax filing. Set up your capital gains tax rules first for the most accurate results.
AllInvestView supports four cost basis methods. You can set your default in Account Settings, and override per report.
- FIFO (First In, First Out): Sells your oldest shares first. Most common method worldwide and the IRS default in the US.
- LIFO (Last In, First Out): Sells your newest shares first. Can be useful to realize short-term losses or minimize gains in a rising market.
- Average Cost: Uses the weighted average price of all your shares. Common for mutual funds and in many European countries.
- Specific Identification: You pick exactly which lots to sell. Gives the most control for tax optimization but requires keeping detailed records.
Set up custom tax rules at Capital Gains Tax Rules to match your jurisdiction's rates and rules.
You can configure:
- Tax rate (flat percentage or progressive brackets)
- Short-term vs long-term holding period threshold (e.g., 1 year in the US)
- Wash sale window (e.g., 30 days in the US)
- Loss carryforward rules (years allowed, annual deduction limits)
- CGT discount (e.g., Australia's 50% discount for holdings over 12 months)
- Match by country, broker, or asset type
AllInvestView comes with templates for common jurisdictions (US, UK, Australia, Canada, Germany, Spain, France, Ireland, Italy, Sweden, Switzerland) — pick one as a starting point and customize.
Rules are evaluated by priority. The most specific matching rule wins (e.g., a rule for "US stocks held over 1 year" beats a general "all stocks" rule).
Customize how withholding tax is applied to your dividends at Dividend Tax Rules.
Create rules that match by currency, country, broker, ISIN, or stock name. Set the withholding tax rate (%) and a priority level. Higher priority rules override lower ones.
For example: set 15% withholding for all US dividends, but 0% for dividends in your tax-free ISA portfolio.
Your dividend reports automatically apply these rules to calculate net (after-tax) dividend income.
AllInvestView automatically checks for potential wash sales when you generate a tax report.
A wash sale happens when you sell a stock at a loss and buy the same stock (or a substantially identical one) within a specific window — 30 days before or after the sale in the US.
If a wash sale is detected, the report flags it with a warning. The disallowed loss gets added to the cost basis of the replacement shares.
You can configure the wash sale window in your Capital Gains Tax Rules (default: 30 days for US).
Track capital losses you can carry forward to offset future gains.
Go to your Tax Report page and add loss carryforward records. Enter the tax year, original loss amount, and how much has been used so far. AllInvestView tracks your remaining balance by short-term and long-term categories.
Some jurisdictions limit how much you can deduct per year (e.g., $3,000 per year against ordinary income in the US). Configure these limits in your Capital Gains Tax Rules.
Export a complete record of all your transactions. Go to Reports and select "All Transactions."
The report includes every buy, sell, dividend, and corporate action across all your portfolios. Filter by date range, portfolio, or asset type. Export as PDF, Excel, or CSV.
Useful for recordkeeping, importing into other tools, or sending to your accountant.
If you're a Spanish tax resident with foreign assets, AllInvestView can generate your Modelo 720 declaration.
Go to Modelo 720 and select the fiscal year. AllInvestView automatically calculates:
- Section C1: Cash accounts abroad
- Section C2: Securities abroad (stocks, ETFs, bonds, options)
- Section C3: Real estate abroad
Each section has a reporting threshold. The tool uses ECB exchange rates for EUR conversion.
Export options:
- BOE format (ready to upload to the Spanish tax authority)
- Excel workbook
- Standard XML
You can save reports as drafts, mark them as filed, and review previous years. Co-ownership is supported — set ownership percentages per asset.
AllInvestView has specific features for Australian investors:
CGT Discount: Assets held over 12 months qualify for a 50% capital gains discount. Set this up in your Capital Gains Tax Rules — the tax report applies it automatically.
Franking Credits: When you receive dividends from Australian companies, the franking credit (imputation credit) is tracked. Add franking percentages when recording custom dividends. Your dividend reports include total franking credits for your tax return.
Australian Tax Year: July 1 to June 30. Select "Australia" as your tax jurisdiction in Account Settings and reports will default to the correct date range.
AllInvestView includes a built-in AI assistant that can answer questions about the platform and help with common tasks.
- Click the chat icon in the bottom-right corner of any page
- Type your question — for example:
- "How do I connect to Interactive Brokers?"
- "What's my portfolio worth?"
- "Show me my dividend income this year"
- You can also import trades by typing them naturally — e.g., "Bought 10 AAPL at $190 on Jan 5"
The assistant gives context-specific help based on which page you're on. For example, if you're on the Import page, it'll offer guidance specific to importing.
Your conversation history is saved so you can pick up where you left off. You can also give feedback (thumbs up/down) on answers to help us improve.
Customize how AllInvestView looks to match your preference.
- Go to Account Settings
- Under Appearance, choose your theme:
- Premium Dark — modern fintech-style dark theme
- Premium Light — clean, modern light theme
- Classic Dark — traditional dark theme
- Default — standard light theme
- Stylish, Executive, Simple, Cyberpunk — additional options
- You can also switch between Standard and Compact display density
AllInvestView is currently available in English and Spanish, with more languages coming soon (French, German, Portuguese, Italian, Dutch, Japanese, and Chinese).
- Go to Account Settings
- Select your preferred language from the dropdown
- Save — the interface will switch to your chosen language
Control what notifications you receive from Account Settings:
Email notifications:
- All emails — master toggle to enable/disable everything
- Weekly portfolio summary — a weekly email with your portfolio value, 7-day performance, and upcoming dividends
- Earnings recap — daily emails when any of your holdings report earnings, with AI-generated summaries
- Price alert emails — triggered when your price targets are hit
In-app notifications:
- Bell icon in the top navigation shows unread notifications
- Price alert triggers
- Option expiration warnings (3 days before expiry)
- Comments on your feature requests
- Feature status updates
Push notifications: If you use the mobile app, enable push notifications in your profile to get price alert triggers on your phone.
Earn rewards by inviting friends to AllInvestView.
- Go to your Referrals page
- Copy your unique referral link
- Share it with friends — when they sign up and verify their email, you both benefit
- Track your referral stats and rewards from the dashboard
Rewards:
- Free/subscription users earn 14 days of Pro access per referred friend
- Lifetime Deal users earn 5 bonus community votes per referral
- Your tier (Bronze, Silver, Gold, Platinum) increases as you refer more people
Other ways to earn votes:
- Monthly allowance — you get votes each month automatically
- Share portfolio cards on social media
- Complete the onboarding checklist
- Leave a Trustpilot review
- Connect through a broker partner
Track your vote balance and reward history at Rewards.
The Community page shows trending stocks across AllInvestView users and lets you browse public portfolios.
- Browse and vote on public portfolios at Community Portfolios
- Compare portfolios side-by-side with the comparison tool
- Leave comments and join discussions on any public portfolio
- Click any stock to see and add comments — share insights with other users
To share your own portfolio: go to Portfolio Management and toggle it to "Public." You'll get a unique link anyone can view. Your personal financial details (exact amounts) are never shown — only percentages, allocations, and performance.
Want to explore AllInvestView without entering real data? Create a demo portfolio with sample trades to see how the dashboard, analytics, and charts work.
You can find this option during onboarding or from Portfolio Management. The demo portfolio behaves exactly like a real one — delete it anytime when you're ready to add your own investments.
AllInvestView is built on user feedback. Many of our most popular features started as community suggestions.
- Visit the Feature Requests page
- Browse existing ideas and vote on the ones you want
- Submit your own feature request with a description
- Follow the status as requests move through: Under Review → Planned → In Progress → Completed
You earn votes through monthly allowances, referrals, social sharing, and completing onboarding steps.
AllInvestView offers a free plan and several premium tiers:
- Free: 10 holdings, 1 portfolio, 5 bonds/cash items, 5-year performance history, basic AI assistant
- Starter (€7.99/mo): 25 holdings, 2 portfolios, broker sync, advanced analytics, benchmarking, 15-year history
- Advanced (€12.99/mo — most popular): Unlimited holdings, 15 portfolios, unlimited bonds/cash, 30+ year history, priority support
- Pro (€24.99/mo): Everything in Advanced plus 150 portfolios, personal setup assistance, dedicated account manager, early access to new features
- Lifetime Deal: One-time payment for permanent Advanced access — no recurring charges
All paid plans include a 14-day free trial. New accounts automatically start with a 14-day Advanced trial so you can explore everything.
Cancel anytime — no cancellation fees. You keep access until the end of your billing period.
See full details on the pricing page.
AllInvestView tracks milestones as you invest:
- Portfolio value milestones ($10K, $25K, $50K, $100K, $250K, $500K, $1M)
- Return milestones (10%, 25%, 50%, 100%)
- Dividend milestones ($100/mo, $500/mo, $1,000/mo)
- Diversification (10+ holdings, 25+ holdings)
- Anniversary milestones (1 year, 2 years tracking)
When you hit a milestone, you'll get a notification. Share it on social media with themed cards to earn bonus community votes. Check your achievements at Rewards.
Have a gift code or promotional code? Redeem it at the redemption page. Codes can unlock premium access, bonus trial days, or vote credits.
Some codes come from partner promotions, referral rewards, or special events. Each code can only be used once.
AllInvestView includes a library of free investing guides and interactive calculators:
Guides:
- Investing Guide — getting started with investing
- FIRE Guide — financial independence and early retirement
- Dividend Growth — building dividend income
- Dollar-Cost Averaging — DCA strategy explained
- Options Trading — intro to options
- Capital Gains Tax — understanding tax on investments
Calculators:
You can export your data or delete your account at any time.
- Export: Download your portfolio data and transaction history from the Reports page
- Delete: Go to Account Settings and use the account deactivation option. This permanently removes all your data.
Here's how we calculate the numbers you see in your dashboard:
- Capital Gain: Total return = Realized Return (sold positions) + Unrealized Return (held positions)
- Realized Return: Actual profit or loss from positions you've exited, accumulated chronologically
- Unrealized Return: Gain or loss from positions you currently hold
- Average Price: Weighted average of all buy transactions by quantity
- Simple Return (%): Capital Gain / Total Initial Investment x 100
- XIRR: Annualized rate of return accounting for irregular cash flows. Available with and without dividends.
Capital Return = Realized Return + Unrealized Return
Total Initial Investment = Initial Nominal of Sold Positions + Initial Nominal of Active Positions
- Realized Return %: Realized gain / initial nominal of sold positions — shows return on exited positions
Greeks tell you how sensitive an option's price is to different factors:
-
Delta (Δ): Change in option price per 1-unit change in underlying stock price
Δ = e-qT N(d1) (Call) or -e-qT N(-d1) (Put)
-
Gamma (Γ): Rate of change of Delta as the underlying price changes
Γ = [e-qT N'(d1)] / [S x σ x √T]
-
Theta (Θ): Time decay — how much value the option loses each day
Call: Θ = [-S e-qT N'(d1) σ / (2√T)] - rK e-rT N(d2) + qS e-qT N(d1)Put: Θ = [-S e-qT N'(d1) σ / (2√T)] + rK e-rT N(-d2) - qS e-qT N(-d1)
Divide Theta by 365 for daily values as shown in AllInvestView.
-
Vega (ν): Sensitivity to changes in volatility
ν = S e-qT N'(d1) √T
- Efficient Frontier: Set of portfolios offering the highest return for a given risk level (Modern Portfolio Theory)
- Correlation Matrix: Shows how assets move relative to each other — aids diversification decisions
- Volatility: Statistical measure of return dispersion. Higher = more risk, larger price swings
- Beta: How much an asset moves vs. the market. 1 = with market, >1 = more volatile, <1 = less volatile
- Sharpe Ratio: Risk-adjusted return = (Return - Risk-Free Rate) / Volatility. Higher = better
- IRR (Internal Rate of Return): Annualized rate of return on an investment
- TWR (Time-Weighted Return): Portfolio growth excluding impact of cash flows
- MWR (Money-Weighted Return): Returns accounting for timing and size of cash flows
- Dividend: Distribution of company earnings to shareholders
- Ex-Dividend Date: Cutoff date to qualify for a dividend
- Record Date: Date the company determines eligible shareholders
- Payment Date: Date the dividend is paid
- P/E Ratio: Share price / earnings per share
- Yield: Income return on an investment (interest or dividends)
- Forex (FX) Rate: Exchange rate between two currencies
- Portfolio Diversification: Mixing investments to reduce overall portfolio risk
- Equity: Ownership interest in a business — stock
- Bond Duration: Sensitivity of bond price to interest rate changes (in years)
- Convexity: Curvature in the bond price-yield relationship
- Cash Account: Tracks cash transactions — deposits, withdrawals, stock trades, dividends
- Transaction Currency: Currency in which the trade is recorded
- Stock Currency: Currency in which the stock is quoted on its exchange
- CAGR: Compound Annual Growth Rate — smoothed annual return over a period
- Maximum Drawdown: Largest peak-to-trough decline in portfolio value
- Cost Basis: Original value of an investment for tax purposes
- Implied Spread: The difference between a bond's YTM at purchase and the risk-free benchmark rate on the trade date — represents the credit premium
- Theoretical Price: Bond price calculated from yield curve data (benchmark rate + implied spread), as opposed to a live market quote
- Benchmark Curve: Risk-free government yield curve used as reference: Bank of Canada (CAD), US Treasury (USD), ECB (EUR), UK Gilt (GBP)
- Yield to Maturity (YTM): Total annual return if a bond is held until maturity, accounting for coupon payments, purchase price, and time value
- FIFO (First In, First Out): Sell your oldest shares first — the most common method worldwide
- LIFO (Last In, First Out): Sell your newest shares first
- Average Cost: Use the weighted average price of all shares as cost basis
- Wash Sale: Selling at a loss and buying the same stock within 30 days — the loss may not be tax-deductible
- Capital Loss Carryforward: Losses carried to future tax years to offset gains
- Holding Period: How long you've held an asset — determines short-term vs long-term tax rates
- Withholding Tax: Tax deducted at source on dividends or interest, especially on cross-border payments
- Franking Credit: Australian tax credit for company tax already paid (imputation credit)
- CGT Discount: Australian 50% capital gains discount for assets held over 12 months
Still need help?
Can't find what you need? Try the AI assistant for instant answers, or reach out to our team — we usually reply within 24 hours.