When will you need the money?
Money you need within five years has no business being all in stocks. Every all-stock example here fell at least 33% at some point, and after the 2022 fall they took about two years to get back to their old high.
The classic example is the 60/40 portfolio: 60% in an S&P 500 fund, 40% in a US bond fund. $10,000 put into it in January 2019 was worth $22,629 on 22 October 2026, and at its worst it was down 20.9%. Here are 18 examples like it, from one fund to All Weather and income mixes, each run on the same real fund prices, so you can weigh what it earned against how far it fell.
Each dot is one example, Jan 2019 to Oct 2026
Most of the difference between these portfolios is how much is in stocks. These three answers tell you roughly how much yours should hold.
Money you need within five years has no business being all in stocks. Every all-stock example here fell at least 33% at some point, and after the 2022 fall they took about two years to get back to their old high.
Picture $100,000 dropping to $66,000. That's what the S&P 500 fund did in March 2020. If that would have made you sell, look further left on the chart: at their worst, the 60/40 would have been at about $79,000 and the Permanent Portfolio at about $82,000.
Then look at the income mixes: bonds, dividend funds, property and cash. In 2022 the conservative income portfolio lost 8.8% and the retirement income one 9.2%, against 18.2% for the S&P 500 fund. Property swings more: the REIT portfolio lost 22.0%.
Each card shows the mix by asset class, the funds used, and what $10,000 did from January 2019 to 22 October 2026. Open one for the fund-by-fund breakdown, who it suits and its trade-offs.
The whole market in as few funds as possible.
Pure exposure to the S&P 500, about 500 of the largest US companies.
Own the entire global stock market in proportion to market capitalisation.
The simplest diversified portfolio using just three index funds.
The traditional balanced portfolio split between stocks and bonds.
Gold, long bonds and cash next to stocks, so no single crash sinks the whole thing.
Ray Dalio's risk-parity approach designed to perform in any economic environment.
Equal allocation across five asset classes for all-weather stability.
Harry Browne's simple four-way split designed for any economic condition.
Dividends, interest and rent you can live on, with less riding on the stock market.
Focus on companies with long histories of growing dividend payments.
Designed to generate steady income while preserving capital in retirement.
Maximise income with capital preservation as the primary goal.
Concentrated exposure to real estate through publicly traded REITs.
Staggered bond maturities for predictable income and interest rate protection.
Mostly or all stocks, tilted toward growth, small companies, quality or tech.
Maximum growth potential for investors with long time horizons and high risk tolerance.
Optimised for Financial Independence, Retire Early (FIRE) seekers.
Buy quality stocks and hold them for 10+ years without touching them.
Concentrated exposure to technology and innovation sectors.
A filter or a shape on top of the usual mix.
Invest in companies meeting Environmental, Social, and Governance standards.
Combine ultra-safe and ultra-aggressive assets with nothing in the middle.
Sort by any column. Every row starts with $10,000 on 2 January 2019, reinvests dividends and is rebalanced to its weights each January.
| Mix | |||||||
|---|---|---|---|---|---|---|---|
| S&P 500 Index Portfolio | 100% | $34,392 | 17.2% | −34.0% | −18.2% | −34.0% | |
| Total World Market Portfolio | 100% | $27,958 | 14.1% | −34.2% | −18.0% | −34.1% | |
| Three-Fund Portfolio | 80% | $25,079 | 12.5% | −28.0% | −17.5% | −28.0% | |
| 60/40 Classic Portfolio | 60% | $22,629 | 11.0% | −20.9% | −16.0% | −20.9% | |
| All-Weather Portfolio | 30% | $16,736 | 6.8% | −23.7% | −19.2% | −5.8% | |
| Golden Butterfly Portfolio | 40% | $20,003 | 9.3% | −18.8% | −12.9% | −13.1% | |
| Permanent Portfolio | 25% | $19,062 | 8.6% | −17.6% | −12.6% | −5.9% | |
| Dividend Growth Portfolio | 90% | $24,833 | 12.4% | −29.2% | −8.8% | −29.2% | |
| Retirement Income Portfolio | 30% | $16,116 | 6.3% | −17.4% | −9.2% | −17.2% | |
| Conservative Income Portfolio | 25% | $14,800 | 5.2% | −14.2% | −8.8% | −12.2% | |
| Real Estate REIT Focus Portfolio | 25% | $17,848 | 7.7% | −33.7% | −22.0% | −33.2% | |
| Bond Ladder Portfolio | 0% | $10,653 | 0.8% | −21.3% | −13.5% | +6.1% | |
| Aggressive Growth Portfolio | 100% | $29,130 | 14.7% | −34.0% | −23.4% | −34.0% | |
| FIRE Portfolio | 75% | $24,322 | 12.1% | −30.3% | −18.4% | −30.3% | |
| Coffee Can Portfolio | 100% | $29,746 | 15.0% | −33.4% | −19.1% | −33.4% | |
| Tech Growth Portfolio | 100% | $47,472 | 22.1% | −41.9% | −36.4% | −29.4% | |
| ESG / Sustainable Portfolio | 80% | $25,366 | 12.7% | −28.4% | −16.0% | −28.4% | |
| Barbell Strategy PortfolioFrom Oct 2021 | 40% | $15,342 | 8.9% | −21.6% | −17.4% | n/a |
The barbell starts on 20 October 2021, the day after its bitcoin futures fund began trading; over that same stretch the 60/40 made 7.6% a year.
Nearly eight years, with a crash in 2020, a year in 2022 when stocks and bonds fell together, and a long run up for US stocks.
It isn't a strict ranking. The Permanent Portfolio, 25% in stocks, beat the All Weather's 30% on both return and worst fall. The REIT portfolio fell almost as far as the S&P 500 with a quarter in stocks, and the all-Treasury bond ladder fell 21.3% while making 0.8% a year.
Rates rose fast and long bonds fell with stocks. The All Weather, which holds 40% in long Treasuries, lost more that year than the plain 60/40. In the 2020 crash the same bonds did their job: from 19 February to 23 March it lost just 5.8%.
Both hold a big slice of gold (25% and 20%), and both had their best calendar year since 2019 in 2025, when the gold fund rose 64%. That's the point of them: something in the mix that doesn't move with stocks.
The three-fund mix at closing prices on 22 October 2026, bought in whole shares.
| Fund | Target | Amount | Price | Shares | Cost | Weight |
|---|---|---|---|---|---|---|
| VTIUS total stock market | 60% | $15,000 | $374.90 | 40 | $14,996.00 | 60.1% |
| VXUSInternational stocks | 20% | $5,000 | $82.73 | 60 | $4,963.80 | 19.9% |
| BNDUS total bond market | 20% | $5,000 | $71.36 | 70 | $4,995.20 | 20.0% |
| Total | 100% | $25,000 | $24,955.00 | 100% |
Divide, then round down. $15,000 at $374.90 is 40.01 shares, so 40. The $45 left over sits as cash, or goes in with fractional shares where your broker sells them.
The weights land within 0.1 points of 60/20/20. Close enough; nobody needs to chase the last decimal.
Check it once a year. When a fund drifts about 5 points off its target, sell some of the winner or put new money into the laggard. The rebalancing calculator works out the trades.
Give each asset class in AllInvestView the weight from the example you chose, and it shows how far each one has drifted from live prices. When it's time to rebalance, it lists the buys and sells, with or without selling, and can estimate the tax on each sell from your own capital gains rules. Hold the funds at more than one broker and one set of targets still covers them all.
Try the rebalancing calculator AllInvestView
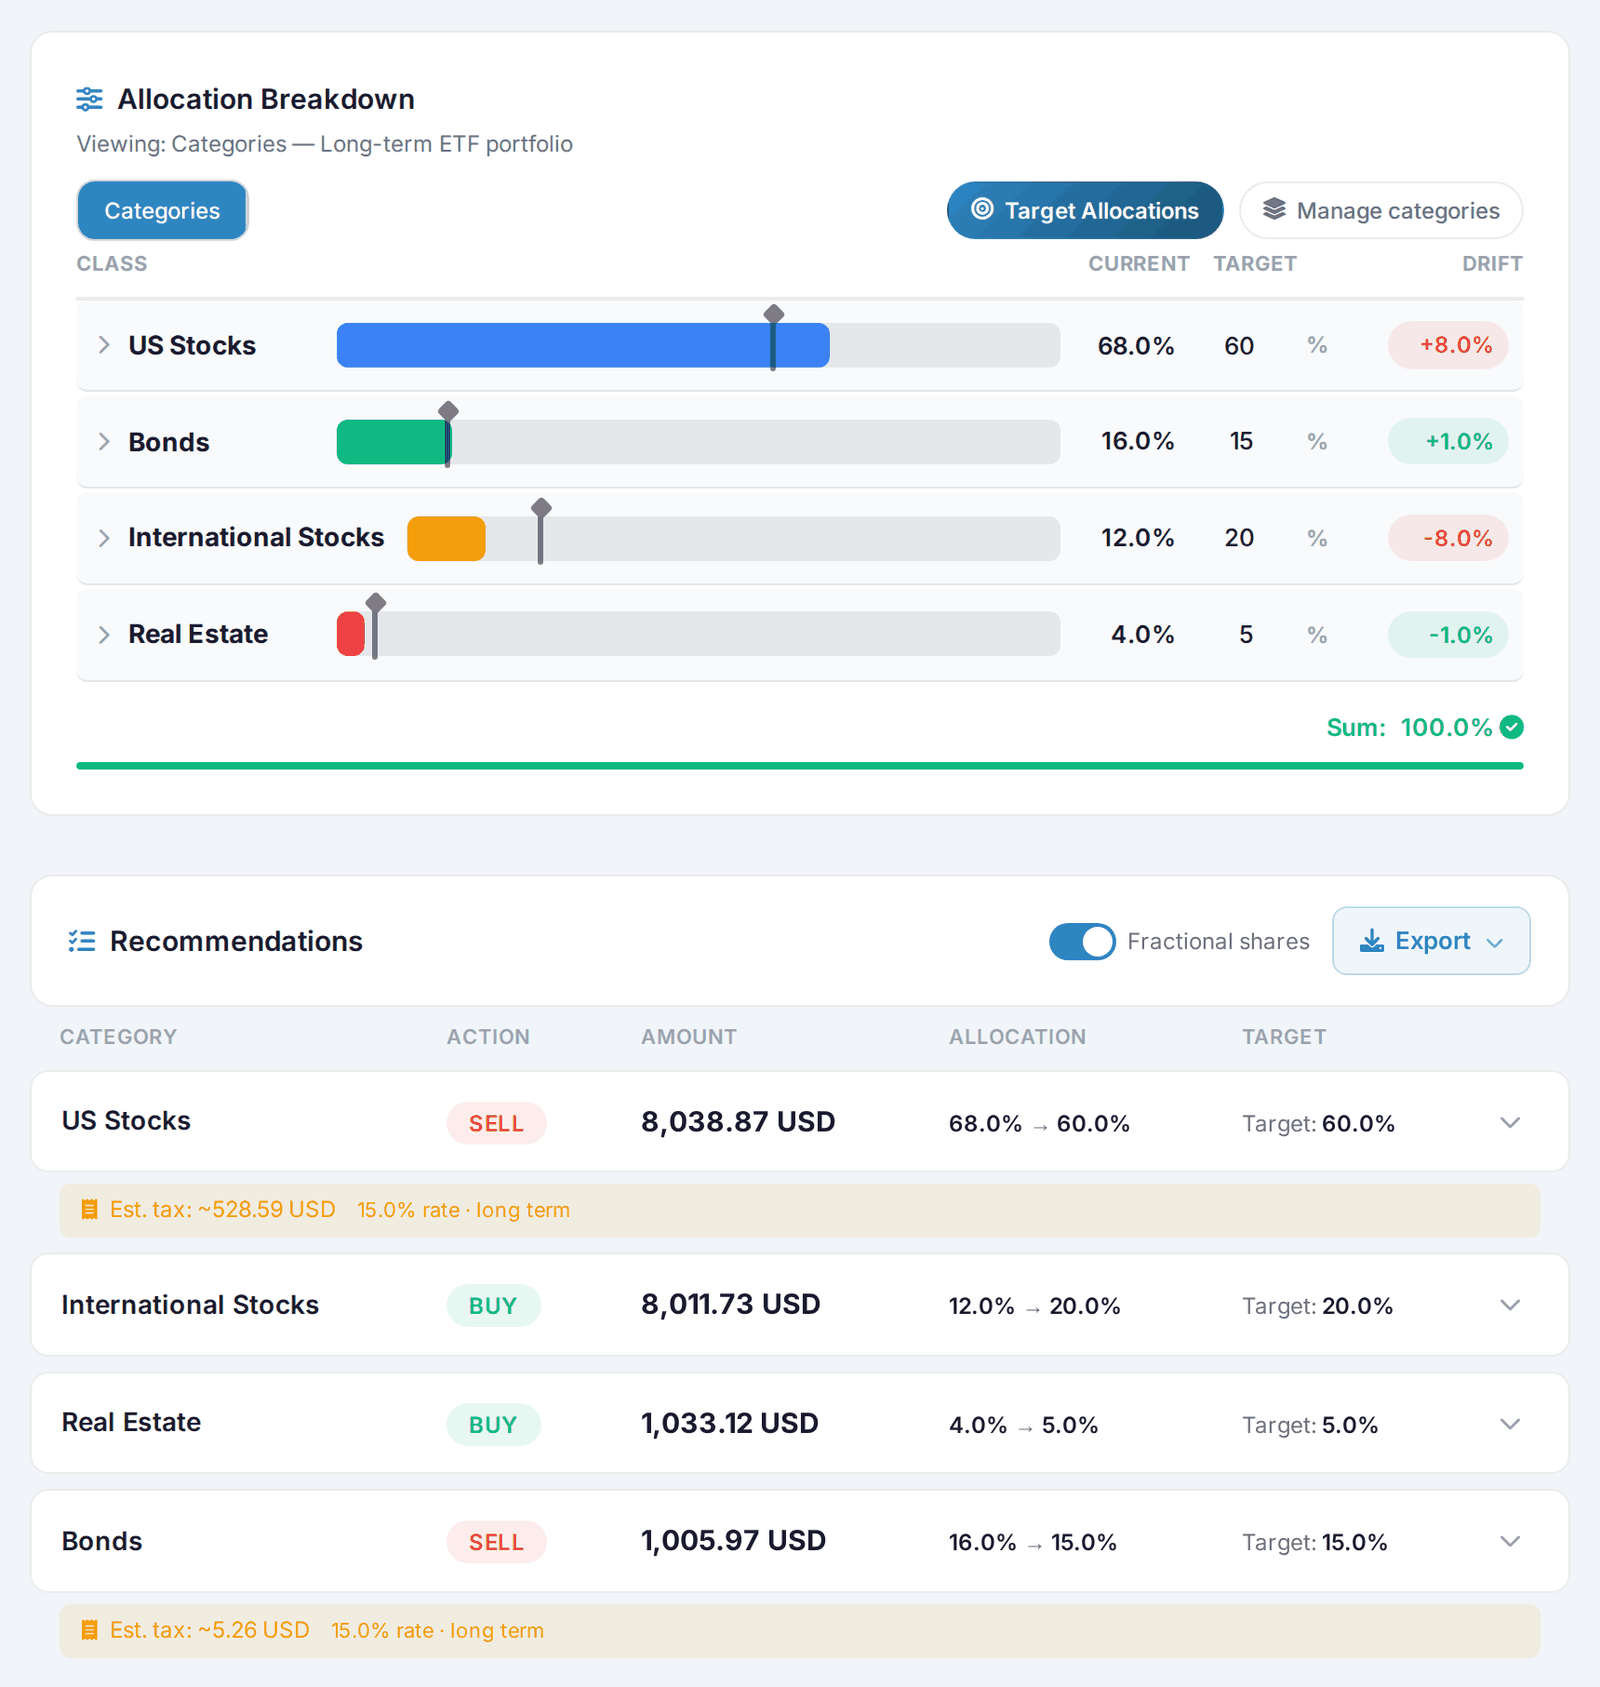
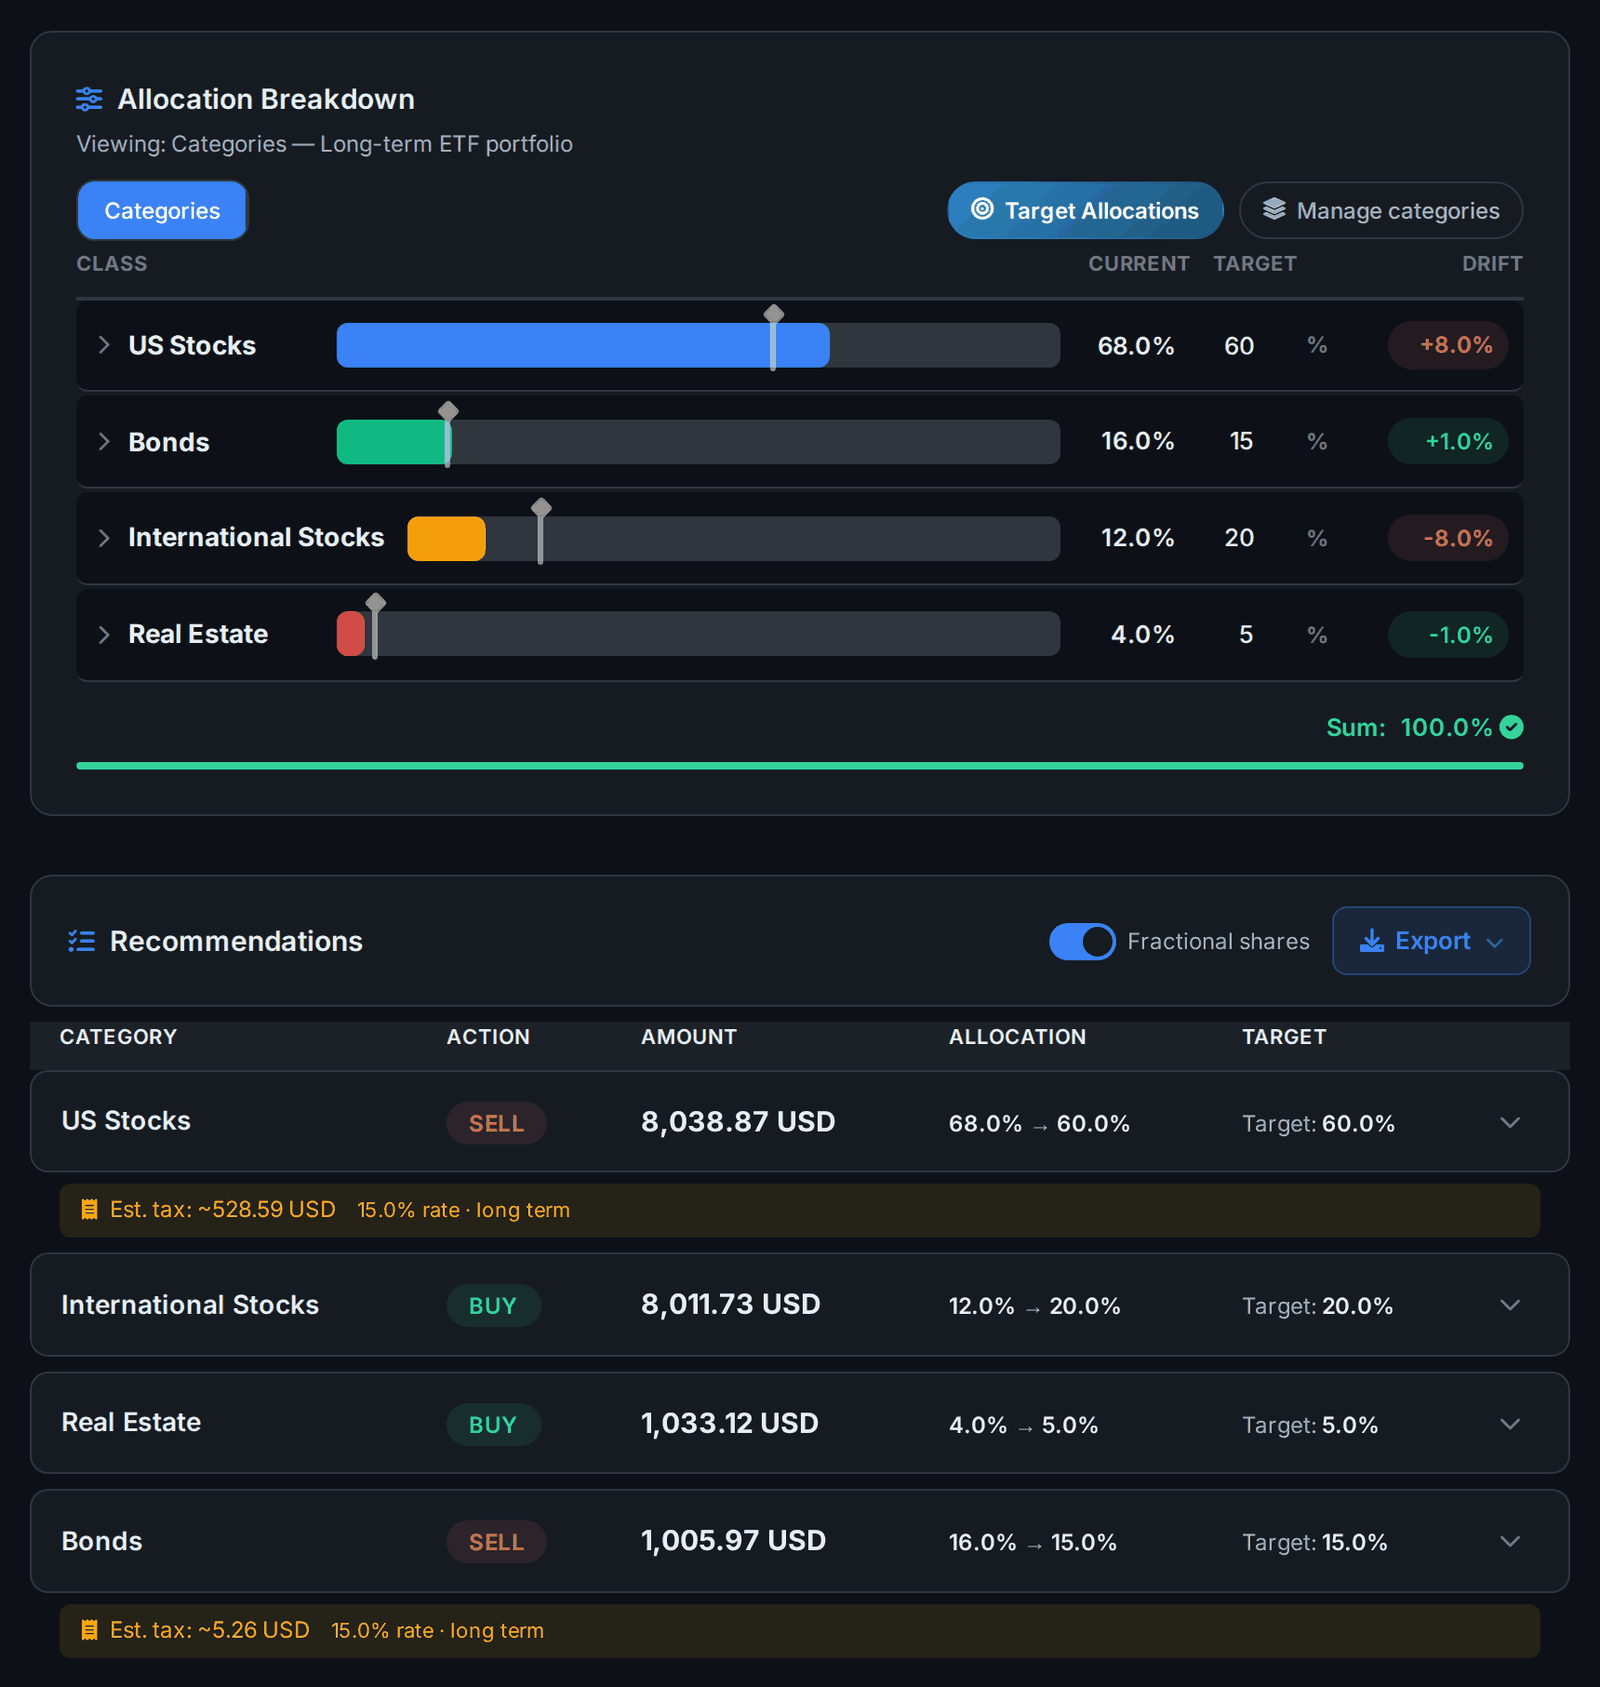
Sync or import your brokers and AllInvestView shows the whole portfolio in one place: the mix against your targets, the return, the dividends and, when you sell, the tax.
The three-fund portfolio: 60% in a US total stock market fund, 20% in an international stock fund and 20% in a US bond fund, for example VTI, VXUS and BND. $10,000 put into it in January 2019 and rebalanced once a year was worth $25,079 on 22 October 2026. Its worst fall on the way was 28.0%, in the March 2020 crash.
60% stocks and 40% bonds, the classic balanced mix. With an S&P 500 fund and a US bond fund, $10,000 from January 2019 grew to $22,629 by 22 October 2026, about 11.0% a year. It fell 20.9% at its worst, against 34.0% for the S&P 500 fund on its own.
The tech growth portfolio: $10,000 became $47,472, or 22.1% a year. It also fell the most, 41.9% from its high, and lost 36.4% in 2022 alone. Of the ones that hold bonds, the ESG mix did best at $25,366, with the three-fund portfolio close behind at $25,079.
From the market high on 19 February 2020 to the low on 23 March, the All Weather lost 5.8% and the Permanent Portfolio 5.9%, against 34.0% for the S&P 500 fund. 2022 was different, because bonds fell with stocks: the All Weather lost 19.2% that year, more than the 60/40, while the conservative income and dividend growth mixes lost 8.8%.
Very little. One share each of VTI, VXUS and BND cost $528.99 on 22 October 2026, and many brokers sell fractional shares, so you can split any amount across the funds by percentage. With whole shares, $25,000 buys 40 VTI, 60 VXUS and 70 BND and leaves $45 in cash.
Write down the target weight of each fund, buy them in that mix, and check once a year how far each has drifted. Download any example here as a spreadsheet with the drift formulas in it, or set the weights as targets in AllInvestView, which shows the drift from current prices across every account you hold.
Each example uses the funds listed on it. The test runs on daily closing prices in US dollars with dividends reinvested on the day they went ex-dividend, before tax, with no trading costs; fund fees are already in the prices. Every portfolio starts with $10,000 on 2 January 2019 (the barbell on 20 October 2021, the day after its bitcoin futures fund began trading) and ends on 22 October 2026. All are rebalanced to their weights on the first trading day of each year, except the Coffee Can, which is never rebalanced by design. Worst fall is the largest drop from a previous high in daily values. Feb to Mar 2020 is the change from 19 February to 23 March 2020. The three-fund build uses closing prices on 22 October 2026. Past returns don't tell you future ones, and none of this is a recommendation to buy a particular fund.