Ranked on real dividends, not forecasts

Highest Dividend Yield Stocks (November 2026)

The top dividend yield on this list right now is 14.43%, from Mandatum Oyj. The 50 stocks below, all on major exchanges, yield between 10.64% and 14.43%: the dividends a share earned over the last 12 months, divided by today's price. Before you buy one for the income, look at how far its price fell and how many payments make up the yield.

Updated 16 November 2026 Listed in 10 countries See the income on any amount
12.06%median yield of the 50
34 of 49trade lower than a year ago
8paid just once in the last 12 months
5pay every month

The 50 highest dividend yields

Open any stock for its full dividend history, price chart and fundamentals.

# Company Dividend yield Paid on 10,000 Payments, 1 year Price, 1 year Price Sector
1
Mandatum OyjMANTA.HE · listed in Finland
14.43% 1443 1 −8.6% 5.89 EUR Financial Services
2
Innovative Industrial Properties, Inc.IIPR · listed in United States
14.33% 1433 4 +9.5% 53.02 USD Real Estate
3
Evolution Petroleum CorporationEPM · listed in United States
14.33% 1433 4 −21.4% 3.35 USD Energy
4
WhiteHorse Finance, Inc.WHF · listed in United States
14.29% 1429 5latest −32% +17.3% 8.26 USD Financial Services
5
Ellington Financial Inc.EFC · listed in United States
14.04% 1404 12 −19.1% 11.11 USD Financial Services
6
The Western Union CompanyWU · listed in United States
13.95% 1395 4 −23.7% 6.74 USD Financial Services
7
Danske Bank A/SDANSKE.CO · listed in Denmark
13.89% 1389 2latest −64% +25.9% 371.40 DKK Financial Services
8
Gentherm IncorporatedTHRM · listed in United States
13.65% 1365 2 −18.6% 29.08 USD Consumer Cyclical
9
TCG BDC, Inc.CGBD · listed in United States
13.54% 1354 4 −6.7% 11.08 USD Financial Services
10
Flowers Foods, Inc.FLO · listed in United States
13.49% 1349 4latest −50% −51.4% 5.53 USD Consumer Defensive
11
Trinity Capital Inc.TRIN · listed in United States
13.45% 1345 12 +19.8% 17.70 USD Financial Services
12
AMERISAFE, Inc.AMSF · listed in United States
13.44% 1344 4 −53.1% 19.50 USD Financial Services
13
Frontline Ltd.FRO · listed in United States
13.16% 1316 4latest +231% +84.3% 46.97 USD Energy
14
12.87% 1287 4 −15.0% 10.18 USD Financial Services
15 12.75% 1275 1 +63.5% 4,980.00 HUF Energy
16
Icade SAICAD.PA · listed in France
12.66% 1266 1 −27.3% 15.17 EUR Real Estate
17
SLR Investment Corp.SLRC · listed in United States
12.40% 1240 4latest −24% −24.2% 11.61 USD Financial Services
18
TELUS CorporationTU · listed in United States
12.28% 1228 4latest −55% −41.4% 8.53 USD Communication Services
19 12.24% 1224 3 −5.9% 8.98 EUR Industrials
20
Central Asia Metals plcCAML.L · listed in United Kingdom
12.20% 1220 2 −22.4% 127.00p Basic Materials
21
Inmobiliaria Colonial, SOCIMI, S.A.COL.MC · listed in Spain
12.16% 1216 2 −3.2% 5.10 EUR Real Estate
22
Banco Bradesco S.A.BBD · listed in United States
12.14% 1214 17 −30.2% 2.57 USD Financial Services
23
BB Seguridade Participacoes S.A.BBSE3.SA · listed in Brazil
12.14% 1214 2 +10.5% 37.33 BRL Financial Services
24
Barings BDC, Inc.BBDC · listed in United States
12.11% 1211 4 −3.9% 8.59 USD Financial Services
25
Oaktree Specialty Lending CorporationOCSL · listed in United States
12.08% 1208 4 −10.6% 12.16 USD Financial Services
26
Gladstone Commercial CorporationGOOD · listed in United States
12.04% 1204 12 −11.0% 9.97 USD Financial Services
27
International Seaways, Inc.INSW · listed in United States
11.98% 1198 4latest +135% +94.9% 105.23 USD Industrials
28
FLEX LNG Ltd.FLNG · listed in United States
11.77% 1177 4 −3.4% 25.48 USD Energy
29
Global Net Lease, Inc.GNL · listed in United States
11.55% 1155 4 −17.1% 6.58 USD Real Estate
30
BW LPG LimitedBWLPG.OL · listed in Norway
11.54% 1154 4latest +64% +63.1% 211.00 NOK Industrials
31
Companhia Energetica de Minas GeraisCIG · listed in United States
11.48% 1148 6latest −69% −9.0% 1.92 USD Utilities
32
Hafnia LimitedHAFNI.OL · listed in Norway
11.47% 1147 4latest +176% +39.7% 91.15 NOK Industrials
33
Impax Asset Management Group plcIPX.L · listed in United Kingdom
11.45% 1145 2 −54.6% 87.30p Financial Services
34
MAHLE Metal Leve S.A.LEVE3.SA · listed in Brazil
11.45% 1145 4latest +26% −6.2% 31.61 BRL Consumer Cyclical
35
Orkla ASAORK.OL · listed in Norway
11.34% 1134 1 +3.3% 105.80 NOK Consumer Defensive
36
Rithm Capital Corp. Common StockRITM · listed in United States
11.15% 1115 4 −19.3% 8.97 USD Real Estate
37
Okeanis Eco Tankers Corp.OET.OL · listed in Norway
11.04% 1104 4latest +240% n/a 821.00 NOK Industrials
38
Golub Capital BDC, Inc.GBDC · listed in United States
11.00% 1100 4 −9.5% 12.54 USD Financial Services
39
Kaufman & Broad S.A.KOF.PA · listed in France
11.00% 1100 1 −30.7% 20.00 EUR Industrials
40
SES S.A.SESG.PA · listed in France
10.96% 1096 2 −9.8% 4.56 EUR Communication Services
41
Genco Shipping & Trading LimitedGNK · listed in United States
10.90% 1090 5latest +147% +48.9% 26.14 USD Industrials
42
Metropole Television S.A.MMT.PA · listed in France
10.87% 1087 1 −4.8% 11.50 EUR Communication Services
43
Ladder Capital CorpLADR · listed in United States
10.82% 1082 4 −20.6% 8.50 USD Real Estate
44
Kimbell Royalty Partners, LPKRP · listed in United States
10.76% 1076 5latest −82% +12.5% 15.52 USD Energy
45
FinVolution GroupFINV · listed in United States
10.74% 1074 1 −52.3% 2.85 USD Financial Services
46
Credit Agricole S.A.ACA.PA · listed in France
10.74% 1074 2 −3.1% 15.84 EUR Financial Services
47
Monro, Inc.MNRO · listed in United States
10.69% 1069 4 −39.8% 10.48 USD Consumer Cyclical
48
Fidus Investment CorporationFDUS · listed in United States
10.66% 1066 4 −1.7% 19.41 USD Financial Services
49
Capital Southwest CorporationCSWC · listed in United States
10.66% 1066 12 +12.7% 23.45 USD Financial Services
50
Vallourec S.A.VK.PA · listed in France
10.64% 1064 1 +15.6% 19.27 EUR Basic Materials

Showing all 50. "Paid on 10,000" is what that amount in the stock earned in dividends over the last 12 months, in the stock's own currency, before tax. "Latest" compares the most recent payment with the usual one before it, where they differ by 20% or more.

Why these yields are so high

The same arithmetic, worked on two stocks from today's list.

The price fell

The same dividend on a cheaper share looks like a bigger yield

AMERISAFE, Inc.AMSF · No. 12 on the list

AMERISAFE, Inc. paid 2.62 USD a share in 4 payments over the last 12 months. A year ago the shares cost 41.57 USD, so that money would have been a 6.3% yield. The price has since fallen 53.1% to 19.50 USD, and the same payments now show as 13.44%.

34 of the 49 stocks here trade lower than a year ago. A falling price often means the market expects the dividend to be cut.

One payment

8 of the 50 paid only once in the last year

Mandatum OyjMANTA.HE · No. 1 on the list

Their whole yield rests on a single payment. Mandatum Oyj paid 0.85 EUR a share once, which is 14.43% of today's price of 5.89 EUR.

Plenty of European companies pay once a year, so one payment can be normal. A one-off special dividend counts the same way, though, and it won't come back next year. The company's own results say which it was.

How often they pay

Payments in the last 12 months

5Monthly28Quarterly9Two or three times8Once

US companies mostly pay every quarter, UK companies often twice a year, and many in continental Europe once. Monthly payers suit anyone living on the income.

Tick "Paid 4 or more times" above to keep only the stocks that paid at least four times.

Four checks before you buy a high yielder

1

Why did the price fall?

A yield that doubled because the share price halved is a warning, not a bargain. Read the latest results before you buy.

2

Was it one payment?

A single special dividend makes a big trailing yield that won't repeat. Count the payments in the table.

3

Is it covered?

A payout ratio under about 80% of earnings leaves room. Property companies and lenders are better judged on cash flow or net investment income.

4

Was it just cut?

A trailing yield still counts the payments from before a cut. Kimbell Royalty Partners, LP's latest payment was 82% below its usual one, so if it stays there, its yield will fall as the older payments drop out.

Once you own a few

See what your dividends really pay you

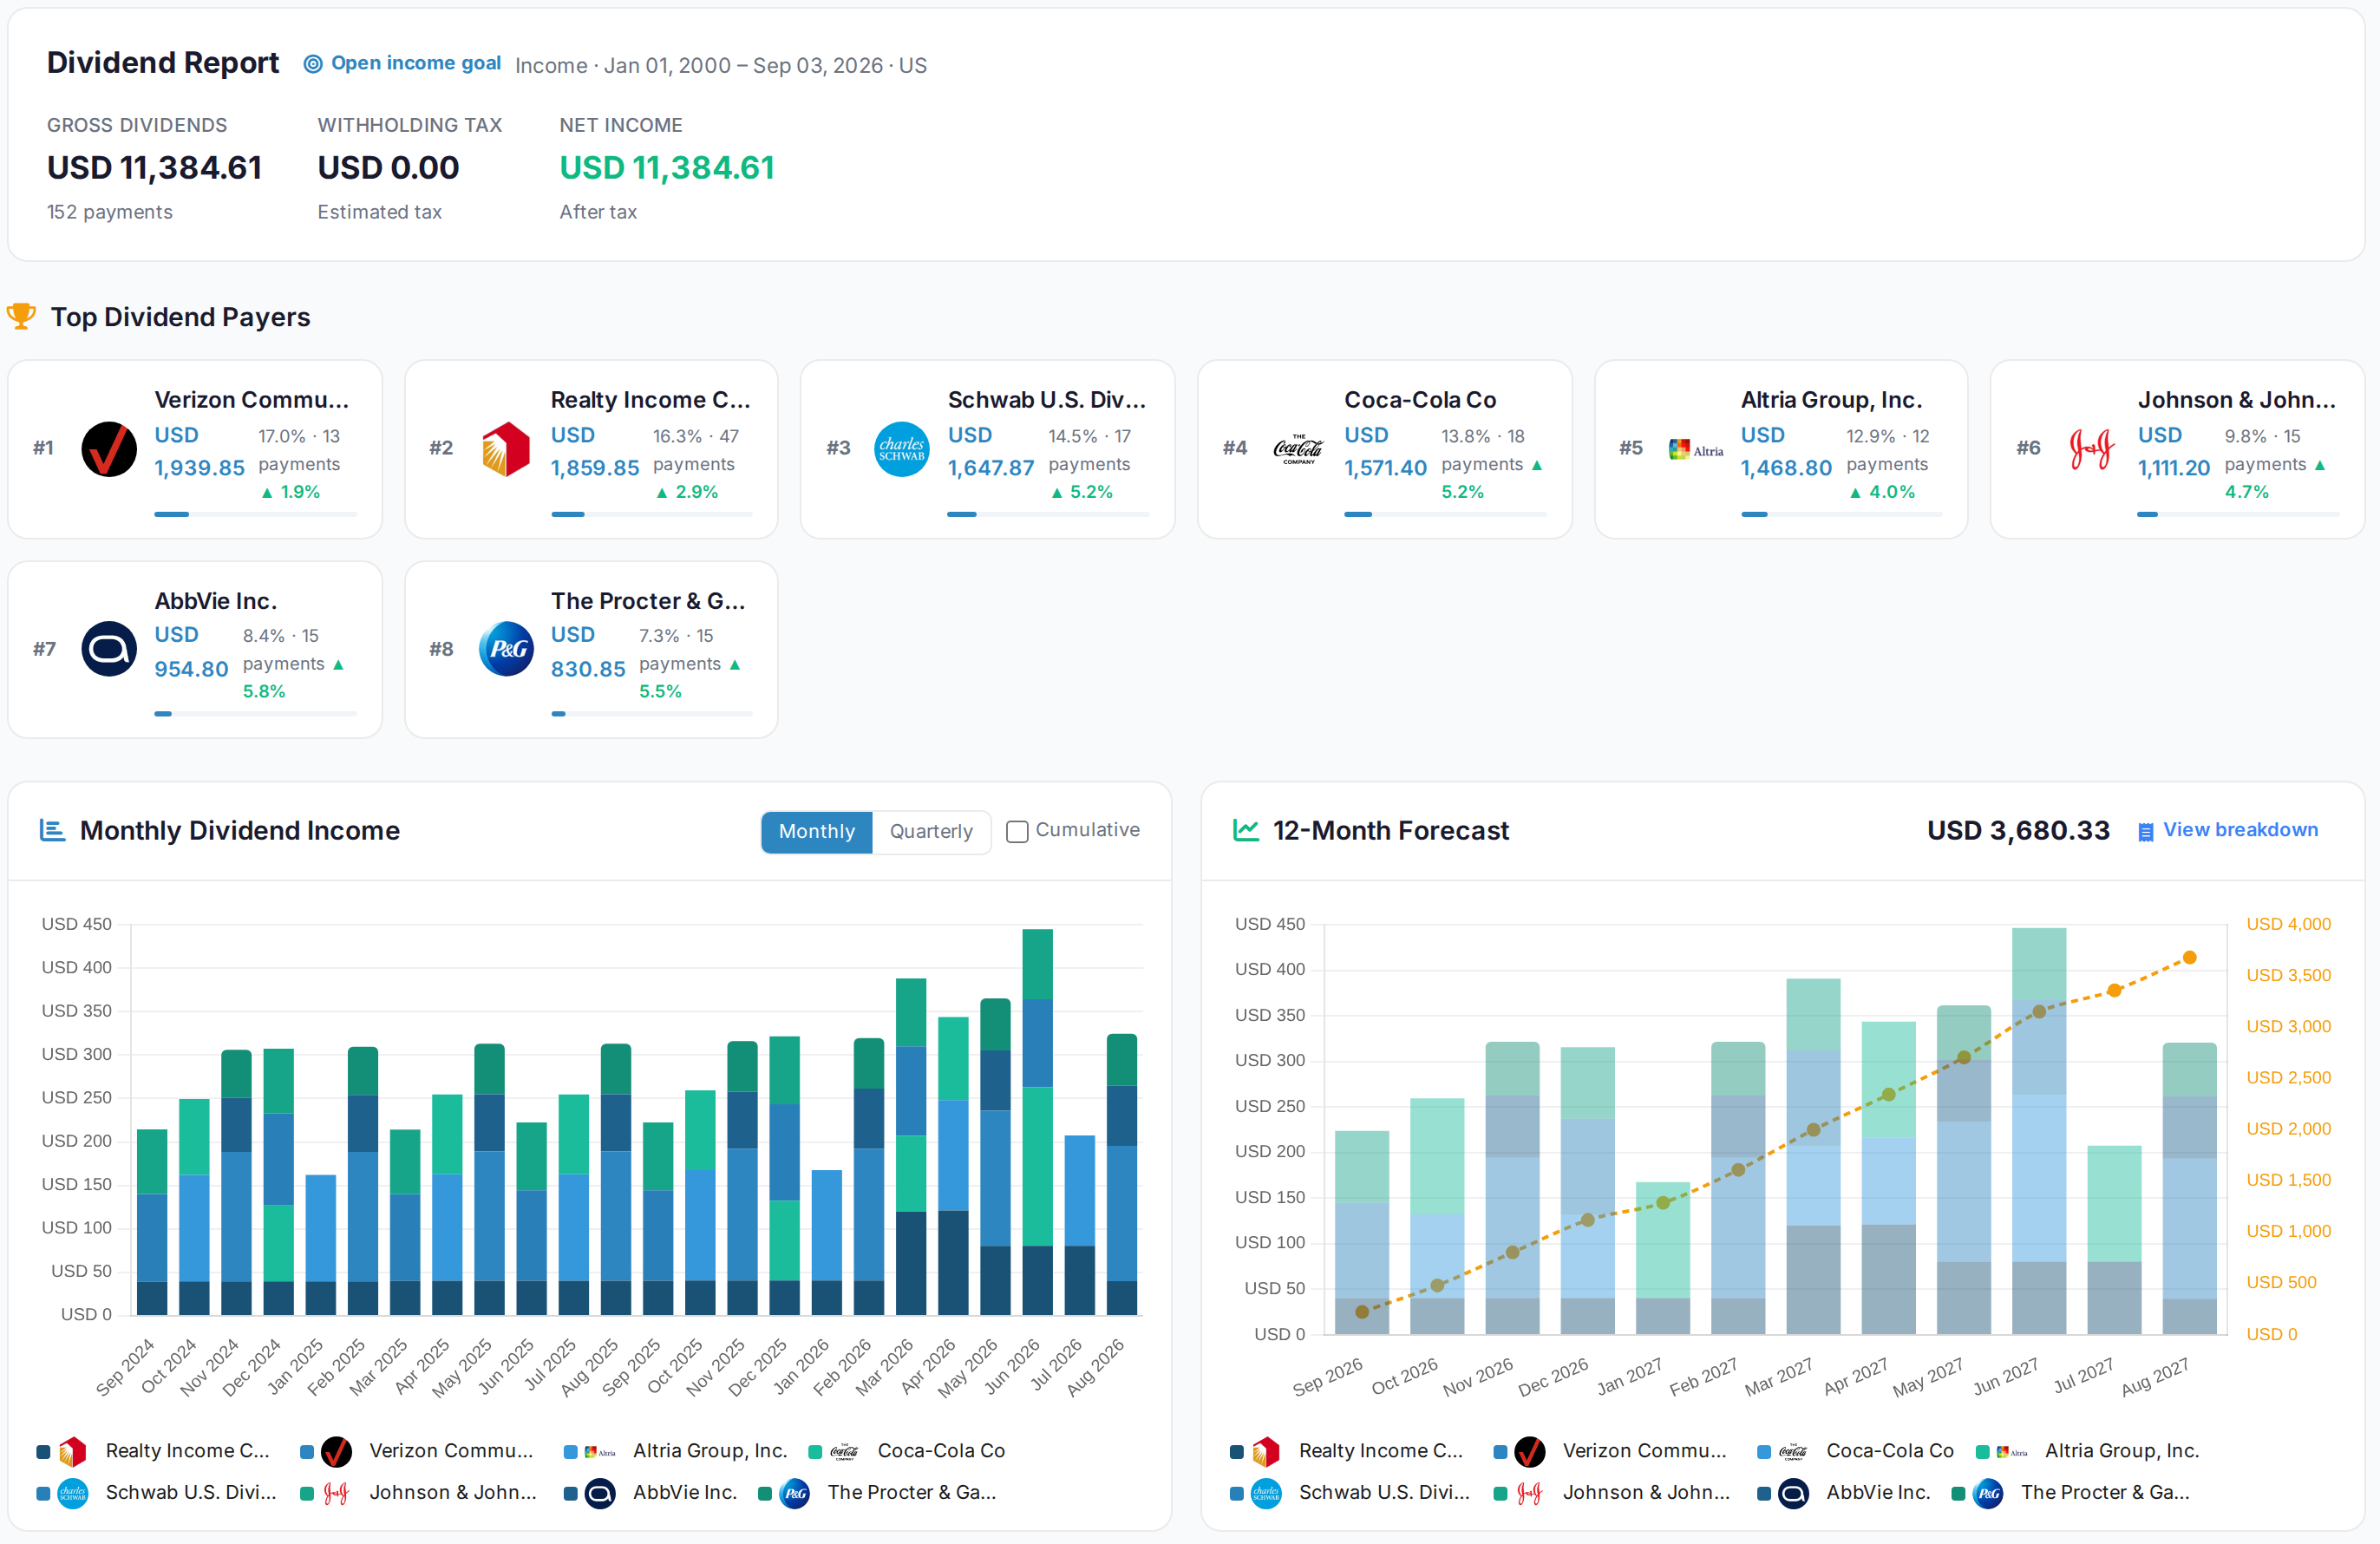
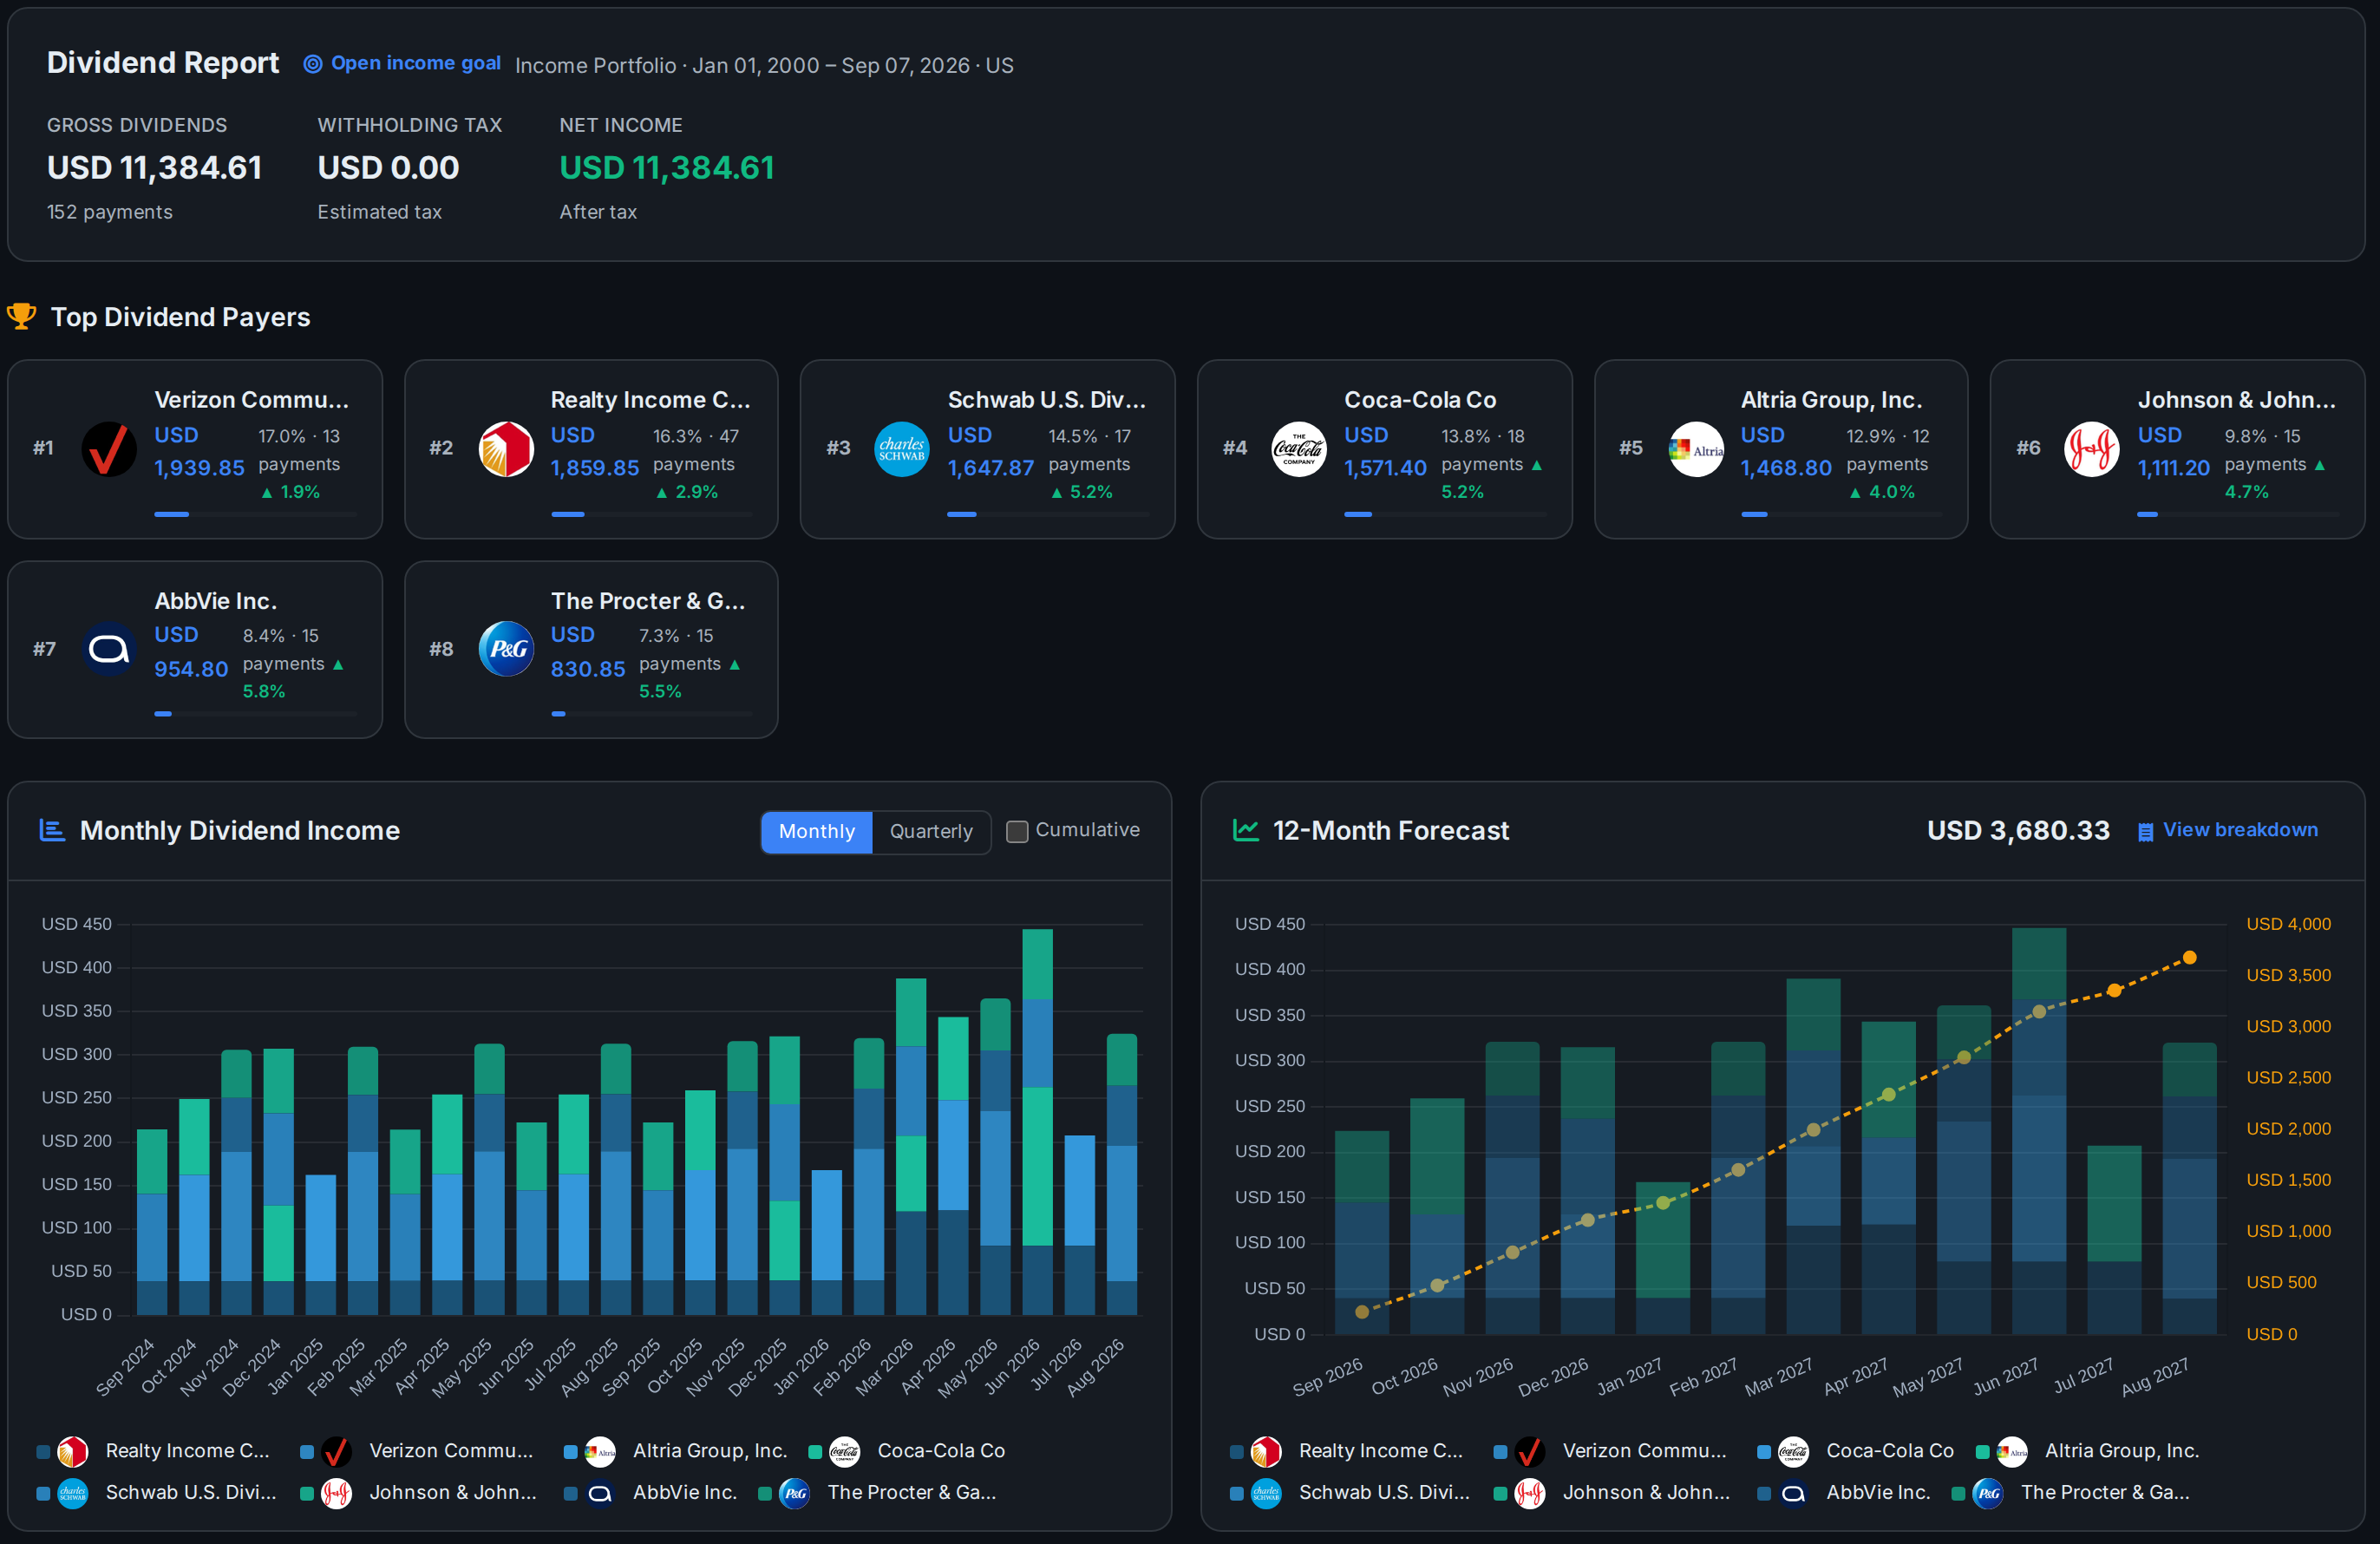
AllInvestView adds up every dividend across your accounts: gross, the tax withheld at source and what reached you. It shows your top payers with how fast each one's dividend has grown, your income month by month, and a forecast for the next 12 months.

See the dividend tracker
AllInvestView AllInvestView dividend report for a demo income portfolio: gross dividends, withholding tax and net income over 152 payments, the top dividend payers each with a growth rate, monthly dividend income by payer, and a 12-month forward income forecast of 3,680.33 USD AllInvestView dividend report for a demo income portfolio: gross dividends, withholding tax and net income over 152 payments, the top dividend payers each with a growth rate, monthly dividend income by payer, and a 12-month forward income forecast of 3,680.33 USD
The dividend report on a demo income portfolio of eight US dividend stocks and ETFs: income after withholding, the top payers with their growth rates, the monthly history and the 12-month forecast.View full-size View full-size
After you buy

Track your dividend income across every broker

Sync or import your accounts and AllInvestView shows every payment, the tax withheld on each, and what the next 12 months should bring.

Dividend calendar and forecast Withholding tax by payment Free for up to 10 holdings

Questions about high dividend yields

Which stock has the highest dividend yield right now?

On this list, on 16 November 2026, it was Mandatum Oyj (MANTA.HE) at 14.43%. It paid 0.85 EUR a share over the last 12 months, against a price of 5.89 EUR. The 50 stocks here yield from 10.64% to 14.43%, and the list updates every day. Yields above 15% are left out, because they usually come from a collapsing share price or a data error.

What is a good dividend yield?

A good dividend yield typically ranges from 2% to 6%. Yields above 6% may indicate elevated risk or an unsustainable payout. Always check the payout ratio and earnings stability before investing for income.

Are high dividend yield stocks safe?

Not necessarily. Very high yields can result from a falling stock price rather than rising dividends. Look for consistent dividend growth, a payout ratio below 80%, and stable earnings.

How often are dividends paid?

Most US companies pay dividends quarterly. UK companies typically pay semi-annually, while some European and Asian companies pay annually. REITs and some funds may pay monthly.

How is the dividend yield on this list worked out?

It's the cash dividends a share went ex-dividend for over the last 12 months, special dividends included, divided by today's price. Payments made before a stock split are scaled to today's shares. A stock needs at least two payments in the last 24 months, one of them in the last 12, and a yield between 1% and 15%. ETFs, mutual funds, investment trusts and preferred shares are left out, and a company that trades on several exchanges appears once.

Why is the yield here different from the one my broker shows?

Many brokers and quote sites show a forward yield: the latest regular dividend multiplied out over a year, divided by the price. This list uses what was actually paid in the last 12 months. The two differ when a company has just raised or cut its dividend, or paid a one-off special.

How the list is built

Dividend yield here is the cash dividends per share with an ex-dividend date in the last 12 months, special dividends and other cash distributions included, divided by the latest price, before any tax. Payments made before a stock split are scaled to today's shares. A stock is listed when it trades on a major exchange, is followed by at least three analysts, has a price worth at least 1 US dollar and a recent closing price, paid at least twice in the last 24 months and at least once in the last 12, and yields between 1% and 15%. ETFs, mutual funds, investment trusts, preferred shares and listings with market data still under review are left out, as is any stock whose history shows one payment stored twice. A company listed on several exchanges appears once, on its highest-yielding listing. Price over 12 months compares the latest price with the close a year earlier, adjusted for splits. The list is rebuilt every day.

This is a ranking by one number, not a recommendation to buy any stock.