The Multi-Account Problem
If you hold investments across multiple brokers, you know the pain. One account with your domestic broker for local stocks, another for international equities, a third for retirement, maybe a crypto exchange or two. Each broker shows you a slice of your portfolio, but none shows you the full picture.
The consequences go beyond inconvenience:
- No unified P&L: You cannot see your total returns across all accounts without a spreadsheet
- Hidden concentration risk: You might be overweight in a sector or currency without realising it
- Tax reporting headaches: Capital gains and dividend income are scattered across multiple statements
- No overall performance metric: What is your actual annualized return (XIRR) across everything? No single broker can tell you
The Spreadsheet Trap
Many investors start with a spreadsheet. It works for a while, but quickly breaks down as you add accounts, currencies, corporate actions, and dividend reinvestments. A purpose-built tracker handles all of this automatically.
The Combined Portfolio Solution
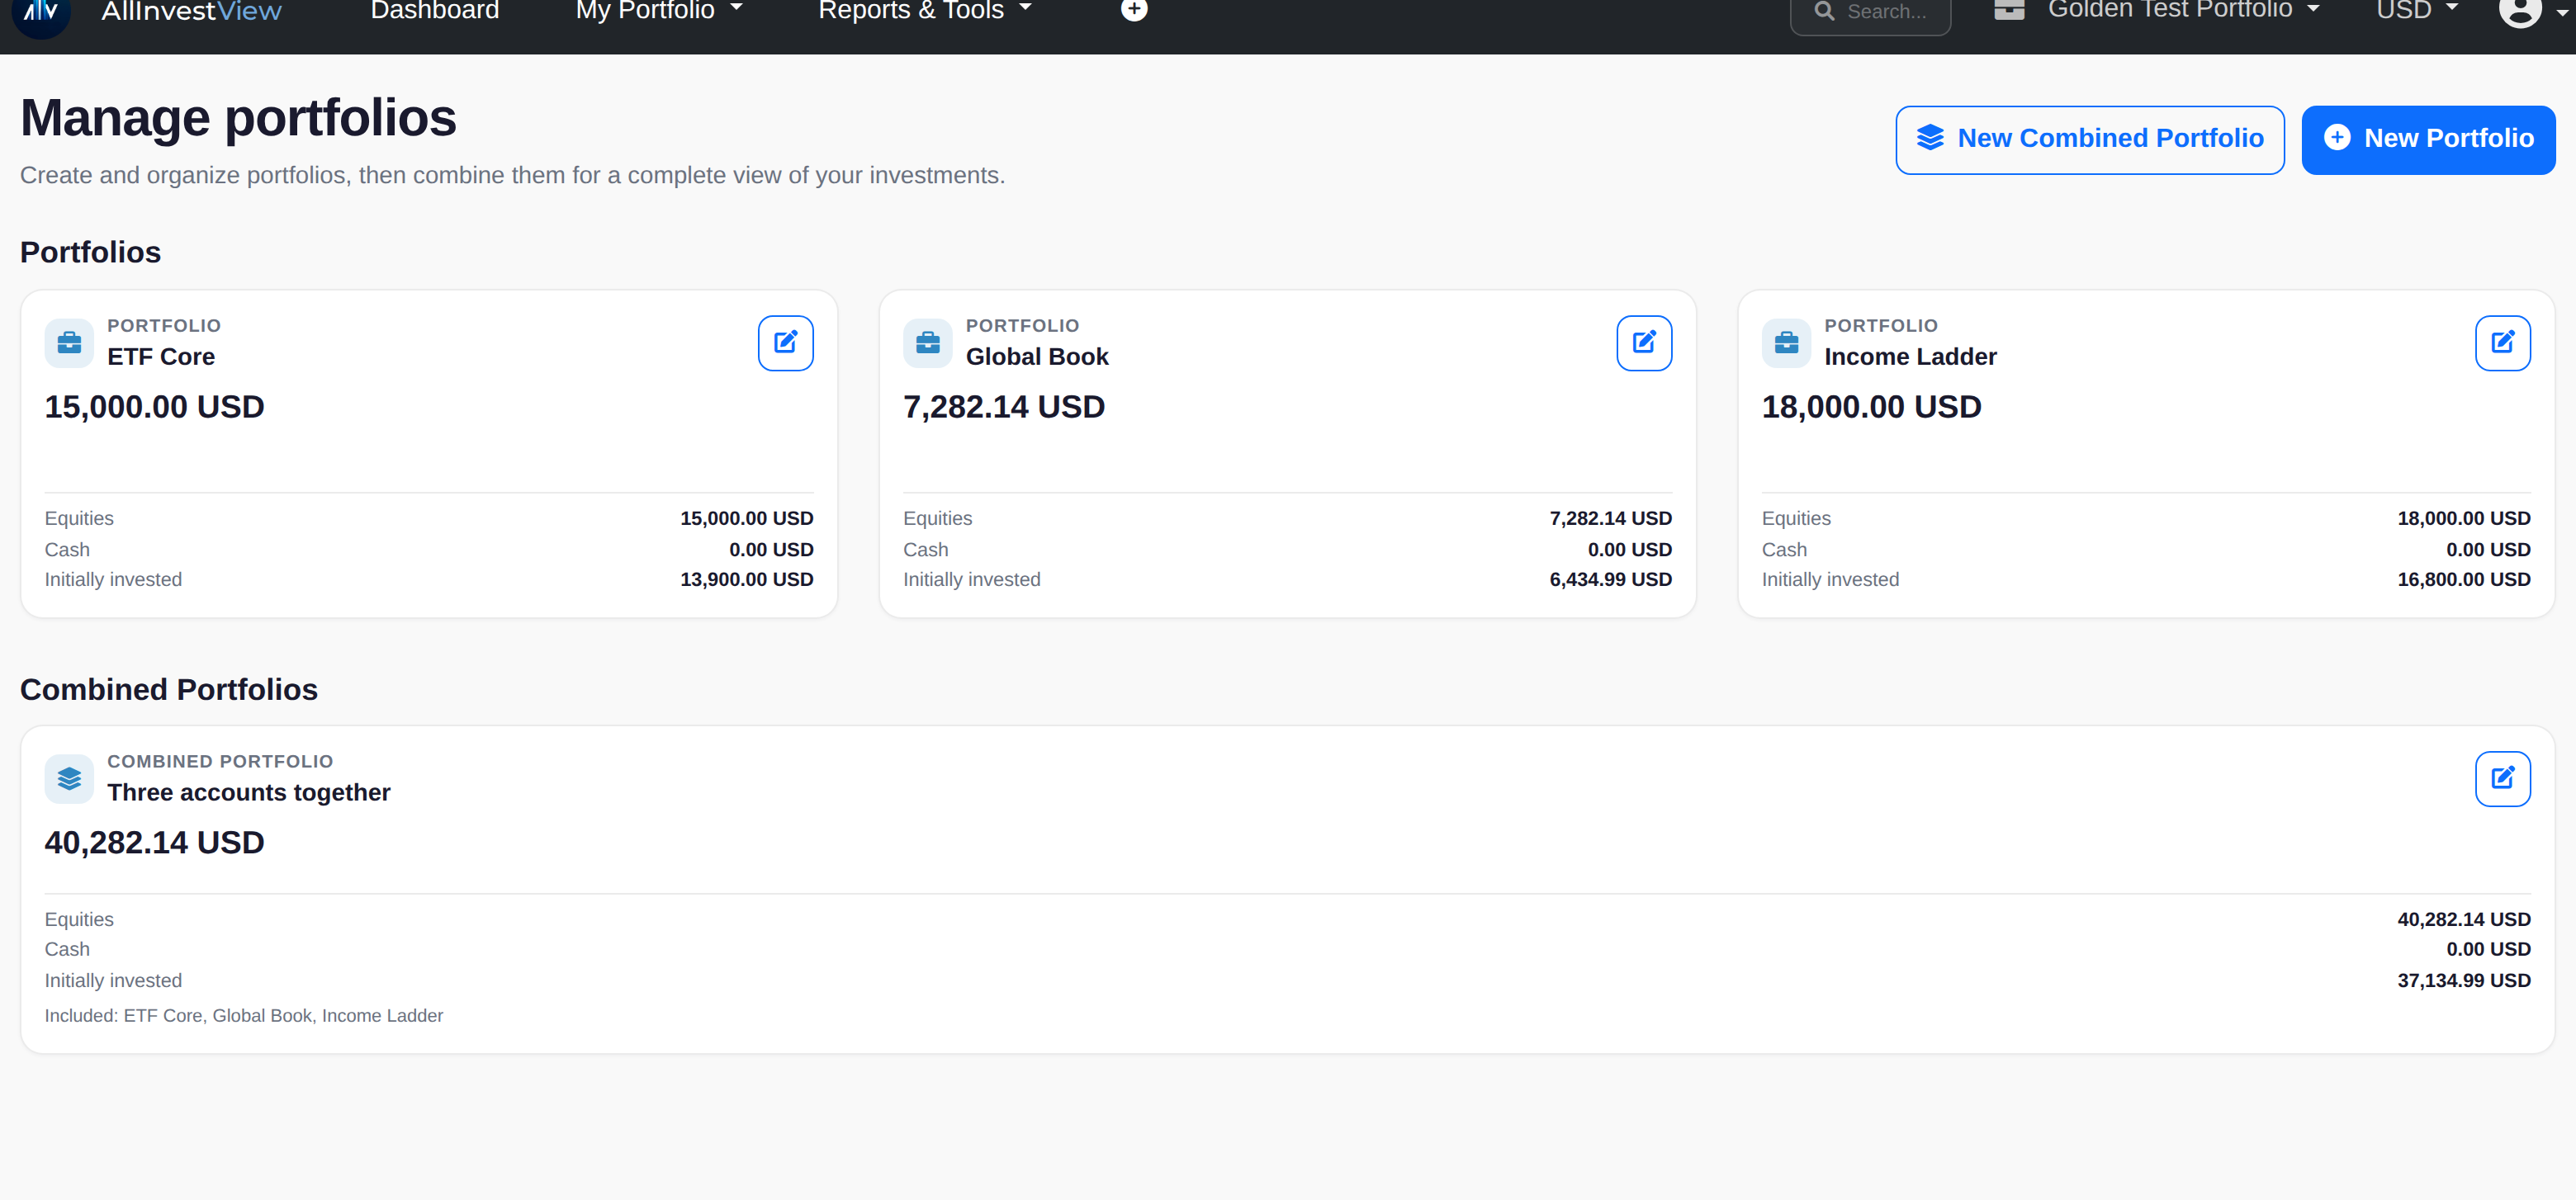
AllInvestView lets you create a separate portfolio for each broker account and then combine them into a single unified dashboard. Here is how it works:
Create Portfolios
Create one portfolio per broker account. Name them so they are easy to identify (e.g., "Zerodha", "DEGIRO", "Schwab IRA").
Import Trades
Import trades via CSV, automatic broker sync, or manual entry. Each portfolio stays independent.
Combine
Use the Combined Portfolio feature to merge any selection of portfolios into one unified view with aggregated metrics.
 AllInvestView
 AllInvestView

Your individual portfolios remain fully intact. You can switch between the combined view and any individual portfolio at any time. Filter, analyse, and drill down into each account whenever you need to.
Flexible Combinations
You can create multiple combined portfolios for different purposes. For example, one that combines all accounts for your total net worth, and another that combines only your taxable accounts for tax planning.
What You Get with a Combined View
When you activate a combined portfolio, the dashboard aggregates data from all constituent portfolios and calculates everything as if it were a single account:
XIRR & CAGR
Measure annualized growth across your combined portfolio with XIRR and CAGR, then drill into individual holdings to understand their returns.
Realized & Unrealized Gains
See a clear breakdown of profit already booked (realized gains from sold positions) versus paper profit still open (unrealized gains), across all accounts.
Allocation Analysis
Sector, geographic, and asset class breakdowns across your entire portfolio. Spot concentration risks that are invisible when accounts are viewed separately.
Consolidated Tax Reports
Generate tax reports covering all your accounts with FIFO, LIFO, or average cost basis. Short-term and long-term gain classification included.
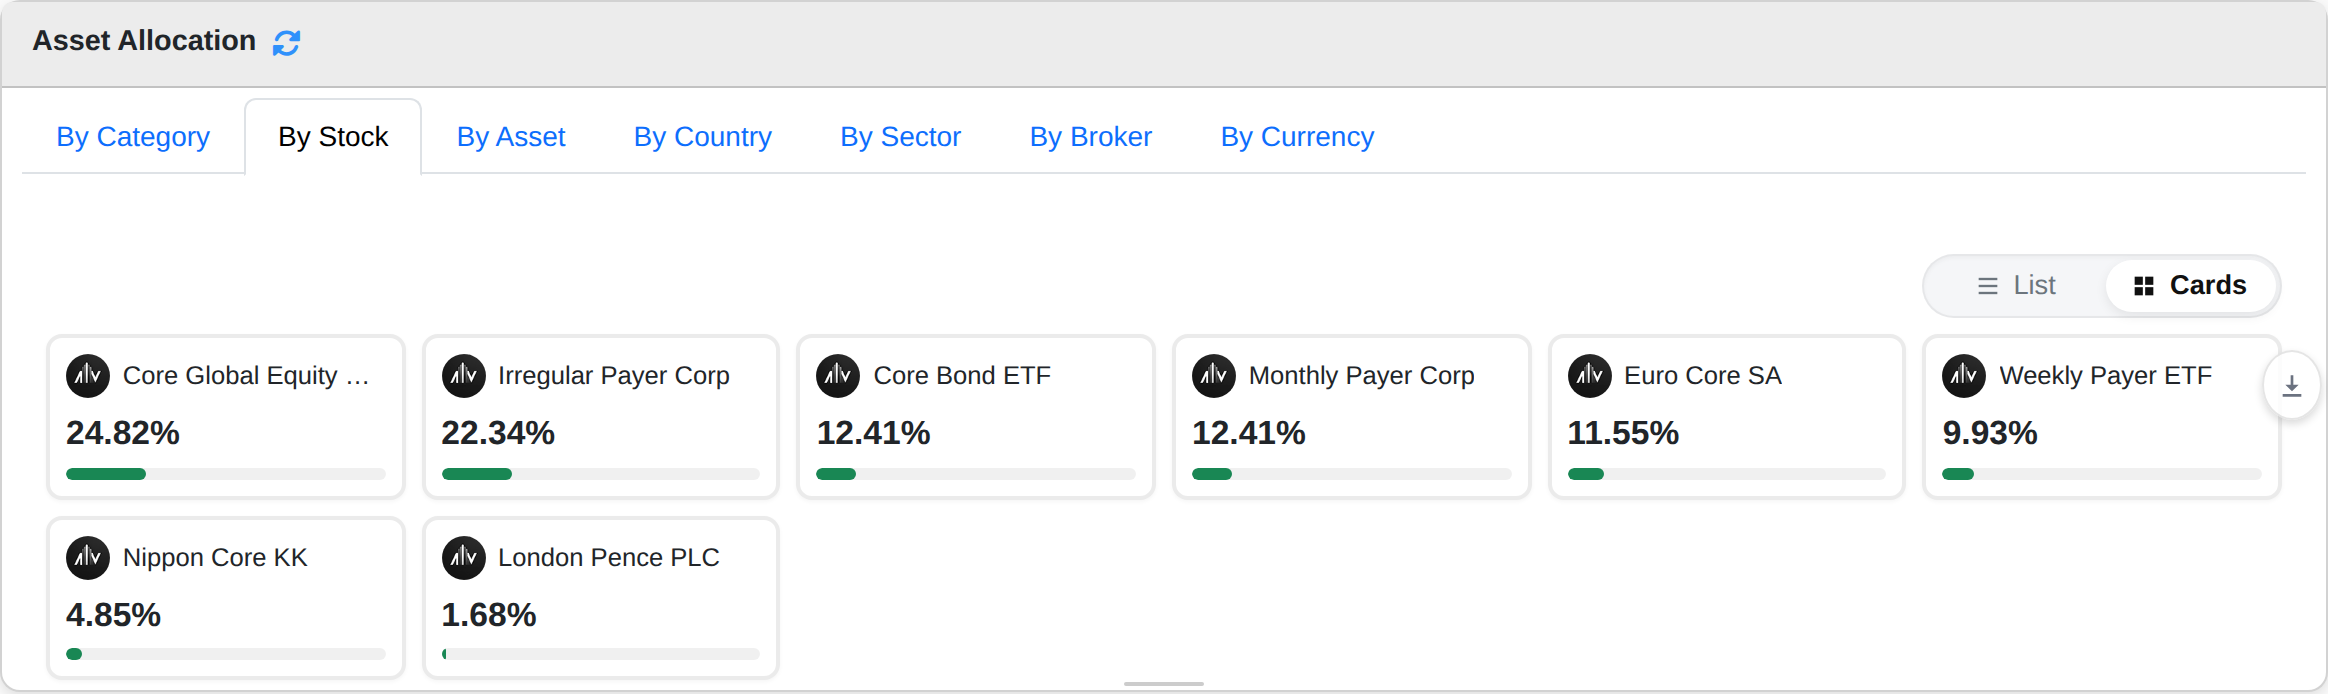
Concentration you cannot see one account at a time
Weights by stock, asset, country, sector, broker and currency across everything you hold. A position that looks modest in two accounts on their own can be your largest single holding once they are added together.
AllInvestView
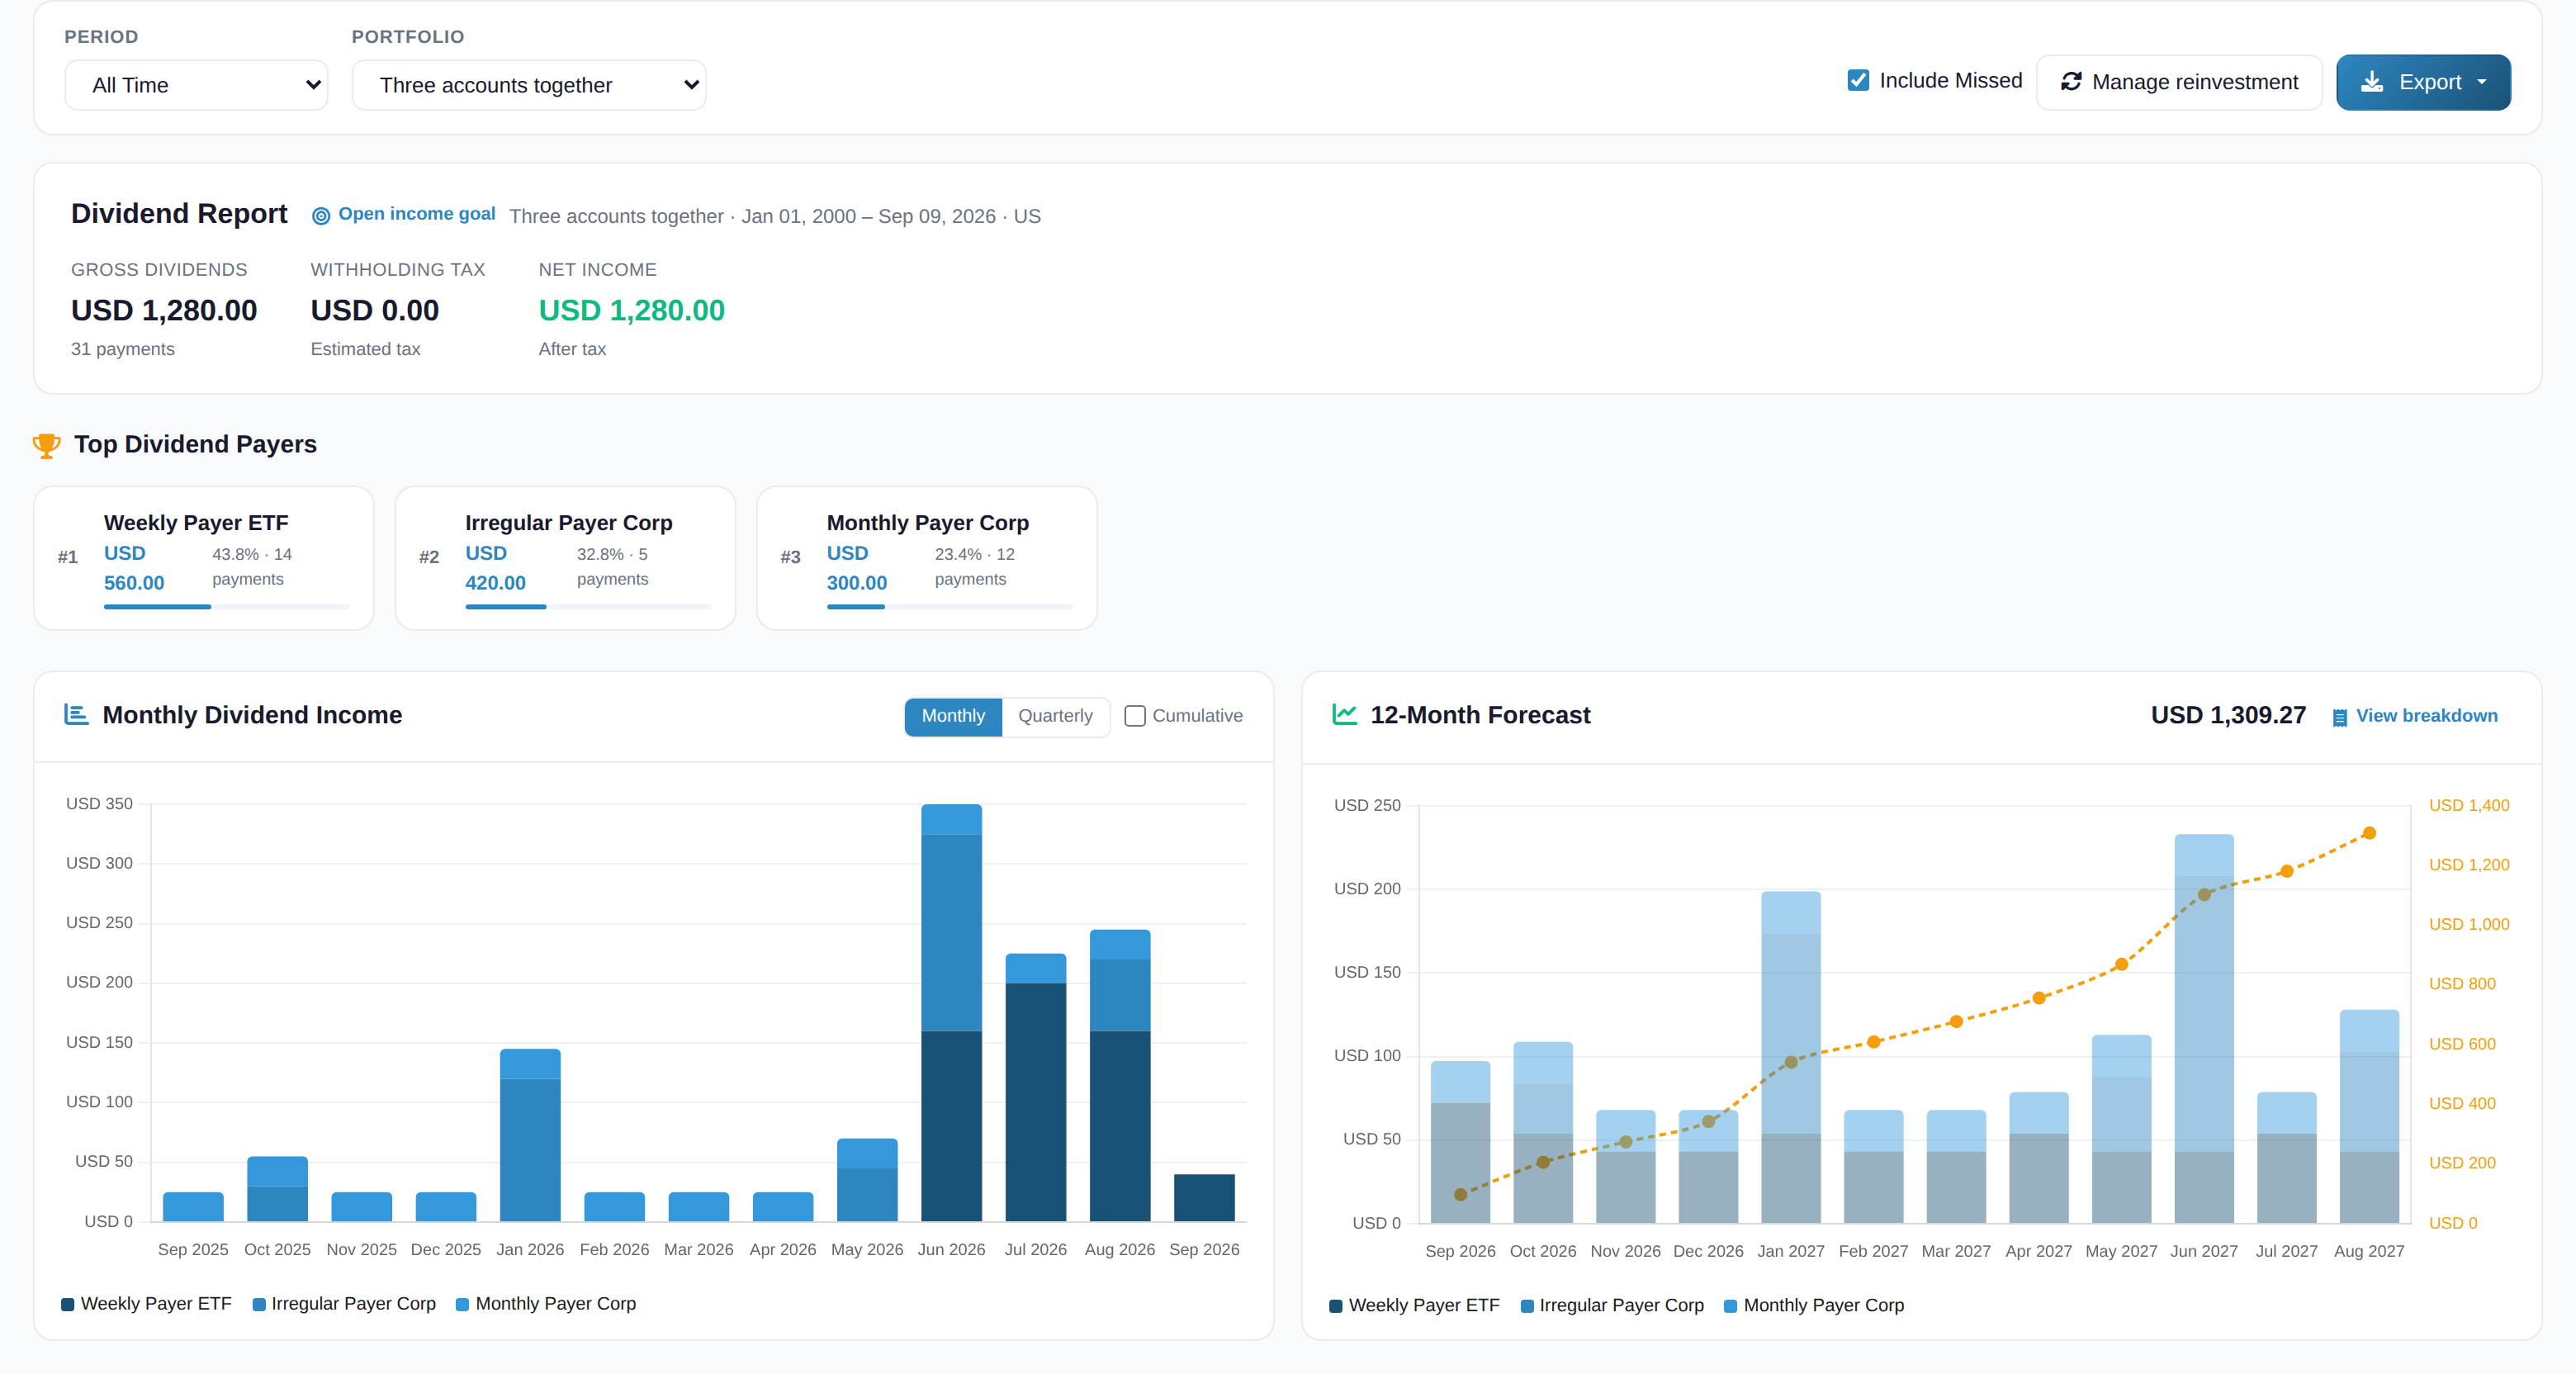
Every payment, whichever broker it landed in
Income from all your accounts in one place, with the payers ranked by what they send you and the months laid out ahead. No adding up separate statements to answer one question.
AllInvestView
Additional Analytics
Beyond the basics, the combined dashboard also gives you:
- Dividend tracking: Total dividend income across all brokers with projected annual income and payment calendar
- Benchmark comparison: Put your combined portfolio next to a market benchmark instead of judging each account on its own
- Risk metrics: Sharpe Ratio, Alpha, Beta, and Value at Risk across your full portfolio
- Monte Carlo simulation: Project future outcomes for your combined holdings
- Correlation matrix: See how holdings across different accounts interact
Importing Your Data
AllInvestView offers three ways to get your trade data in, depending on your broker:
Automatic Broker Sync
For 30+ supported brokers, connect your account with a secure, read-only connection. Trades sync automatically, keeping your portfolio up to date between visits.
| Region | Supported Brokers (examples) |
|---|---|
| US / Canada | Interactive Brokers, Schwab, Fidelity, Robinhood, Webull Canada, Wealthsimple |
| Europe | DEGIRO, Trading 212, AJ Bell, BUX, eToro |
| India | Zerodha, Upstox |
| Australia | Stake, CommSec |
CSV Import
For brokers not yet supported for auto-sync, including several Indian brokers (Groww, Angel One) and the European neobrokers (Trade Republic, Scalable Capital), you can export a CSV from your broker and import it into AllInvestView. The platform auto-detects 10+ broker CSV formats and handles currency conversion automatically.
Any Broker, Any Country
AllInvestView covers 200,000+ assets across 80+ stock exchanges in 50+ currencies. Even if your broker is not on the auto-sync list, you can import via CSV or enter trades manually. If your broker provides a trade history export, it will almost certainly work.
Manual Entry
Add individual trades with autocomplete search across all supported assets. Useful for occasional trades or for assets that are not in a CSV export.
Frequently Asked Questions
Can I track Indian Demat accounts on AllInvestView?
Yes. AllInvestView supports automatic sync for Zerodha and Upstox. For Groww, Angel One, and other Indian brokers, you can import trades using our CSV import feature or enter them manually. AllInvestView supports stocks listed on the NSE and BSE exchanges with INR currency.
Does AllInvestView calculate XIRR for my portfolio?
Yes. AllInvestView calculates XIRR (money-weighted annualized return) for your entire portfolio and for each individual holding. It also shows CAGR, Sharpe Ratio, Alpha, and Beta, so you get a complete picture of risk-adjusted performance.
Can I see realized and unrealized gains separately?
Yes. The dashboard displays unrealized gains on open positions and realized gains on closed positions separately. The tax report provides a full transaction-level breakdown with short-term vs long-term classification, cost basis details, and gain percentages.
How many broker accounts can I track?
On the Advanced plan you can create up to 15 portfolios, and on Pro the number is unlimited. Create one portfolio per broker account and use the Combined Portfolio feature to see them all in one unified dashboard. You can also create multiple combined portfolios for different purposes (e.g., all accounts vs taxable accounts only).
Which brokers support automatic sync?
AllInvestView supports automatic sync with 30+ brokers including Interactive Brokers, Schwab, Fidelity, Trading 212, DEGIRO, Robinhood, Webull Canada, Wealthsimple, Alpaca, Vanguard, Zerodha, Upstox, and more. For the full list, visit the broker sync page after signing up. For brokers not yet supported for auto-sync, such as Trade Republic, Scalable Capital, Revolut, and Swissquote, CSV import and manual entry are always available.
Can I combine portfolios and still see each one separately?
Absolutely. The Combined Portfolio feature creates a unified view on top of your individual portfolios, it does not merge or modify them. You can switch between the combined dashboard and any individual portfolio at any time. Each portfolio retains its own performance metrics, trade history, and analytics.
Consolidate All Your Accounts
Stop switching between broker apps. Track every investment in one professional dashboard with combined analytics and tax reporting.
Start Tracking Free