Why Year-Round Tax Tracking Beats Year-End Scrambling
Most investors ignore their tax position until January, when a pile of broker statements arrives and the clock is ticking. By then, every decision that could have reduced your tax bill - harvesting losses, timing sales, shifting between short-term and long-term gains - is already locked in. The tax year is over. You are just counting the damage.
Year-round tax tracking flips this dynamic. Instead of reacting to your tax situation after the fact, you actively manage it throughout the year. Consider what a real-time tax dashboard shows you at a glance:
With these four numbers visible at all times, you can make informed decisions: sell a losing position to offset a gain, wait three more weeks to cross the long-term threshold, or realize just enough gains to stay under a tax bracket. None of this is possible if you only look at your tax position once a year.
The Cost of Waiting
A study by Vanguard found that systematic tax-loss harvesting can add up to 1.5% per year in after-tax returns. But harvesting opportunities are time-sensitive - a stock that is down 20% in October may recover by December. Year-round tracking ensures you never miss a window.
What You Need to Track (And Why Each Matters)
Effective tax tracking requires monitoring five categories of data. Missing any one of them creates blind spots that can cost you money at tax time.
Unrealized Gains and Losses
Unrealized gains are the profit sitting in positions you have not sold yet. While they are not taxable until you sell (in most jurisdictions), they represent your future tax liability. Knowing this number helps you plan when and how much to sell. For a deeper understanding of how gains are taxed, see our capital gains tax guide.
- Why it matters: A $10,000 unrealized gain is a potential $2,000 tax bill (at 20%). If you are not tracking it, that bill will surprise you.
- What to watch: Positions approaching the long-term holding threshold, large concentrated gains, and positions with losses that could offset gains.
Realized Gains and Losses
Every time you sell, the gain or loss becomes realized and enters your tax calculation. Tracking realized gains throughout the year tells you exactly where you stand. Refer to our capital gains tax guide for details on short-term vs long-term classification.
- Short-term gains (held 1 year or less): Taxed at your ordinary income rate - up to 37% in the US.
- Long-term gains (held more than 1 year): Taxed at preferential rates - 0%, 15%, or 20% in the US.
- Net losses: Can offset gains dollar-for-dollar, plus up to $3,000 of ordinary income per year (US). Excess carries forward.
Cost Basis Per Lot
When you buy the same stock multiple times, each purchase creates a separate "lot" with its own cost basis and holding period. The lot you choose to sell determines your taxable gain. Our FIFO vs LIFO guide explains the four main methods and when to use each one.
Tax Lot Selection Can Save Thousands
Imagine you own 300 shares of a stock: 100 bought at $50, 100 at $75, and 100 at $100. If the stock is at $90 and you want to sell 100 shares, FIFO gives you a $4,000 gain, but LIFO gives you a $1,000 loss. At a 20% tax rate, that is a $1,000 difference on a single trade.
Dividend Income
Dividends are taxable in the year received, even if reinvested. You need to track the total amount, the qualified vs ordinary split (which determines the rate), and any foreign withholding tax paid. See our dividend withholding tax guide for international dividend taxation details.
Currency (FX) Impact
If you hold investments denominated in foreign currencies, exchange rate movements create additional taxable gains or losses. A stock that is flat in its local currency can still generate a taxable gain if your home currency weakened since purchase. For a complete treatment, see our multi-currency portfolio guide.
How to Track Capital Gains in Real Time
Tracking capital gains in real time means having a system that continuously updates your tax position as prices move, new trades are booked, and dividends are paid. Here is a five-step process to set this up.
Step 1 - Record Every Trade
The foundation of tax tracking is a complete and accurate trade history. Every buy, sell, dividend reinvestment, corporate action (splits, mergers), and transfer needs to be captured with the correct date, quantity, price, and currency.
- Automatic sync: Connect your brokerage account so trades are imported automatically. AllInvestView supports 30+ brokers.
- Manual entry: For brokers without automatic sync, enter trades manually or upload a CSV file.
- Corporate actions: Stock splits, reverse splits, and spin-offs change your cost basis. Make sure these are reflected in your records.
Step 2 - Assign a Cost Basis Method
Your cost basis method determines which shares are "sold" when you close part of a position. This directly affects the size of your taxable gain. The table below summarizes the four main methods:
| Method | Rule | Best When | Tax Impact |
|---|---|---|---|
| FIFO | Sell oldest shares first | Prices have fallen since first purchase | Highest gain in rising market |
| LIFO | Sell newest shares first | Prices have risen since last purchase | Lowest gain in rising market |
| Average Cost | Weighted average of all lots | Many small purchases (DCA, DRIP) | Middle ground |
| Specific ID | You choose the lot | Maximum control for optimization | Lowest if you pick high-cost lots |
Compare Before You Sell
AllInvestView lets you compare the tax impact of FIFO, LIFO, and average cost before you commit to a sale. Use the capital gains tax calculator to run scenarios and see which method minimizes your tax bill for each specific trade.
Step 3 - Monitor Unrealized Tax Exposure
Once your trades are recorded and your cost basis method is set, you can see your unrealized tax exposure in real time. This is the estimated tax you would owe if you sold all positions today. A tax dashboard shows this at the portfolio level and broken down by position:
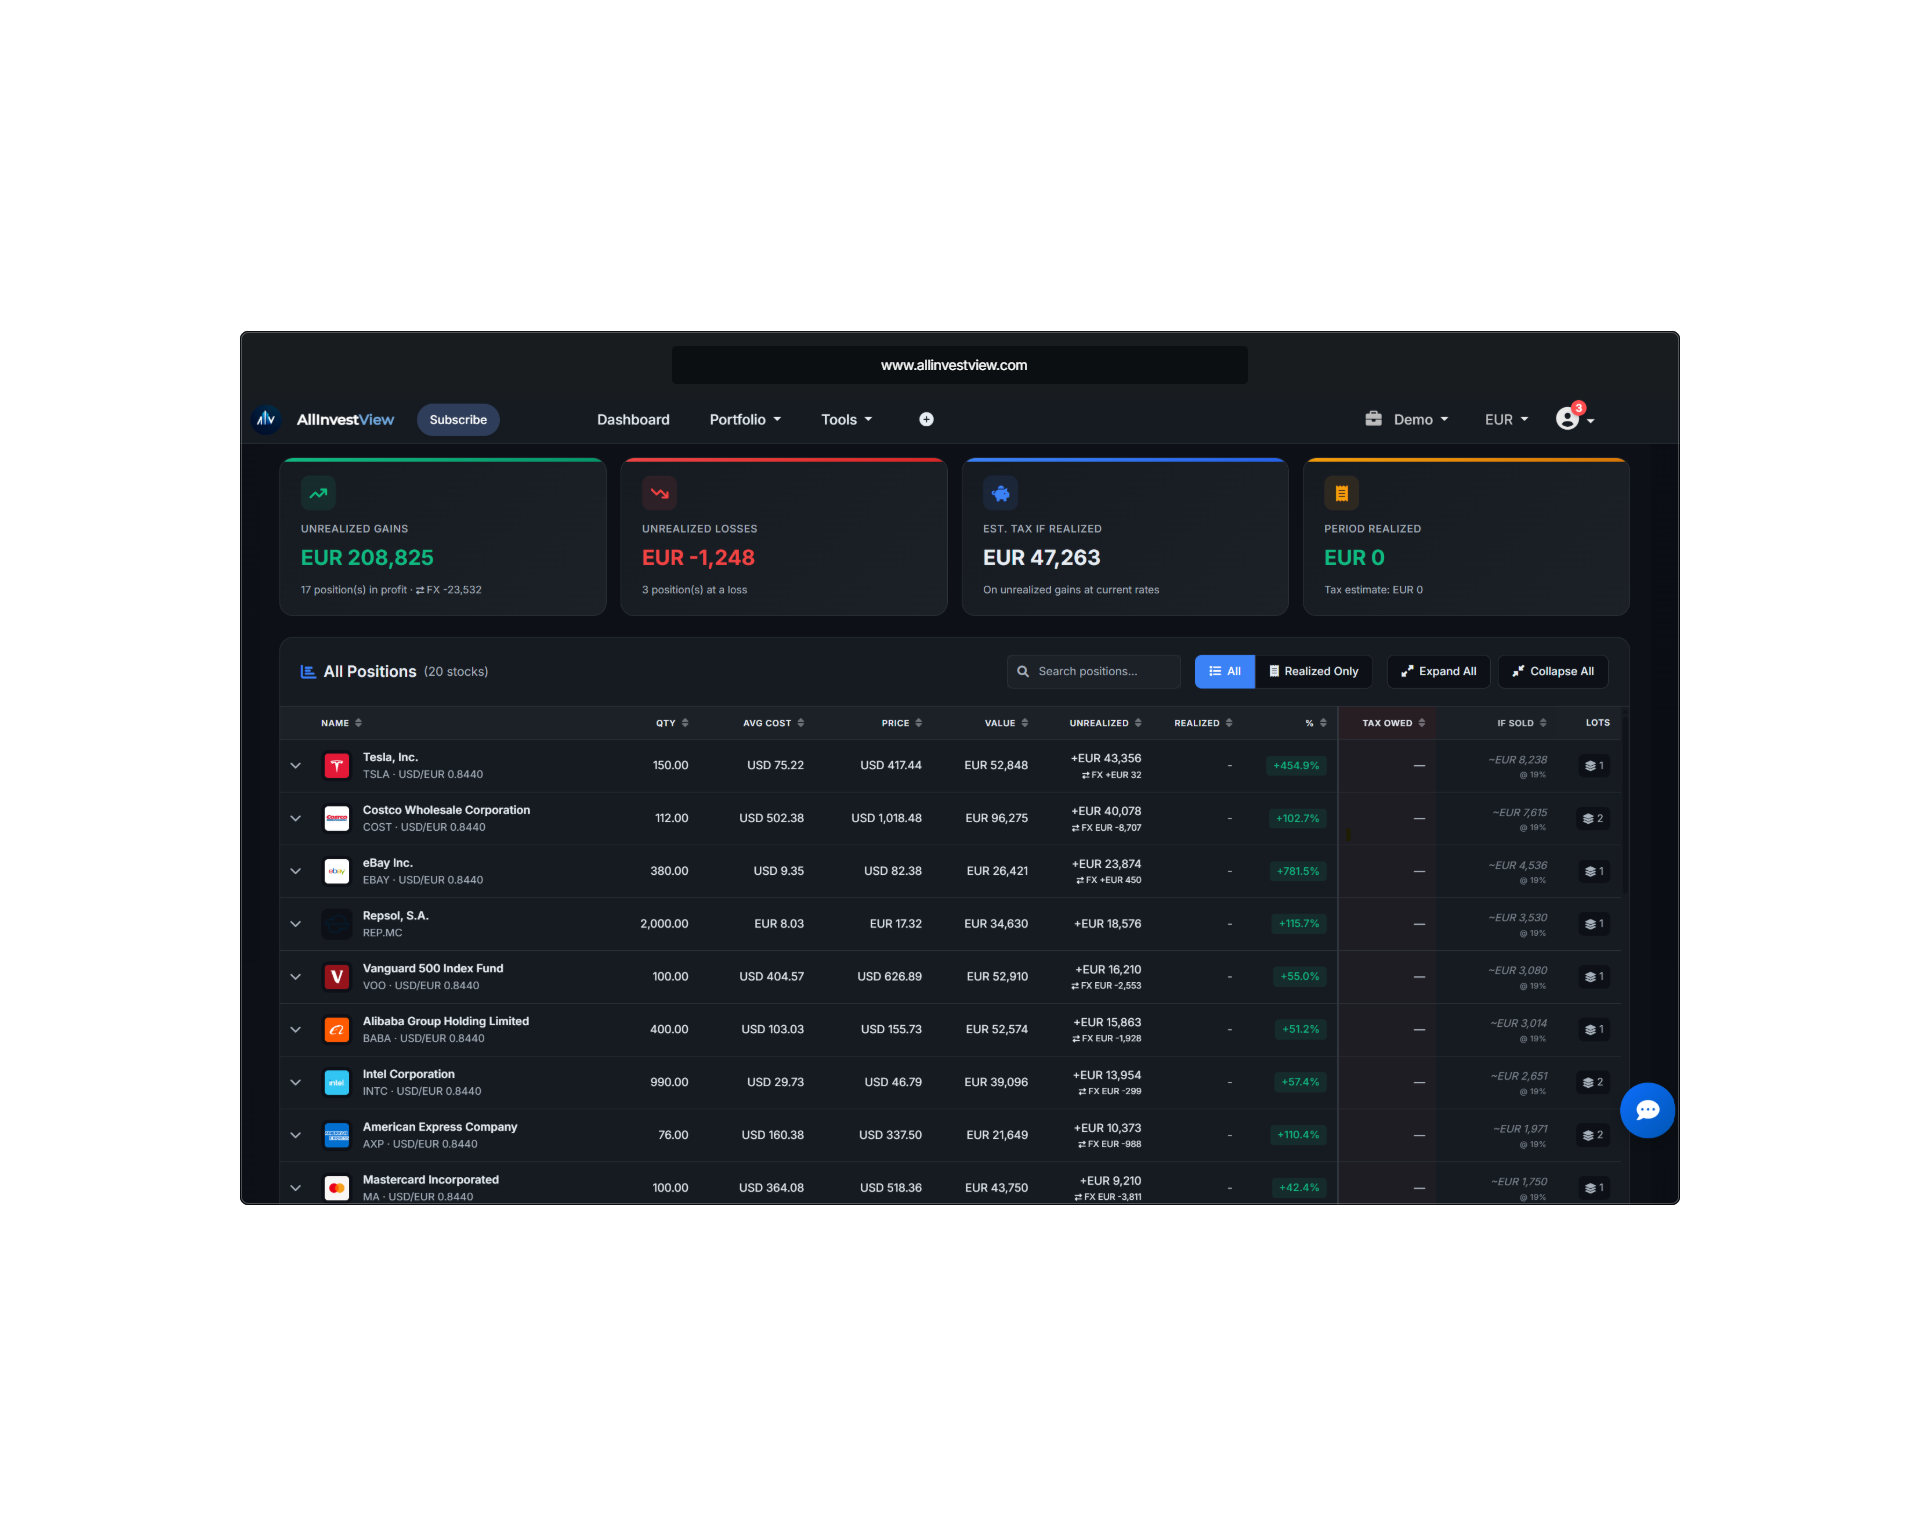
AllInvestView Tax Report: Real-time unrealized gains, estimated tax liability, and per-position detail
The screenshot above shows a tax report with summary cards for total unrealized gains, losses, and estimated tax, plus a detailed breakdown by stock. Each row shows the position size, cost basis, current value, gain/loss, and the tax impact. This view updates automatically as prices move.
Step 4 - Track Holding Periods
The difference between short-term and long-term capital gains rates can be dramatic. In the US, the spread is up to 17 percentage points (37% short-term vs 20% long-term). Tracking holding periods tells you exactly when each lot crosses the long-term threshold.
The Expensive Miscalculation
Selling a $10,000 gain one day too early (at 364 days instead of 366) could cost an extra $1,700 in taxes at the highest US bracket. Always check the purchase date and holding period before selling a winning position.
Step 5 - Run Tax Scenarios Before Selling
Before executing a sale, run a "what-if" analysis. How much tax will this sale generate? Would selling a different position produce a better after-tax result? Can you pair this sale with a loss harvest to offset the gain?
- Scenario 1: Sell Stock A for a $5,000 gain. Estimated tax: $1,000 (long-term, 20%).
- Scenario 2: Sell Stock A and harvest a $3,000 loss on Stock B. Net gain: $2,000. Estimated tax: $400. Savings: $600.
- Scenario 3: Wait 3 weeks for Stock A to cross the long-term threshold. If it was short-term, the rate drops from 37% to 20%, saving $850 on a $5,000 gain.
Tax-Loss Harvesting: Track Opportunities Automatically
Tax-loss harvesting is the strategy of intentionally selling losing positions to realize losses that offset gains. It is one of the most effective legal strategies for reducing investment taxes, but it requires active tracking to execute well. Our tax-loss harvesting guide covers the strategy in depth.
How It Works
- Identify positions with unrealized losses. Your tax dashboard shows these in real time.
- Sell the losing position to realize the loss. This loss offsets realized gains dollar-for-dollar.
- Buy a similar (but not identical) replacement to maintain your market exposure. For example, sell an S&P 500 ETF and buy a total market ETF.
- Avoid the wash sale rule. Do not buy a "substantially identical" security within 30 days before or after the sale, or the loss is disallowed.
Example with Numbers
Consider this scenario at year-end:
| Position | Cost Basis | Current Value | Unrealized G/L |
|---|---|---|---|
| Stock A (Tech) | $8,000 | $12,000 | +$4,000 |
| Stock B (Energy) | $6,000 | $4,500 | -$1,500 |
| Stock C (Healthcare) | $5,000 | $4,200 | -$800 |
Without harvesting: You sell Stock A and owe tax on $4,000 in gains. At 20%, that is $800 in tax.
With harvesting: You also sell Stocks B and C, realizing $2,300 in losses. Net gain: $4,000 - $2,300 = $1,700. Tax: $340. You saved $460.
Wash Sale Detection Is Critical
If you sell Stock B at a loss and buy it back within 30 days, the loss is disallowed. A good tax tracker flags wash sale windows automatically, so you know exactly when it is safe to repurchase. The wash sale rule applies across all your accounts, including retirement accounts in the US.
Multi-Jurisdiction Tax Tracking
Tax rules vary dramatically across countries. If you invest globally or have tax obligations in multiple jurisdictions, your tracking system must handle different rates, exemptions, and rules simultaneously.
United States
- Short-term gains taxed at ordinary income rates (10% - 37%)
- Long-term gains taxed at 0%, 15%, or 20% depending on income
- Net capital losses offset up to $3,000 of ordinary income per year
- Excess losses carry forward indefinitely
- Reported on Schedule D and Form 8949
United Kingdom
- Annual CGT allowance (currently reduced to a low threshold)
- Basic rate taxpayers: 10% on gains above the allowance
- Higher/additional rate taxpayers: 20% on gains above the allowance
- ISA and SIPP accounts are tax-free - no gains to track inside them
- 30-day "bed and breakfast" rule (similar to US wash sale)
European Union
EU countries each have their own capital gains tax systems. Some highlights:
- Germany: Flat 26.375% (including solidarity surcharge) on all capital gains, regardless of holding period. See our German capital gains tax guide for details.
- Spain: Progressive rates from 19% to 28% depending on the amount of gains. Losses carry forward for 4 years. See our Spanish capital gains tax guide.
- Netherlands: Wealth tax on deemed return (not actual gains) - a unique system
- France: Flat 30% (PFU) on capital gains and dividends combined
Australia
- 50% CGT discount for assets held more than 12 months
- No separate long-term rate - the discount halves the gain before adding it to income
- Capital losses can only offset capital gains (not ordinary income)
- Losses carry forward indefinitely
AllInvestView Supports 14 Tax Jurisdictions
AllInvestView generates tax reports tailored to your country's rules - including the correct rates, holding period thresholds, loss carryforward rules, and currency conversion requirements. Select your jurisdiction and the system handles the rest.
Year-Round Tax Planning Calendar
Tax planning is not a once-a-year activity. Here is a quarterly calendar to keep your investment taxes on track throughout the year.
Q1 Tax Season Prep (Jan - Mar)
- Collect all broker statements (1099-B, 1099-DIV)
- Reconcile broker reports with your tracking records
- Generate your annual tax report
- File or share reports with your tax advisor
- Document any carryforward losses for next year
Q2 Mid-Year Check (Apr - Jun)
- Review year-to-date realized gains
- Check if estimated tax payments are needed
- Identify early tax-loss harvesting opportunities
- Review holding periods - which positions are close to long-term?
- Adjust your cost basis method if your strategy has changed
Q3 Strategic Positioning (Jul - Sep)
- Run tax projections for the full year
- Harvest losses before year-end rush (less crowded, better prices)
- Review dividend income accumulation
- Plan large trades around holding period thresholds
- Consider Roth conversions if in a low-income year
Q4 Year-End Optimization (Oct - Dec)
- Final tax-loss harvesting sweep across all accounts
- Sell positions that have crossed the long-term threshold
- Review total gains and losses to hit target net gain
- Check for wash sale windows on recent harvests
- Ensure all dividend income is accounted for
Q3 Is the Sweet Spot for Harvesting
Most investors wait until December for tax-loss harvesting, which creates selling pressure and worse execution prices. Harvesting in July-September avoids the year-end crowd and gives you time to reassess before December. Plus, you have longer for the wash sale window to expire before year-end.
Tools vs. Spreadsheets: Why Manual Tracking Fails
Many investors start with a spreadsheet to track their taxes. It works for a few trades, but breaks down quickly as complexity grows. Here is a comparison:
| Feature | Spreadsheet | Tax Tracking Tool |
|---|---|---|
| Trade import | Manual copy-paste from broker | Automatic sync from 30+ brokers |
| Cost basis calculation | Manual formulas per lot | Automatic FIFO/LIFO/Average |
| Real-time prices | Manual lookup or API add-on | Live price feeds |
| Wash sale detection | You have to check manually | Automatic flagging |
| Multi-currency | Manual FX rate lookup per trade | Automatic historical FX conversion |
| Corporate actions | Manual adjustment (easy to miss) | Automatic (splits, mergers, spin-offs) |
| Multi-account | Separate tabs, no cross-account view | Consolidated across all accounts |
| Tax report generation | You build the report manually | One-click downloadable reports |
| Error rate | High (formula errors, missed trades) | Low (automated calculations) |
| Time required | Hours per month | Minutes per month |
The breaking point usually comes with corporate actions or multi-currency trades. A 4-for-1 stock split changes the cost basis and quantity of every lot you own in that stock. In a spreadsheet, you have to manually find and update every row. In a tracking tool, it happens automatically.
How to Get Started
Setting up year-round tax tracking takes about 15 minutes. Here are the seven steps:
- Import your trade history. Connect your brokerage accounts or upload trade history. AllInvestView supports automatic sync with 30+ brokers including Interactive Brokers, Trading 212, Fidelity, Schwab, and more.
- Set your tax jurisdiction. Select your country and tax year. AllInvestView applies the correct rates, exemptions, and holding period rules for 14 jurisdictions including US, UK, Germany, Spain, Australia, and Canada.
- Choose your cost basis method. Select FIFO, LIFO, or average cost. You can compare the tax impact of each method before committing. See our FIFO vs LIFO guide to understand the tradeoffs.
- Review your unrealized tax exposure. Check the tax report to see estimated tax on unrealized gains across all positions. This is your "what if I sold everything today" number.
- Identify tax-loss harvesting opportunities. Look for positions with unrealized losses that could offset your gains. Check wash sale windows before acting. See our tax-loss harvesting guide for strategies.
- Monitor holding periods. Track which positions are approaching the long-term capital gains threshold. A few extra days of patience can cut your tax rate by more than half.
- Generate your tax report. At year-end, generate a comprehensive report with all realized gains, losses, dividends, and adjustments. Download it for your records or share it with your tax advisor.
Free to Start
AllInvestView is free to use with no credit card required. Import your trades, set up your tax jurisdiction, and start tracking your tax position today. You can also explore how the dividend tax calculator handles withholding tax across countries.
Frequently Asked Questions
Stop Guessing. Start Tracking.
AllInvestView tracks your capital gains, monitors your tax exposure in real time, and generates tax reports for 14 jurisdictions - all for free.
Start Tracking Your Taxes