Why Bond Investors Need a Different Tracker
Most portfolio trackers were built for equity investors. You enter a stock ticker, the tool pulls the price from Yahoo or Google Finance, and your P&L updates automatically. Bonds do not work that way. A bond's theoretical value changes every time the yield curve moves, not just when a dealer happens to post a quote. A bond that cost you 98 in January could reasonably be worth 96 or 100 in April depending on what happened to rates — and most portfolio trackers will still show you 98 because nobody re-entered the price.
A real bond portfolio tracker does five things a general tracker skips: it reprices against live yield curves, it tracks credit spreads, it computes YTM and duration correctly, it visualizes the maturity ladder, and it projects forward coupon income. We reviewed five popular tools against these criteria, plus CUSIP/ISIN support and multi-currency handling. Here is how they stack up.
Review Criteria
Yield Curve Repricing
Does it pull live central bank curves and recompute theoretical prices?
CUSIP + ISIN
Can you enter either identifier and have it normalized?
Maturity Ladder
Does it visualize when principal comes due across the portfolio?
Coupon Calendar
Does it project 12 months of forward coupon payments?
Credit Spreads
Can you track implied spread over the benchmark per bond?
Multi-Currency
Does it handle CAD, USD, EUR, and GBP natively?
Our goal is not to pick a single winner for every investor — it is to help you match the right tool to your actual bond workflow. Each review below flags concrete pros and cons against the criteria above, and the decision boxes at the bottom summarize which tool fits which use case.
The Rankings

AllInvestView Editor's Pick
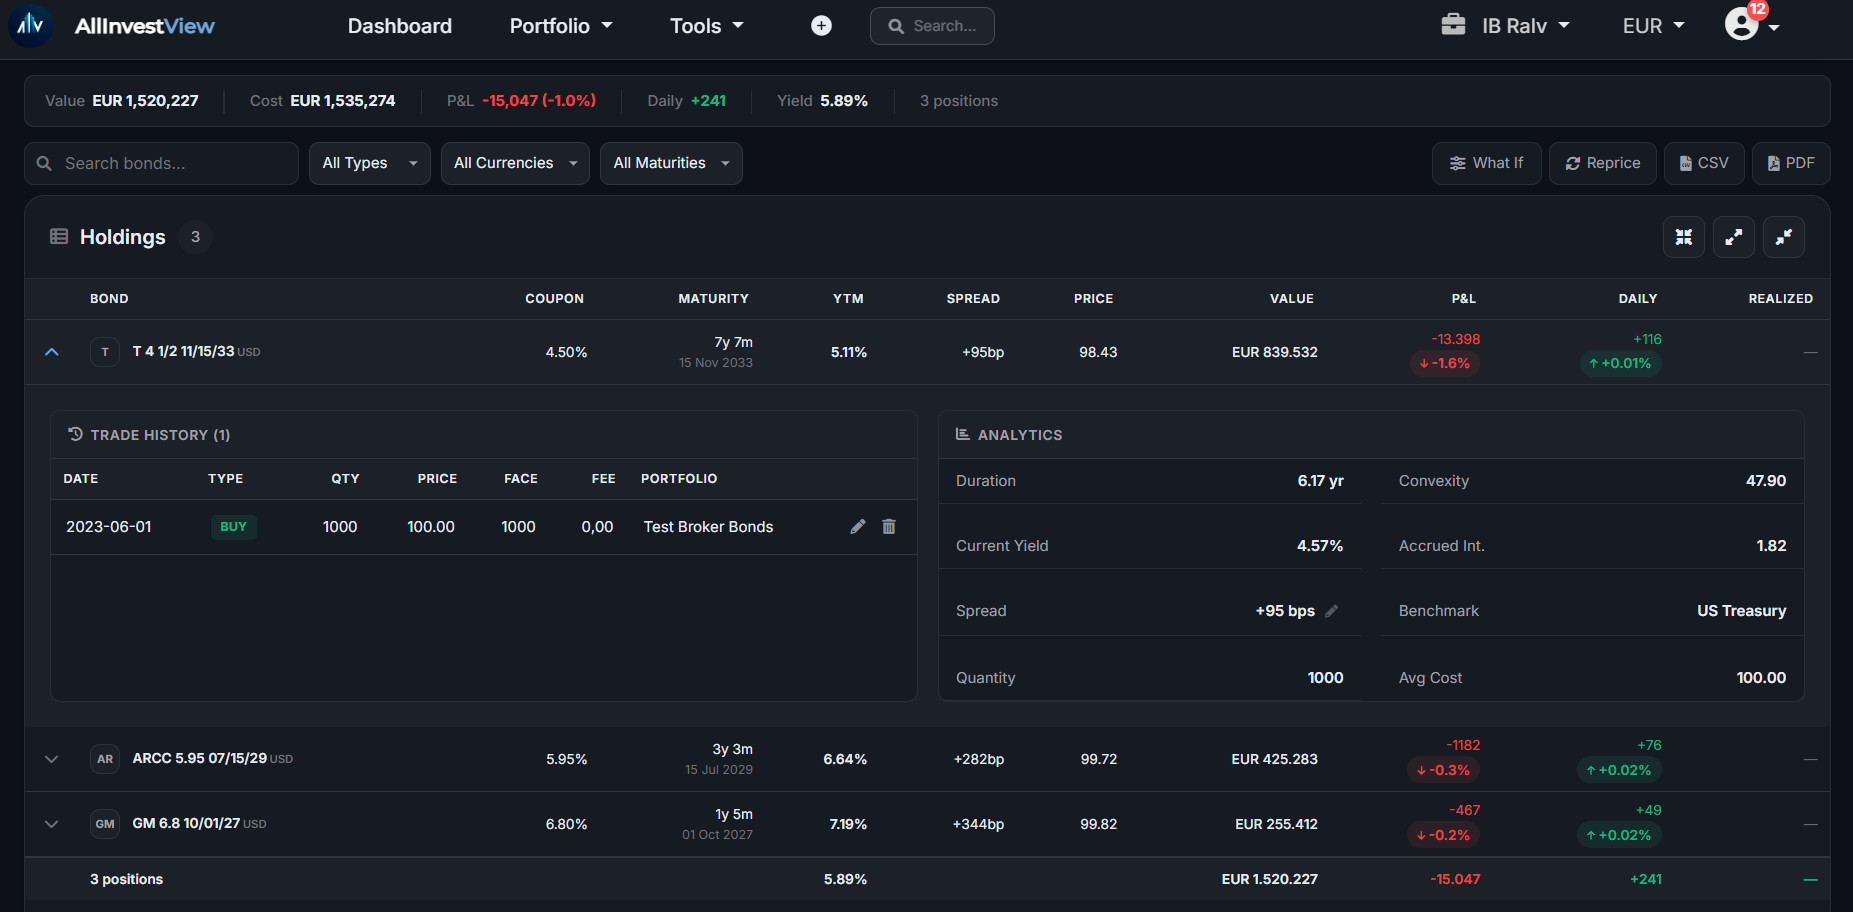
AllInvestView is the only tracker on this list that was built from the ground up with bond pricing in mind. It pulls live yield curves from five central banks (Bank of Canada, US Treasury, ECB, Bank of England, and RBA for Australian government bonds) plus seven country-shifted curves for EU sovereigns (IT, ES, FR, PT, IE, GR, BE), reprices using QuantLib with the correct day-count conventions, and tracks implied credit spreads per bond. CUSIPs are auto-converted to ISINs. The maturity ladder and coupon calendar are first-class features, not afterthoughts. Multi-currency is native. And the core bond tracker is free.
Pros
- Live repricing from 5 central banks plus 7 EU country curves
- QuantLib-grade pricing engine
- CUSIP + ISIN + credit spread editing
- Household consolidation for advisors
- Free tier covers core bond tracking
Cons
- PDF branded reports not yet available
- No real-time tick data (end-of-day curves)
Sharesight
Sharesight is a solid general-purpose tracker with very good tax reporting, especially for Australian, UK, and New Zealand investors. Bond support exists but is limited — you can enter bonds as holdings, but there is no yield curve repricing, no credit spread tracking, and the maturity ladder and coupon calendar have to be built manually. If you hold a small number of bonds alongside mostly equities, Sharesight handles the cost-basis side well. If bonds are a core allocation, it will frustrate you.
Pros
- Excellent tax reports (AU, UK, NZ)
- Clean multi-asset portfolio view
- Good multi-currency handling
Cons
- No yield curve repricing
- No credit spread tracking
- Manual price updates for bonds
Fidelity (in-app tools)
Fidelity's in-app bond tools are genuinely good for customers holding bonds with Fidelity. Bond screener, maturity ladder builder, and yield calculations are all built in. The obvious limitation: it only tracks bonds held in Fidelity accounts. If you have holdings at a second broker, a trust account elsewhere, or an international account, Fidelity's tools stop at the border.
Pros
- Integrated with Fidelity bond inventory
- Built-in bond ladder tool
- Free for Fidelity customers
Cons
- Only tracks Fidelity-held bonds
- No cross-broker consolidation
- Limited credit spread analytics
BondbloX
BondbloX is an interesting specialist platform focused on fractional bond investing, mainly for Asian and some international issues. Their portfolio manager handles what you buy on their platform well, but it is not a general-purpose tracker — you cannot easily import holdings from elsewhere, and Canadian and US government bond curve integration is not a focus.
Pros
- Bond-specific features
- Fractional bond investing
Cons
- Narrow coverage (mostly Asia)
- Limited curve coverage
- Platform-bound holdings
Excel / Google Sheets
Most bond investors end up here by default. A spreadsheet can do anything you want it to do — in theory. In practice, maintaining accurate YTM calculations, pulling current yield curve data, computing accrued interest with the right day-count convention, and keeping a maturity ladder up to date is a full-time job nobody wants. For a handful of holdings it works. Past that, it does not.
Pros
- Free
- Fully customizable
Cons
- Manual everything
- Error-prone (day counts, accruals)
- No yield curve data
- High maintenance cost
Ready to try the top-ranked tracker?
AllInvestView's bond tracker is free on the core tier — add your bonds, reprice against live Bank of Canada and US Treasury curves, and see your maturity ladder in under a minute. Create your free account →
How Bond Repricing Actually Works — A Walkthrough
The methodology above is easy to describe in abstract — "benchmark curve plus implied spread" — but a concrete example makes it obvious why this approach is more honest than storing a stale purchase price. Here is a step-by-step walkthrough of how AllInvestView prices a real Government of Canada bond today.
Example: Government of Canada 1% 01-Jun-2027 (CUSIP 135087F82)
Trade date 2026-03-15, purchased at 97.50. Goal: compute today's theoretical price against the Bank of Canada curve.
Step 1 — Pick the benchmark curve
Currency:        CAD → Bank of Canada Government of Canada curve
Tenor to maturity: ~14 months → interpolate between 1Y (2.55%) and 2Y (2.79%)
Interpolated benchmark yield: ~2.60%
Step 2 — Compute the implied credit spread (at trade date)
Trade price: 97.50 → YTM (semi-annual, 30/360): ~3.45%
Spread over benchmark:        3.45% − 2.60% = +85bp
Note: for a Government of Canada bond, the true market spread should be ~0bp. If the stored implied spread comes out to +85bp, the trade price was an estimate, not a real execution — editable via the pencil icon on the bond report to pin the spread back at zero.
Step 3 — Reprice against today's curve
Today's interpolated benchmark: 2.58% (auto-refreshed from BoC Valet API)
Target yield:  2.58% + 0bp spread = 2.58%
Theoretical price: 98.55 (computed by QuantLib PV engine)
Step 4 — Show analytics
YTM: 2.58%   Duration: 1.15   Accrued: $0.52   Spread: 0bp
Unrealized P&L: (98.55 − 97.50) × face = +1.05 per $100
Every number above is either visible on the bond report or configurable by the user. The benchmark curve comes straight from the Bank of Canada Valet API — you can verify the interpolated yield yourself against the published data. QuantLib handles the present-value math with the correct day-count convention and compounding basis. And the implied spread is editable, so if your dealer gives you a fresh mark, you enter the spread, hit reprice, and the theoretical price updates immediately. That transparency is the thing no spreadsheet or stale-price tracker can give you.
For the full methodology — every curve source, the implied-spread calibration, the multi-lot anchor pattern, and the resilience model — see Inside the Bond Pricing Engine. For where pricing meets imperfect hedges and mixed-source data, see Basis Risk for Bond Investors.
Feature Comparison Matrix
| Feature | AllInvestView | Sharesight | Fidelity | BondbloX | Excel |
|---|---|---|---|---|---|
| Live yield curve repricing | Yes (5 base + 7 EU shifts) | No | Partial | Partial | Manual |
| CUSIP + ISIN support | Both (auto-convert) | Both | Both | ISIN mainly | Type-what-you-want |
| Maturity ladder visualization | Yes | Manual | Yes | Basic | Build your own |
| Forward coupon calendar | 12-month | No | Yes | Limited | Manual |
| Credit spread tracking | Yes (editable) | No | No | Partial | Manual |
| Multi-currency (CAD/USD/EUR/GBP) | All four | Broad | USD mainly | Limited | Type anything |
| Household consolidation | Yes | Per-portfolio | Within Fidelity | No | Separate files |
| Free tier | Yes (core) | Limited | Fidelity only | Paid | Yes |
Which Tool Is Right for You?
For individual investors with 5-50 bonds
Pick AllInvestView. The free tier covers everything you need — live repricing, CUSIP support, maturity ladder, coupon calendar. No learning curve, no manual spreadsheet maintenance.
For wealth advisors managing client households
AllInvestView with household consolidation. See the advisor-focused page for multi-household workflows, rebalancing, and client reporting.
For Fidelity-only bond investors
Start with Fidelity's built-in tools. If all your bonds are held at Fidelity, their in-app ladder builder and bond screener are free and well-integrated. Move to AllInvestView if you add a second broker or want credit spread tracking.
For tax-focused investors with mixed equity + bond portfolios
Sharesight + AllInvestView. Use Sharesight for tax reports if you need country-specific tax handling (AU, UK, NZ). Use AllInvestView alongside it for the bond-specific analytics Sharesight does not cover.
For spreadsheet die-hards
Use a spreadsheet for 1-5 bonds, switch to AllInvestView past that. A spreadsheet is fine when you have a single Treasury bond sitting in an IRA. Once you have a dozen holdings with different currencies, day counts, and credit risks, the maintenance cost exceeds the cost of a purpose-built tracker.
What about Bloomberg Terminal?
Bloomberg is outside this comparison because it is a different product for a different audience. A Bloomberg seat runs around $24,000 per year and is built for institutional trading desks. For a retail bond investor or independent advisor, Bloomberg is overkill — both in cost and complexity. For a comparison of AllInvestView versus Bloomberg specifically, see the best bond tracking apps guide.
Frequently Asked Questions
Track Your Bonds the Right Way
Live central bank yield curves, CUSIP support, maturity ladder, and coupon calendar — free.