The Advisor Fixed Income Problem
Most wealth advisors manage fixed income the same way: an Excel sheet for drift tracking, dealer quotes pulled manually for the illiquid names, a spreadsheet per household, and a frantic rebuild before every review meeting. It works — barely — until a client asks a question that takes 40 minutes to answer because the data lives in six different places.
The tools that do solve this properly — Bloomberg Terminal, FactSet, dedicated portfolio management platforms — are priced for institutions, not for independent advisors or small teams. A single Bloomberg seat runs around $24,000 per year. Multiply by an associate or two and fixed income tooling becomes your single largest software line item.
Excel drift tracking
Manual spreadsheets per household. One fat-finger in a day-count convention and the accrued interest is off by hundreds.
Bloomberg cost
$24K+ per seat per year. Overkill for an advisor who needs analytics and reporting, not execution.
Dual-currency chaos
Most tools treat CAD and USD as separate portfolios. You end up mentally stitching them together for client reviews.
No automatic repricing
Bond prices go stale the moment you book them. Without yield curve repricing, drift reports use purchase prices.
AllInvestView was built for the middle ground — the independent advisor, the associate running point on fixed income, the small team managing dozens of client households. The bond analytics engine uses the same pricing library institutional desks rely on (QuantLib), pulls curves directly from the central banks, and rolls everything up into household-level reports advisors can actually hand to clients.
What You Get
Live Yield Curve Repricing
One-click repricing against live curves from the Bank of Canada, US Treasury, ECB, Bank of England, and RBA, plus seven country-shifted curves for EU sovereigns. Official sources, no third-party data vendor in the chain.
Household Consolidation
Group RRSP, TFSA, non-registered, corporate, and trust accounts into a single household view with consolidated duration, maturity, and income analytics.
Credit Spread Editing
Set implied spread per position directly. Got a fresh dealer mark? Click the pencil, enter the basis points, reprice. Sovereign bonds default to zero spread.
Maturity Ladder
Visualize when principal comes due across every household. Colour-coded by bond type. Spot concentration risk at a glance.
Coupon Income Calendar
12-month projected coupon payments across every client, every bond. Monthly breakdown for cash flow planning and reinvestment.
Rebalancing Engine
Set target allocations, detect drift across households, get a recommended trade list. Bond values use live theoretical prices, not stale purchase prices.
CUSIP and ISIN
Enter either identifier. CUSIPs are auto-converted to ISINs so holdings are globally consistent regardless of how your dealer reports them.
Client-Ready Reports
CSV export and a print-friendly view that renders cleanly for review meetings. PDF exports with custom branding on the near-term roadmap.
What the Bond Report Looks Like
The bond report is the page you'll live in for review prep and intraday monitoring. It's a single consolidated view of every bond in the selected household (or across all households), with analytics computed from live yield curves.
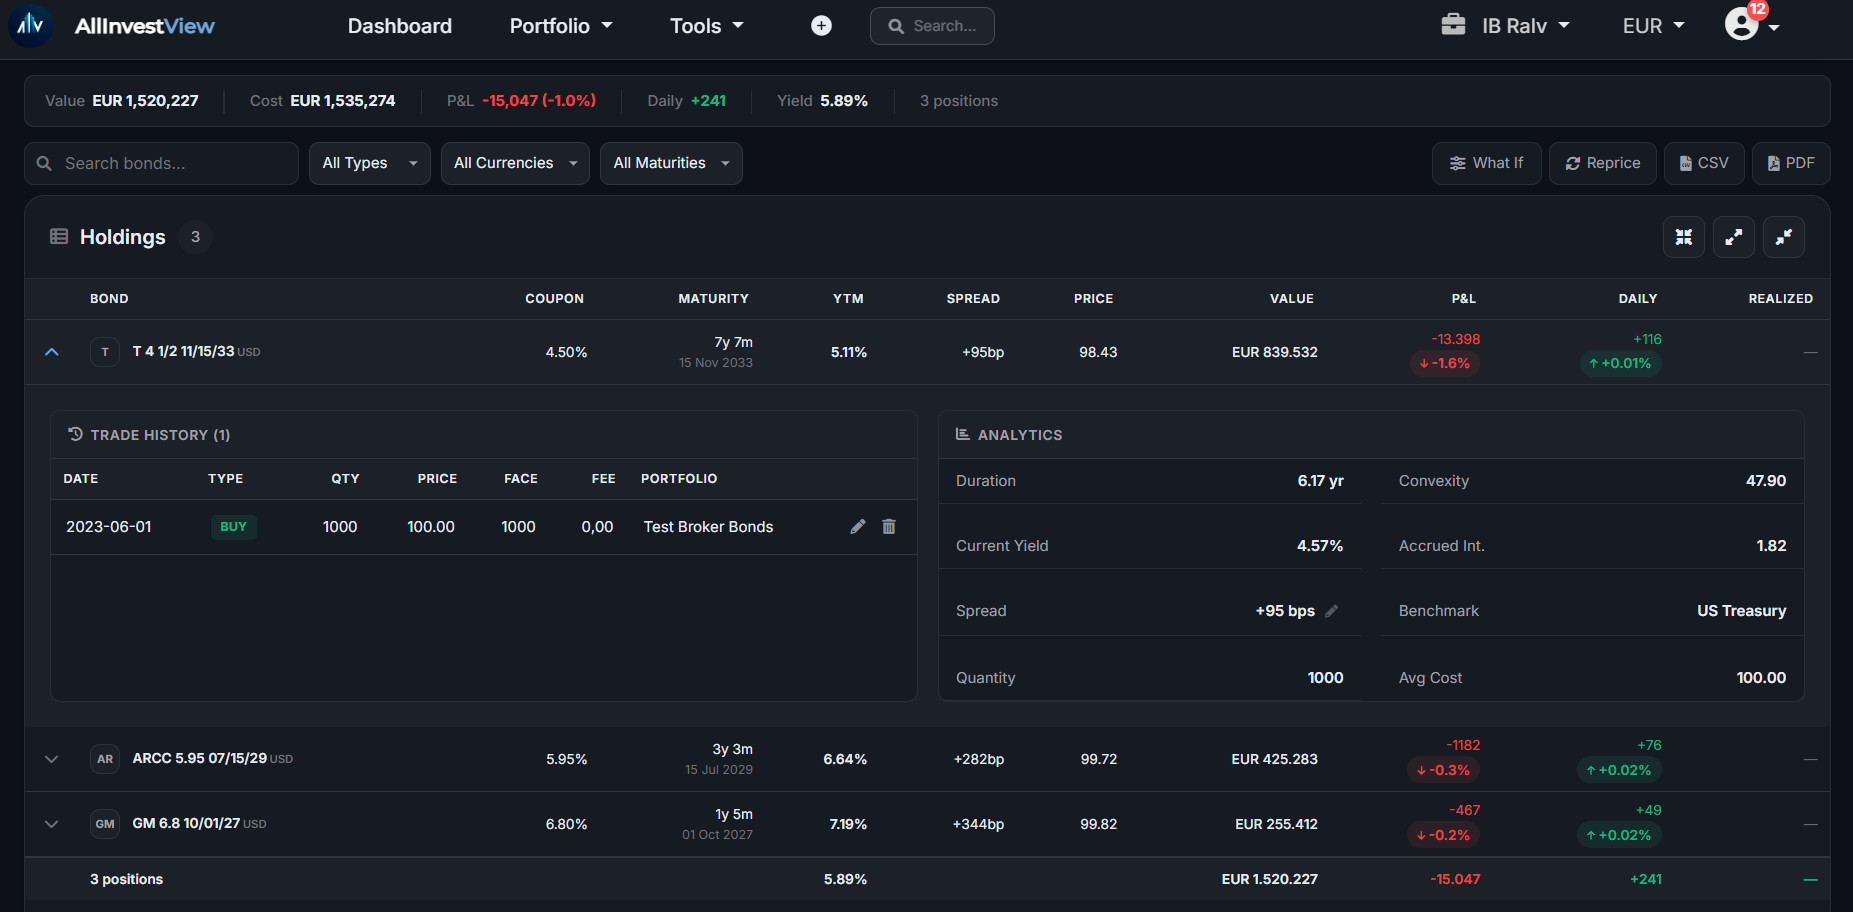
Beneath the positions table you get the maturity ladder (a stacked bar by year with bonds colour-coded by type), the 12-month coupon income calendar, a yield curve chart with your positions plotted on it, and a rate sensitivity panel showing P&L impact at ±100 and ±200 bps parallel shifts.
A Typical Advisor Workflow
Here is what onboarding and day-to-day usage looks like for an advisor managing fixed income across client households.
Import holdings from your dealer CSV
Export bond holdings from your back office (Charles River, Purefacts, or wherever) as CSV. Import into AllInvestView by household. CUSIPs, ISINs, maturity dates, coupons, and prices are all ingested. New households are created automatically from the import.
Set target allocations per household
In the rebalancing module, define each household's target fixed-income weight — and within that, target splits by issuer type (government, provincial, investment grade corporate, high yield). The engine uses these as the reference for drift detection.
Reprice and review
Before a review meeting, hit Reprice. The system fetches fresh yield curves from the Bank of Canada, US Treasury, ECB, Bank of England, and RBA (and the seven EU country-shifted curves), repricing every bond at the current benchmark plus the stored credit spread. Duration, YTM, and unrealized P&L all refresh in seconds.
Export a client-ready report
Use the print view or CSV export for the meeting handout. The print view renders clean positions, maturity ladder, coupon calendar, and yield metrics without the in-app chrome.
Monitor drift and credit spreads
Between reviews, the Portfolio Overview page shows every household at a glance. Drift indicators highlight which households need rebalancing. Credit spread changes on individual positions flag potential credit concerns without needing a data terminal.
Official Data Sources — No Proprietary Middlemen
One of the first questions advisors ask about any pricing tool: where does the data come from? AllInvestView's answer is deliberately transparent — all yield curves are pulled directly from the official central bank APIs. There is no proprietary data vendor in the chain, no opaque quote service, no made-up numbers.
| Currency | Curve | Source | Tenors |
|---|---|---|---|
| CAD | Government of Canada benchmark | Bank of Canada Valet API | CORRA overnight + 1M-1Y T-bills + 2Y-30Y bonds (12 points) |
| USD | US Treasury par yield curve | US Treasury Direct | 1M-30Y (13 points) |
| EUR | AAA-rated euro area curve | ECB Statistical Data Warehouse | 3M-30Y (11 points) |
| GBP | UK Gilt curve | Bank of England | 5Y, 10Y, 20Y (3 points) |
| AUD | Australian Government bonds | RBA F2 (Capital Market Yields) | 2Y, 3Y, 5Y, 10Y (4 points) |
| EUR (sovereigns) | Country-shifted curves for IT, ES, FR, PT, IE, GR, BE | ECB Statistical Data Warehouse | AAA shape + per-country 10Y anchor |
Why Transparency Matters
When a client asks "where does this yield come from?" you need to be able to answer them. "Bloomberg" is an answer. "Bank of Canada" is a better answer. "Our proprietary pricing engine" is not an answer your compliance team will love. For the full methodology — every curve source, the implied-spread calibration, the EU country-shift mechanism — see Inside the Bond Pricing Engine. For where this pricing meets imperfect hedges and mixed-source data, see Basis Risk for Bond Investors.
vs Bloomberg, FactSet, and Excel
Fixed income tooling for advisors tends to fall into three buckets: institutional terminals ($20K+ per seat), general-purpose portfolio tracking tools that handle bonds as an afterthought, and the Excel spreadsheet approach most advisors actually use day-to-day. Here's how AllInvestView fits in.
| Feature |  AllInvestView AllInvestView |
|||
|---|---|---|---|---|
| Live central bank yield curves | Yes (5 base + 7 EU shifts) | Yes | Yes | Manual lookup |
| Bond repricing with implied spread | Yes (QuantLib) | Yes | Yes | Error-prone |
| Multi-household consolidation | Built-in | Manual setup | Yes | Per-file |
| CUSIP + ISIN support | Both, auto-convert | Yes | Yes | Whatever you type |
| Rebalancing drift detection | Yes | Limited | Yes | Manual |
| Client-ready reports | CSV + print view | Export to Excel | Yes | You built it |
| Annual cost per advisor | Low (free tier available) | ~$24,000 | $12,000+ | $0 |
| Setup time | Minutes | Days + training | Weeks | Ongoing |
Bloomberg and FactSet are the right tools if you're running a trading desk or managing billions in AUM. For an independent advisor or a small team managing client portfolios, they are the wrong tools — too expensive, too complex, and optimized for workflows you don't actually need. Excel is the default because the middle ground has been missing. AllInvestView is that middle ground.
For Canadian Advisors
AllInvestView's fixed income tooling was sharpened by direct feedback from a Canadian wealth advisor managing nearly 200 client households, and Canadian market support reflects that.
- Bank of Canada curve: Live Government of Canada benchmark bonds (2Y, 3Y, 5Y, 7Y, 10Y, long), T-bill rates (1M, 2M, 3M, 6M, 1Y), and CORRA overnight — all direct from the BoC Valet API.
- Dual-currency households: CAD and USD bonds track in the same household view, each priced against its native curve, with household totals rolled up in CAD or USD base.
- Provincial and corporate support: Provincial bonds (Ontario, Quebec, BC, Alberta) and Canadian corporate issuers price off the GoC benchmark plus credit spread, the same methodology dealer desks use.
- Canadian dealer CSV imports: Import bond holdings from your existing back office (Charles River, Purefacts, National Bank, etc.) as CSV. Household grouping is preserved.
- Day-count conventions: Canadian semi-annual compounding (the default for Government of Canada bonds) is handled correctly by QuantLib.
Canadian bond pricing, done right
Most general-purpose portfolio trackers either skip Canadian bonds entirely or price them off the US Treasury curve (which is just wrong). AllInvestView prices CAD issues off the Bank of Canada curve, in CAD, with the correct day-count and compounding. Your clients get an accurate number and you get a defensible methodology.
Frequently Asked Questions
Fixed income tooling that fits an advisor's budget
Get institutional-grade bond analytics, household consolidation, and live central bank yield curves without a Bloomberg seat.