Platform Overview
Market Chameleon is a comprehensive data and analytics platform specializing in options volatility. It provides historical and implied volatility analysis, earnings move predictions, unusual options activity detection, and advanced screening tools. The platform caters to traders who make decisions based on volatility data and statistical analysis.
AllInvestView is a portfolio tracking and analytics platform that supports stocks, bonds, options, crypto, real estate, and custom assets. For options traders, it provides a Greeks dashboard, wheel strategy lifecycle, roll chain tracking, P&L analytics, and capital gains tax reporting across 14+ jurisdictions.
Market Chameleon
Volatility analytics platform with historical IV data, earnings analysis, unusual activity detection, and advanced options screening.
AllInvestView
Our PickPortfolio tracker with Greeks dashboard, wheel strategy lifecycle, P&L analytics, roll chains, broker sync, and tax reporting across all asset classes.
Volatility Analytics: Market Chameleon's Strength
Market Chameleon provides some of the deepest volatility data available to retail traders:
- Historical vs implied volatility — compare current IV to historical levels with volatility cones and percentile rankings
- Volatility term structure — analyze how IV changes across expiration dates to identify skew opportunities
- Earnings move analysis — predicted vs actual earnings moves with historical accuracy data
- Unusual options activity — large orders and volume spikes that may indicate institutional positioning
- Options screener — filter by IV rank, volume, open interest, Greeks, and dozens of other criteria
- Sector volatility — compare volatility across sectors and industries
This data is invaluable for research and trade selection. However, Market Chameleon does not track your actual positions or calculate your real P&L.
Portfolio Tracking: AllInvestView's Strength
AllInvestView focuses on what happens after you open a position:
- Position tracking — every trade recorded with cost basis, current value, and real-time Greeks
- Greeks dashboard — portfolio-level delta, gamma, theta, and vega with historical trends
- Wheel strategy — dedicated lifecycle stepper for CSP → assignment → CC → called away cycles
- Roll chain tracking — full history of rolls with net credit/debit calculations
- P&L analytics — realized and unrealized gains, annualized return on capital, per-position breakdowns
- Multi-asset support — options alongside stocks, bonds, crypto, and real estate in one view
- Tax reports — capital gains calculations with FIFO, LIFO, and average cost basis across 14+ jurisdictions
Research vs management: Market Chameleon answers "What should I trade based on volatility data?" AllInvestView answers "How is my portfolio performing and what do I owe in taxes?" These are fundamentally different questions requiring different tools.
Feature Comparison
| Feature | Market Chameleon | AllInvestView |
|---|---|---|
| Volatility analytics | ||
| Unusual activity detection | ||
| Earnings move analysis | ||
| Greeks dashboard | ||
| Position tracking | ||
| P&L analytics | ||
| Wheel strategy lifecycle | ||
| Roll chain tracking | ||
| Multi-asset portfolio | ||
| Tax reports | ||
| Affordable pricing |
Pricing Comparison
Market Chameleon pricing:
| Plan | Price | Key Features |
|---|---|---|
| Free | $0 | Limited data, basic screener |
| Premium | ~$40/month | Full volatility data, earnings analysis, unusual activity, advanced screener |
AllInvestView pricing:
| Plan | Price | Key Features |
|---|---|---|
| Free | $0 | Full tracking, limited holdings count |
| Pro | $5.99/month | Unlimited holdings, Greeks dashboard, wheel lifecycle, tax reports, broker sync |
| Lifetime | One-time payment | All Pro features forever, no recurring fees |
Market Chameleon costs approximately 7x more than AllInvestView per month. However, they serve different purposes. If you need both volatility research and portfolio tracking, the combined cost is approximately $46/month, or less with AllInvestView's lifetime option.
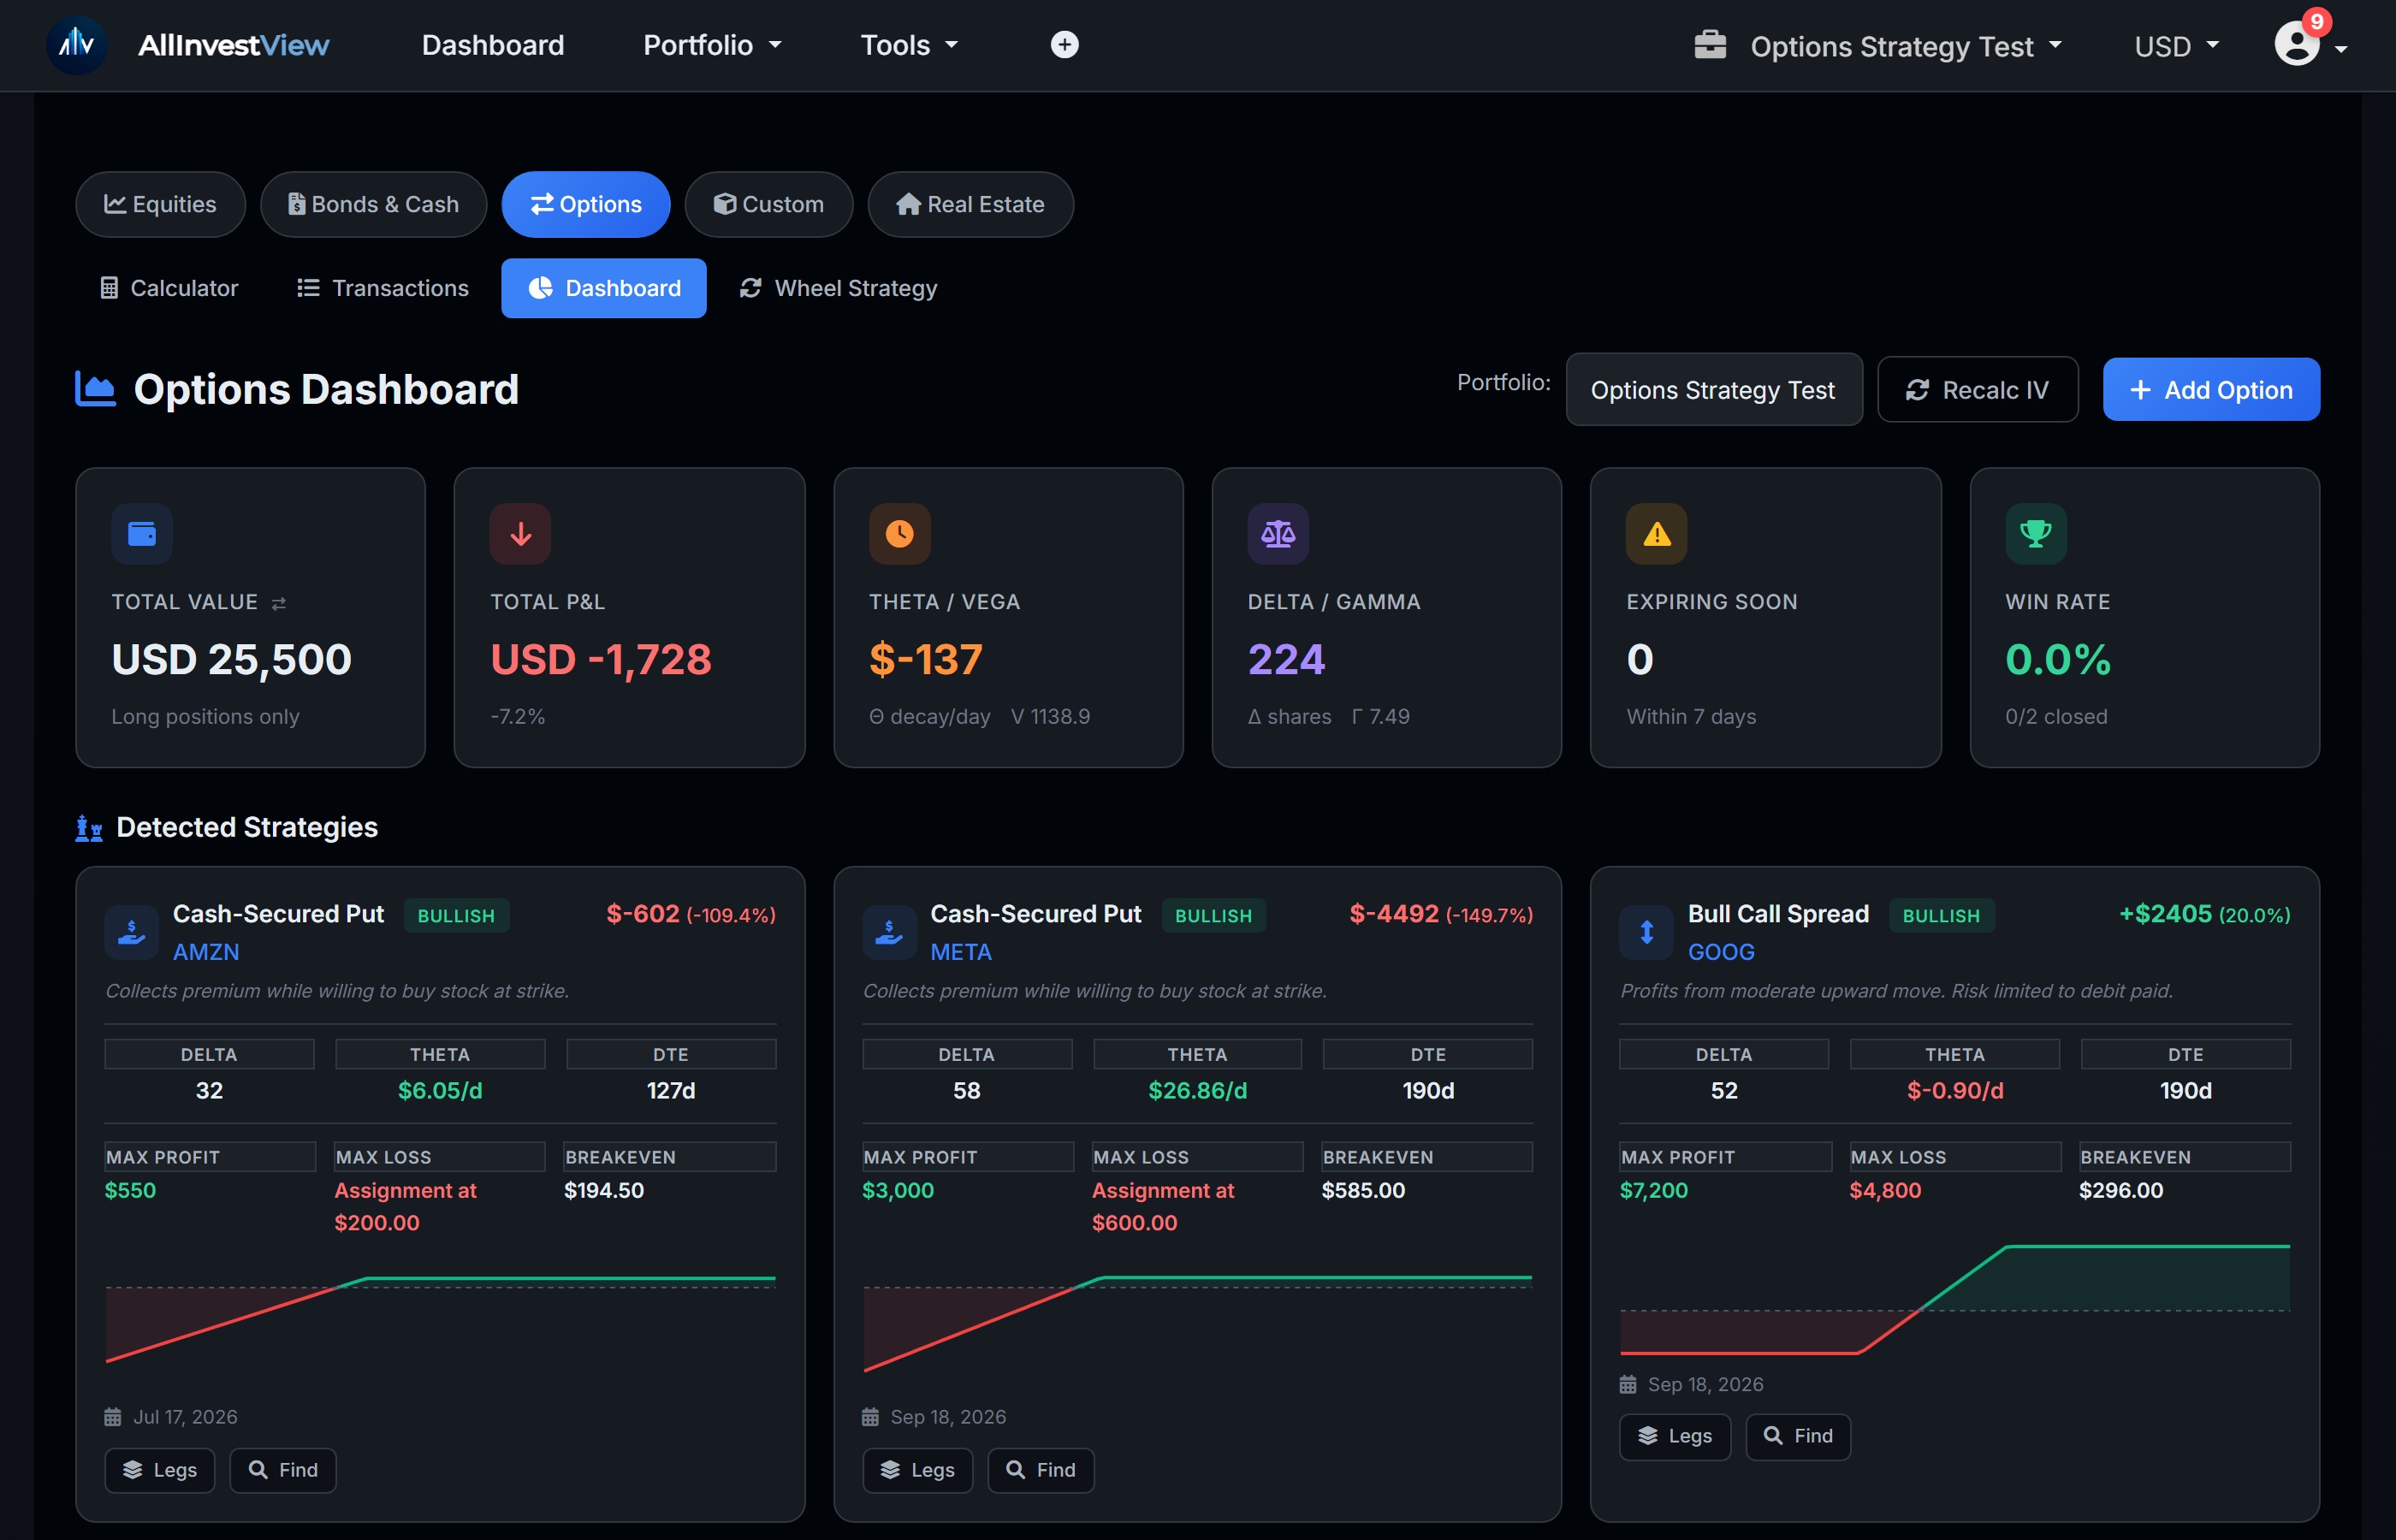
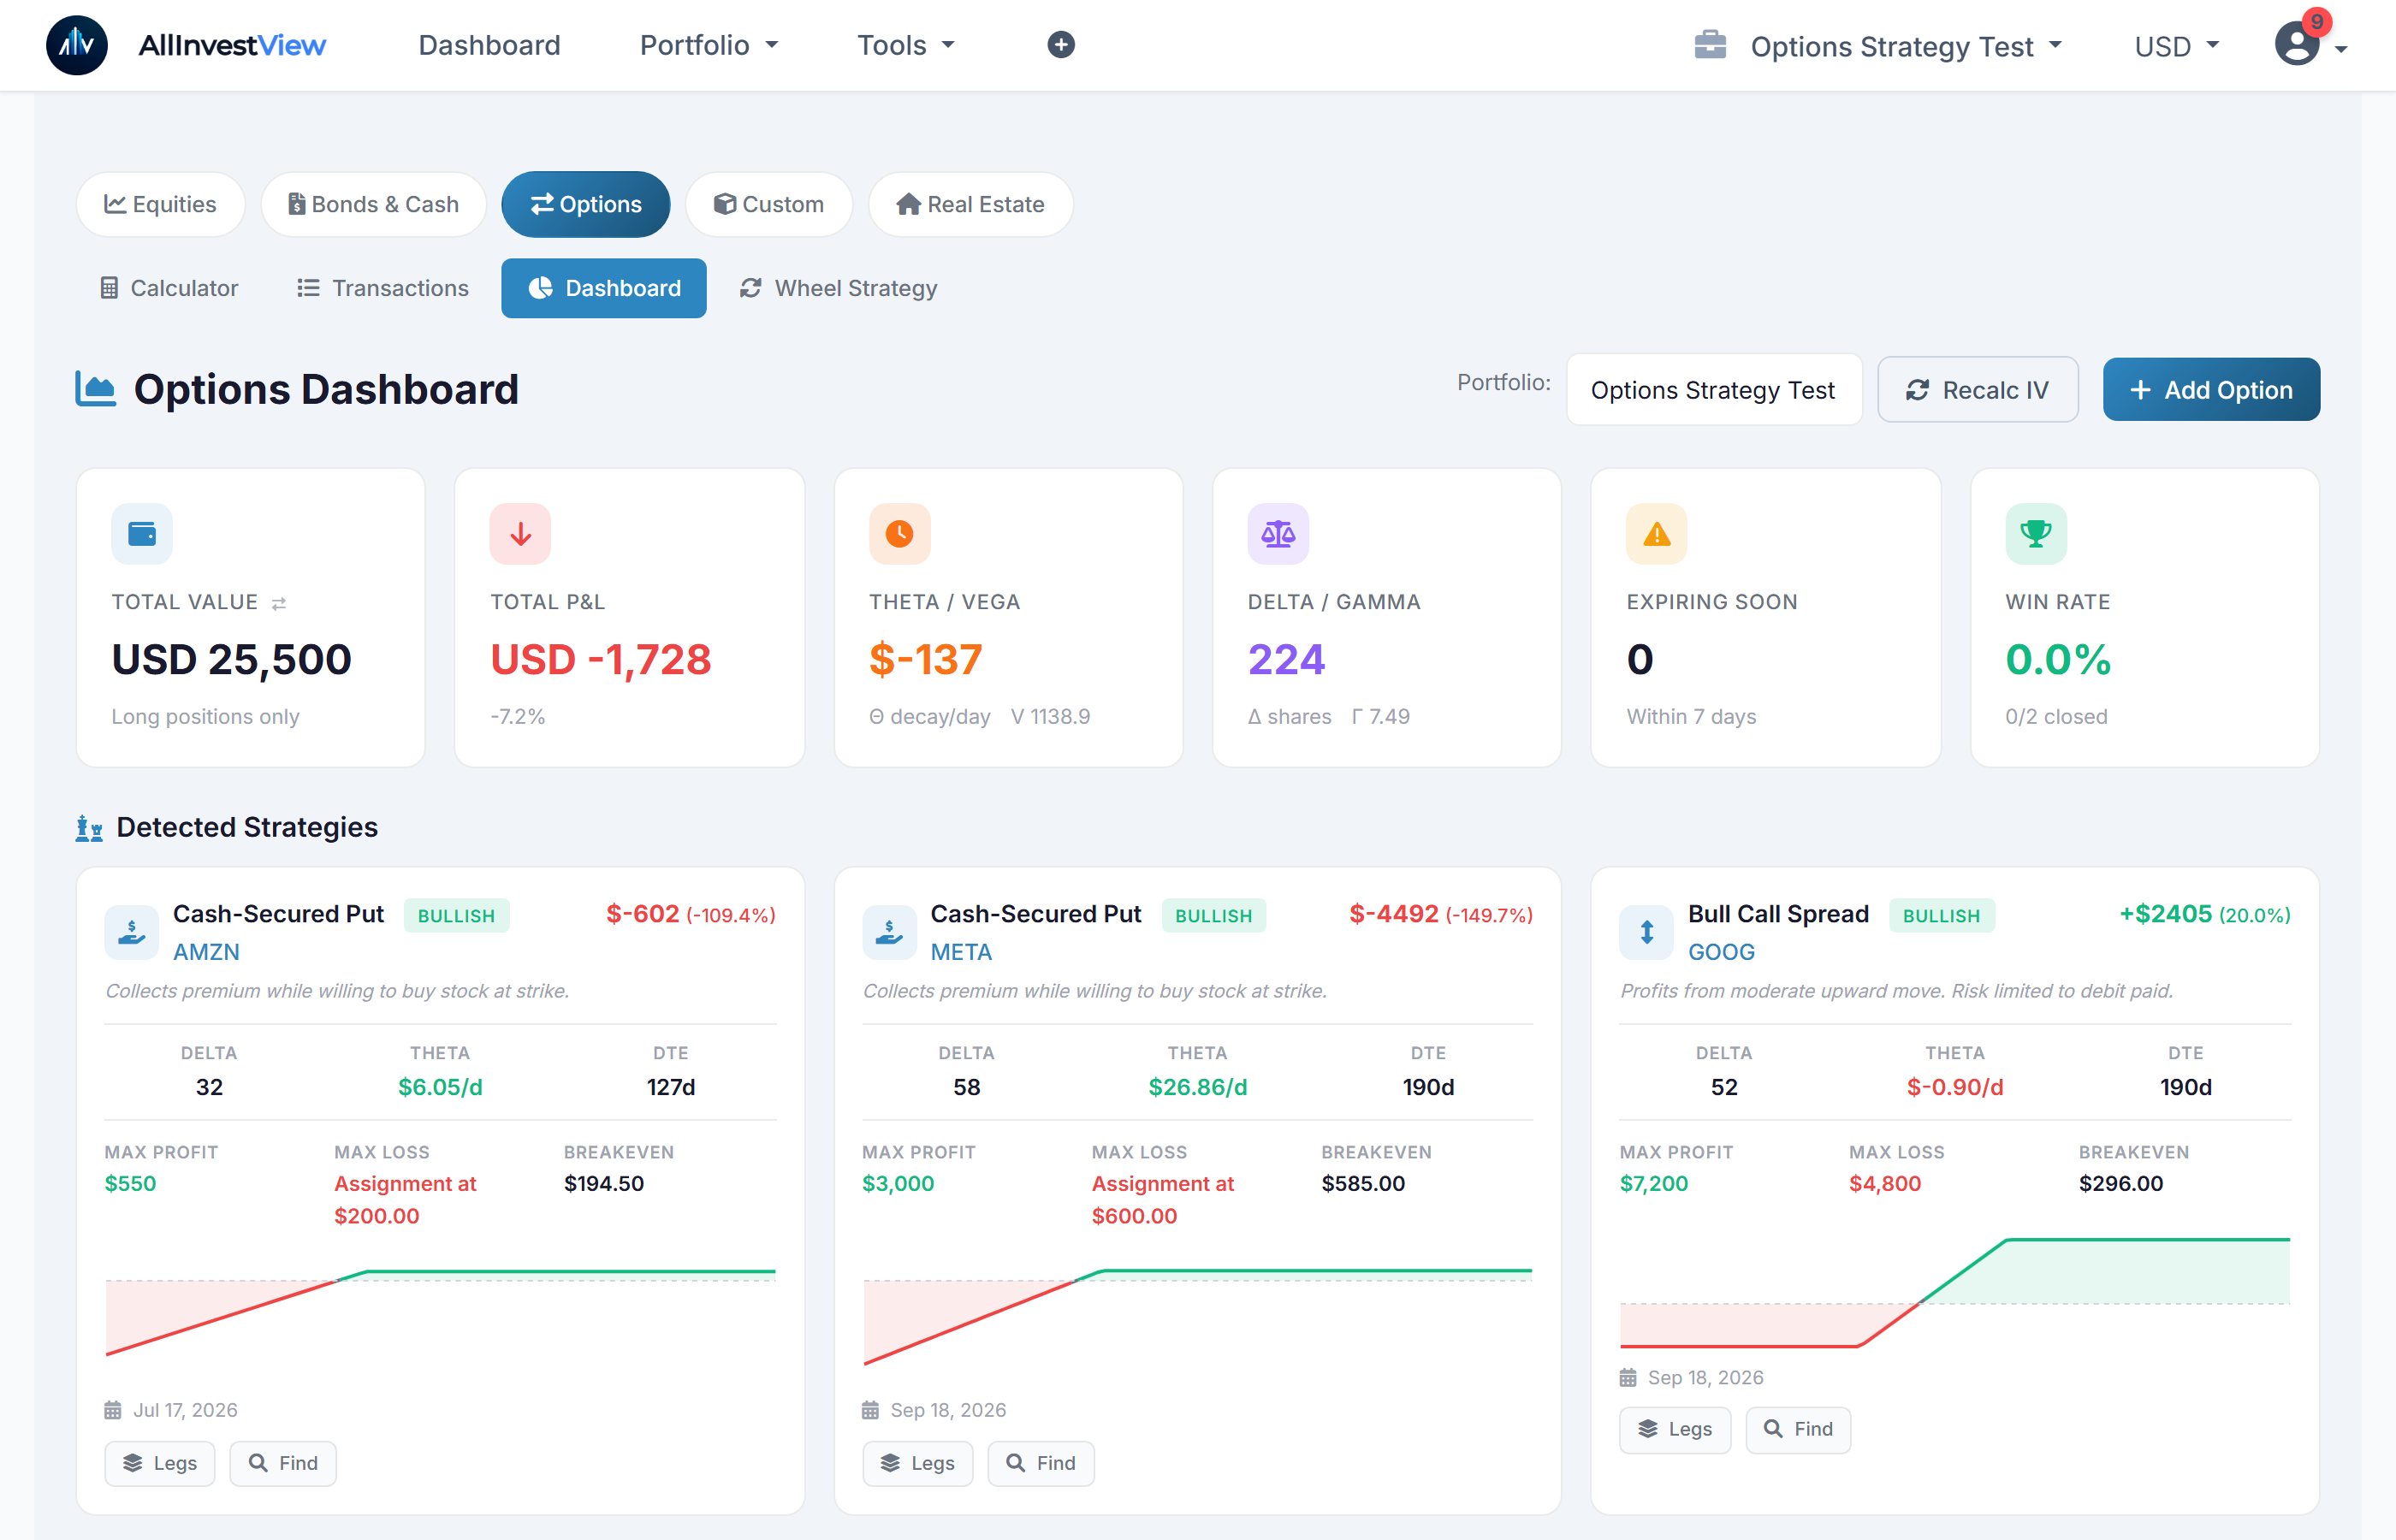
See the AllInvestView Options Dashboard
Strategy detection, Greeks, P&L and payoff diagrams — all in one view.
Explore More Options Tools & Guides
All options tools in one place
Track trades, Greeks & P&L
Calls, puts & Greeks explained
Delta, Gamma, Theta & Vega
Visualise profit & loss
CSP → assignment → covered calls
Income strategy analysis
Entry strategy analysis
Complete wheel walkthrough
AAPL, TSLA, NVDA & 50 more
Track Your Options Portfolio, Not Just Volatility
Greeks dashboard, wheel lifecycle, P&L analytics, roll chains, and tax reports. The portfolio tracking that volatility tools do not provide.
Which Should You Choose?
Choose Market Chameleon if:
- You make trading decisions based on volatility data
- You need earnings move predictions and historical accuracy data
- You want to screen for unusual options activity
- You already have a portfolio tracker for position management
Choose AllInvestView if:
- You need to track actual positions and calculate real P&L
- You want portfolio-level Greeks aggregation and monitoring
- You run the wheel strategy and need lifecycle management
- You need tax reports for your options trades
- You hold multiple asset classes beyond options
Bottom line: Market Chameleon is a research tool; AllInvestView is a management tool. Market Chameleon helps you find better trades through volatility analysis. AllInvestView helps you track, analyze, and report on the trades you make. For the most complete options trading workflow, consider using both.
Common Questions
Does Market Chameleon track positions?
Market Chameleon is primarily a data and analytics platform for volatility research, not a portfolio tracker. It does not maintain a record of your positions, calculate actual P&L, track cost basis, or generate tax reports. For position tracking and portfolio management, you need a dedicated tracker like AllInvestView.
Can AllInvestView analyze volatility?
AllInvestView calculates implied volatility for your option positions using the Black-Scholes model and tracks how IV changes over time. However, it does not provide the depth of volatility analytics that Market Chameleon offers, such as volatility cones, term structure analysis, or historical vs implied volatility comparisons across thousands of tickers.
Which has better Greeks?
Market Chameleon provides theoretical Greeks for any options chain. AllInvestView provides Greeks for your actual positions and aggregates them at the portfolio level, showing how your total delta, gamma, theta, and vega exposure evolves over time. For research, Market Chameleon has broader data. For managing your portfolio risk, AllInvestView is more practical.
Are they complementary tools?
Yes, Market Chameleon and AllInvestView serve different phases of the trading process and work well together. Use Market Chameleon for pre-trade volatility research, earnings analysis, and unusual activity detection. Use AllInvestView to track the positions you open, monitor P&L, manage wheel cycles, and generate tax reports at year-end.