What Are Options?
An option is a contract that gives you the right, but not the obligation, to buy or sell a stock at a specific price (strike price) before a specific date (expiration). You pay a premium for this right.
Think of options like insurance. You pay a small premium for the right to take action if certain conditions are met. If they're not, you let the option expire worthless - your maximum loss is the premium paid.
Key Options Terms
Strike Price: The price at which you can buy/sell the stock
Expiration: The last day the option is valid
Premium: The price you pay for the option
Contract: A standard US stock option usually represents 100 shares
Call Options vs Put Options
Call Option
A call gives you the right to buy a stock at the strike price. At expiration, you profit above the strike price plus the premium paid.
- Buy calls when you're bullish
- Max loss = premium paid
- Max profit = unlimited (theoretically)
- Breakeven = strike + premium
Put Option
A put gives you the right to sell a stock at the strike price. At expiration, you profit below the strike price minus the premium paid.
- Buy puts when you're bearish
- Max loss = premium paid
- Max profit = strike - premium (stock to $0)
- Breakeven = strike - premium
Example: Buying a Call Option
In this example, Apple (AAPL) trades at $180. You buy one call contract:
| Strike Price | $185 |
| Expiration | 30 days |
| Premium | $3.00 per share ($300 total) |
| Breakeven | $188 ($185 + $3) |
At expiration, if AAPL is $180: The option expires worthless = -$300 loss (premium paid).
The Greeks Explained
The Greeks measure different dimensions of risk in options positions. Understanding them is essential for managing your trades.
Delta
Price sensitivity. How much the option moves per $1 stock move.
Gamma
Delta's rate of change. How fast delta changes.
Theta
Time decay. How much value lost each day.
Vega
Volatility sensitivity. Impact of volatility changes.
Delta (Δ) - Direction Risk
Delta tells you how much the option price changes for every $1 move in the stock. A call with 0.50 delta moves $0.50 for every $1 the stock moves.
- Calls: Delta ranges from 0 to +1
- Puts: Delta ranges from -1 to 0
- At-the-money options: Around +0.50 for calls and -0.50 for puts
- Deep in-the-money: Approaches +1 for calls and -1 for puts
Theta (Θ) - Time Decay
Theta measures how much value the option loses each day. Options are "wasting assets" - they lose value as expiration approaches, especially in the final weeks.
Time Decay Accelerates
Time decay often accelerates near expiration for at-the-money options. A stock can move in your favor while your option loses value because too much time has passed. Compare the expiry date as carefully as the strike.
Vega (V) - Volatility Impact
Vega measures sensitivity to implied volatility (IV). When IV increases, all options become more valuable (both calls and puts). When IV decreases, options lose value.
How Options Are Priced
Option prices have two components:
- Intrinsic Value: The real value if exercised now (stock price - strike for calls)
- Extrinsic Value: Time value + volatility premium
Out-of-the-money options have zero intrinsic value - you're only paying for time and volatility. As expiration approaches, extrinsic value decays to zero.
Beginner Strategies
1. Covered Calls (Income Generation)
Own 100 shares of a stock, sell a call against them. You collect premium income, but cap your upside if the stock rises above the strike.
Covered Call Example
Own 100 AAPL at $180. Sell a $190 call for $2. If AAPL stays below $190, you keep the $200 premium. If it rises above $190, you sell at $190 + keep premium.
2. Protective Puts (Portfolio Insurance)
Own stock, buy puts to protect against downside. It's like buying insurance on your portfolio.
3. Long Calls (Bullish Leverage)
Buy calls to gain leveraged upside exposure with limited downside (premium paid). Good for high-conviction bullish bets.
Risks & Common Mistakes
Options Can Expire Worthless
You can lose the entire premium on an option you buy. A small move in the stock can produce a much larger percentage change in the option, so decide how much you can afford to lose before opening a position.
Common Beginner Mistakes
- Ignoring time decay: Buying options too close to expiration
- Overpaying for volatility: Buying when IV is elevated (before earnings)
- Position sizing: Risking too much on a single trade
- No exit plan: Holding losers hoping for a reversal
- Selling uncovered options: Naked calls have unlimited potential losses; short puts can also create substantial losses
From Theory to Your Options Dashboard
A useful trade record connects the idea you started with to what happened next. Keep the entry premium and expiry beside the position's P&L, then use the Greeks to understand why its value is changing. AllInvestView brings those numbers together with the stocks you already own.
See which positions need your attention
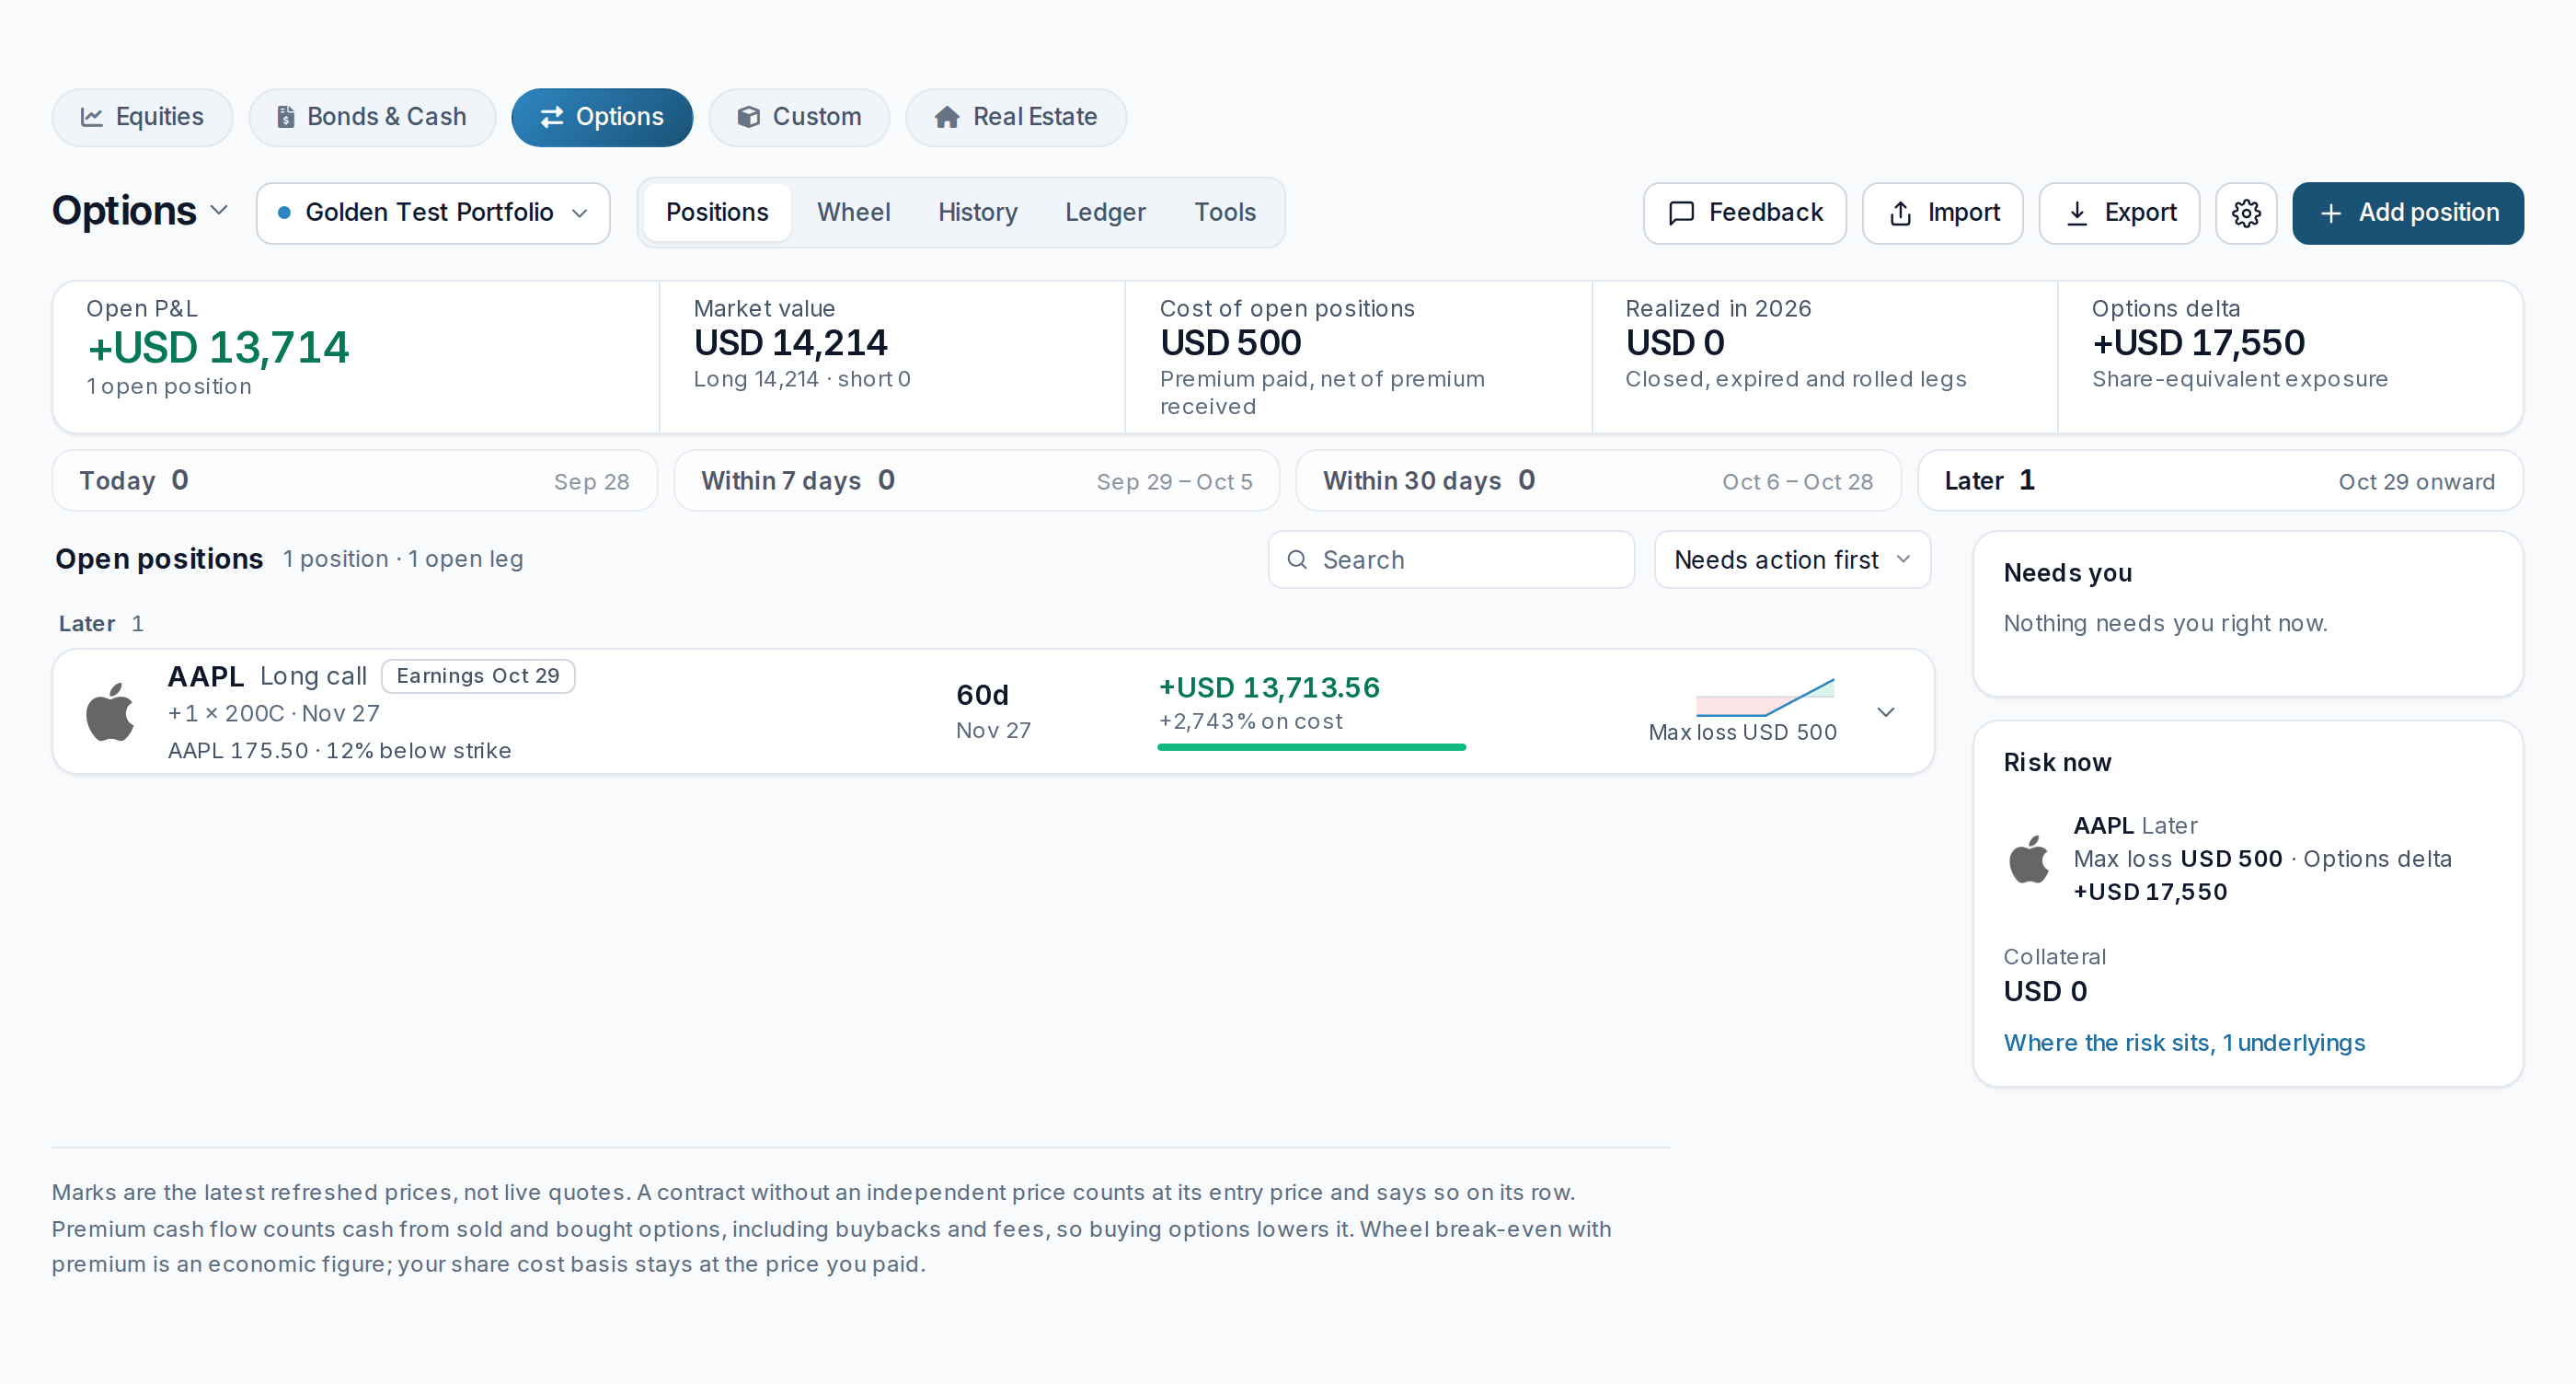
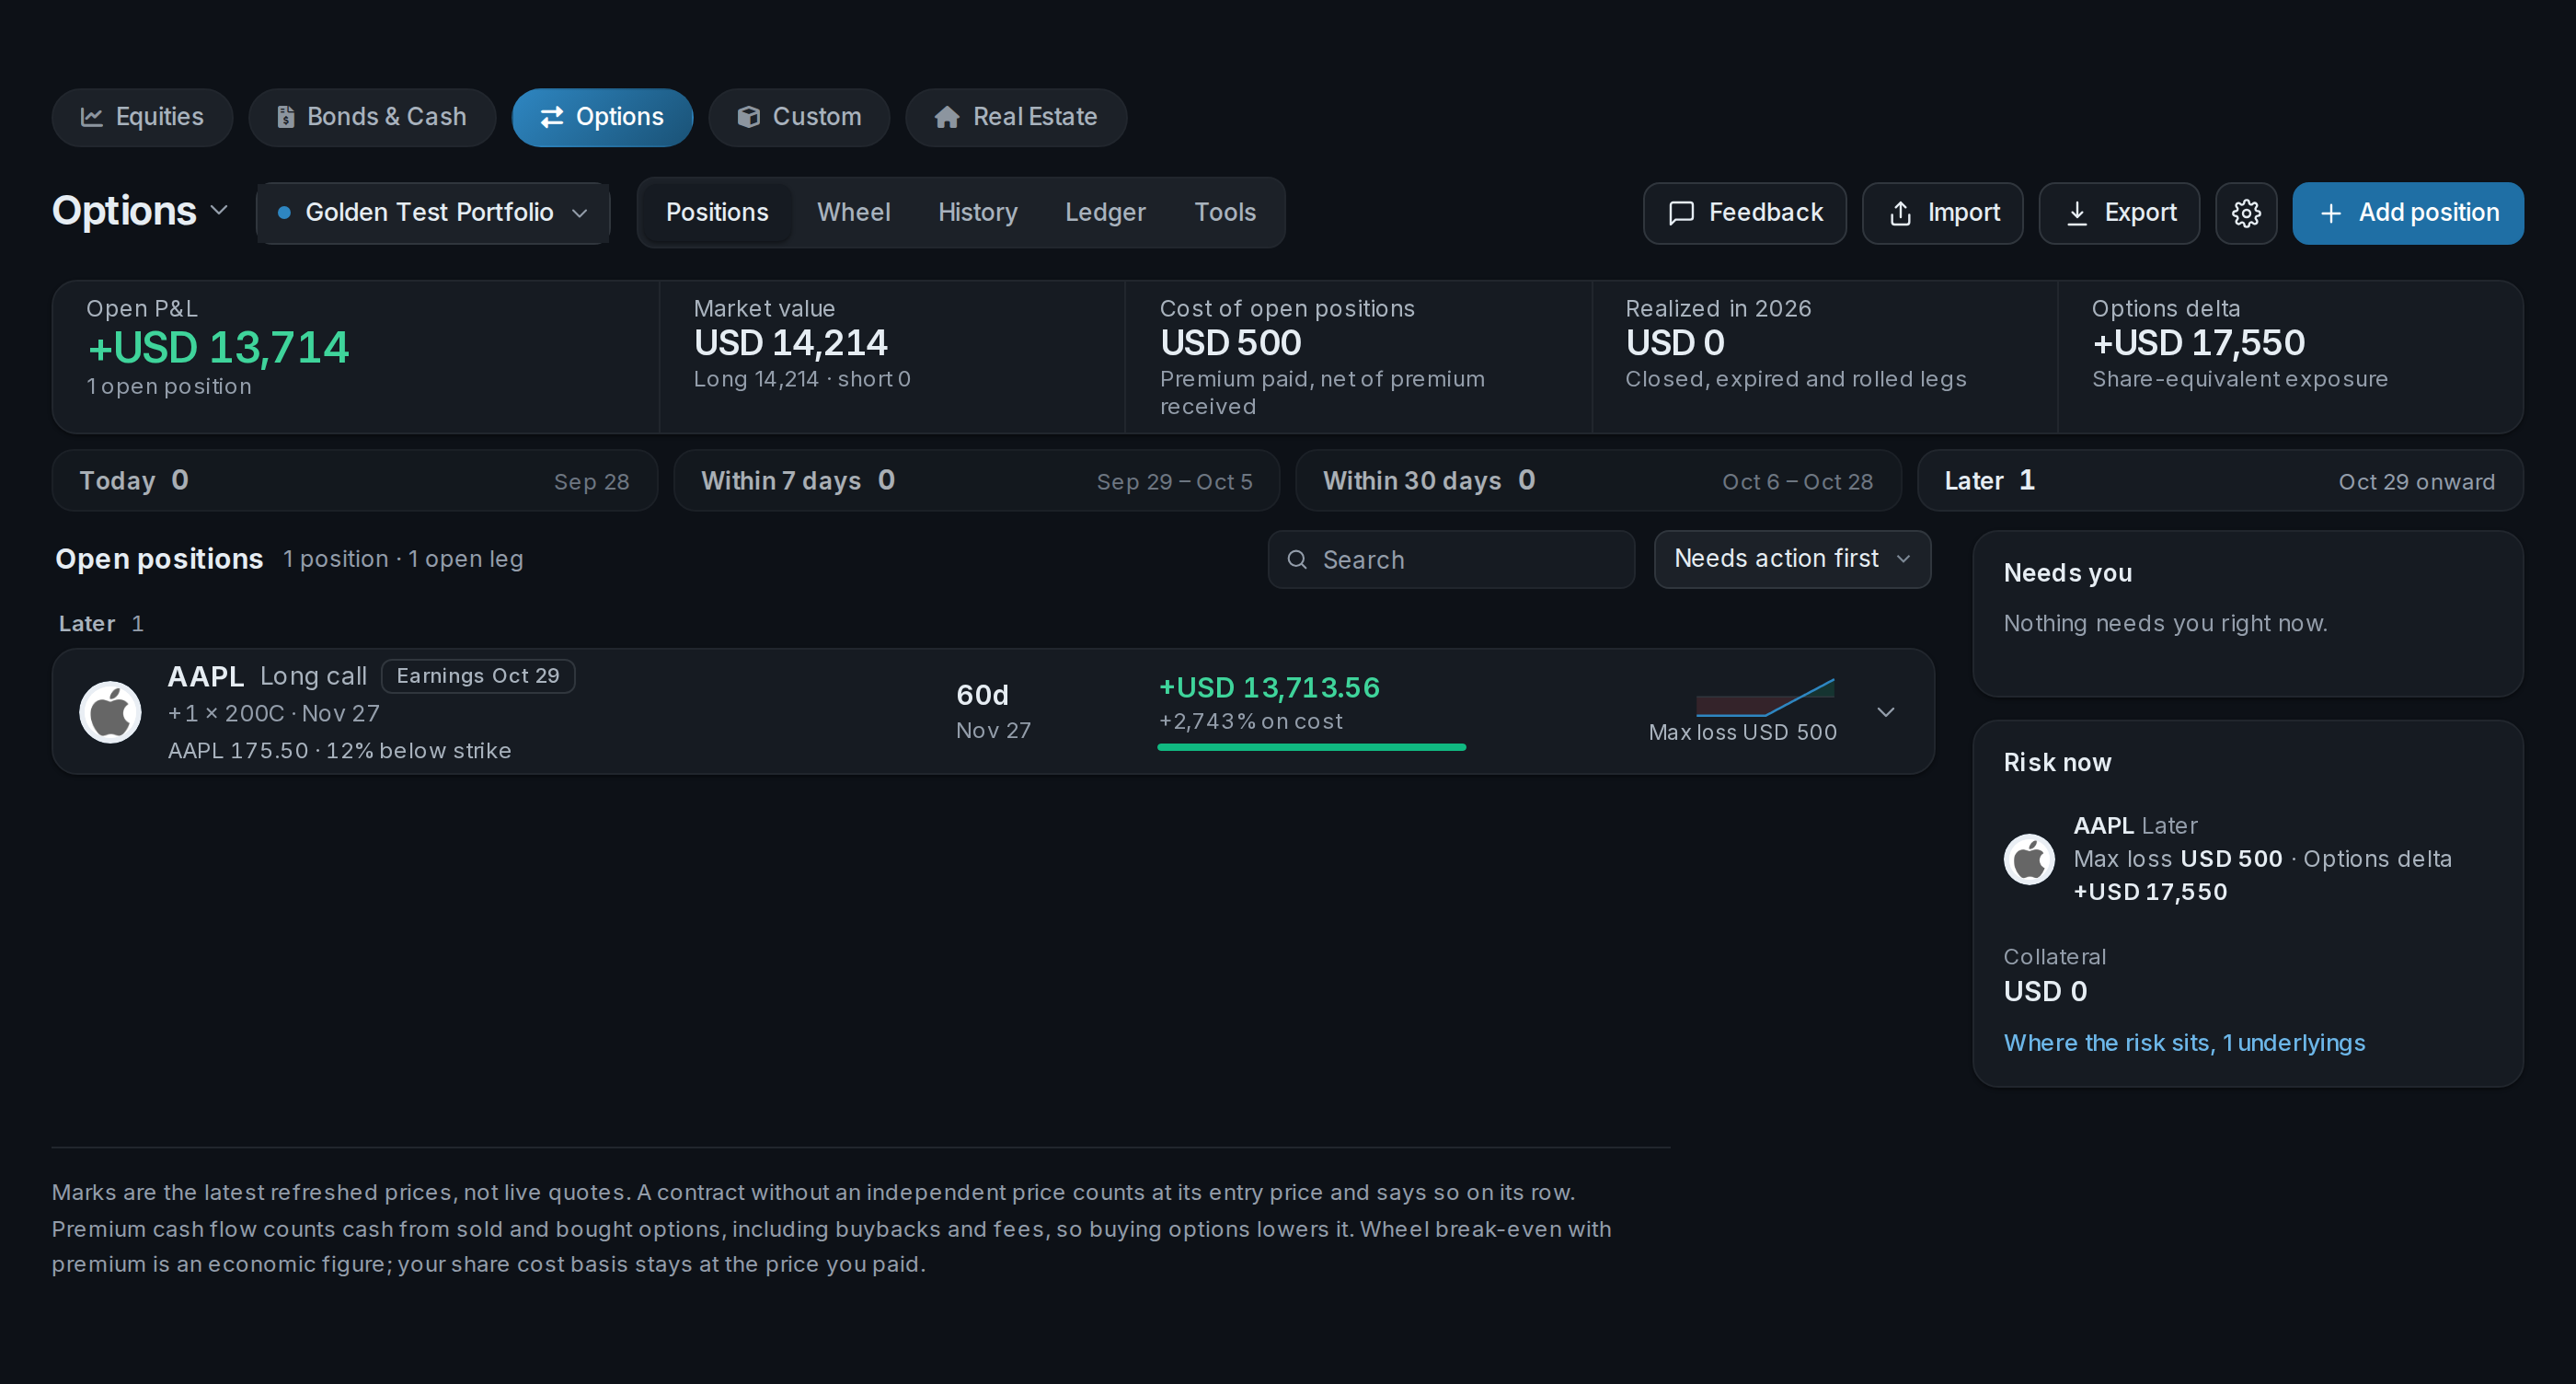
The options dashboard groups your open trades by expiry and puts portfolio totals above the position table. You can review a contract's Greeks and see where risk is concentrated by underlying, without rebuilding a spreadsheet each time a trade changes.
For the AAPL call example, delta helps explain the effect of a price move; theta explains the cost of waiting. Watching both is more useful than watching the stock price alone.
 AllInvestView
 Open full-size dashboard
 Open full-size dashboard
Read the payoff before opening a strategy
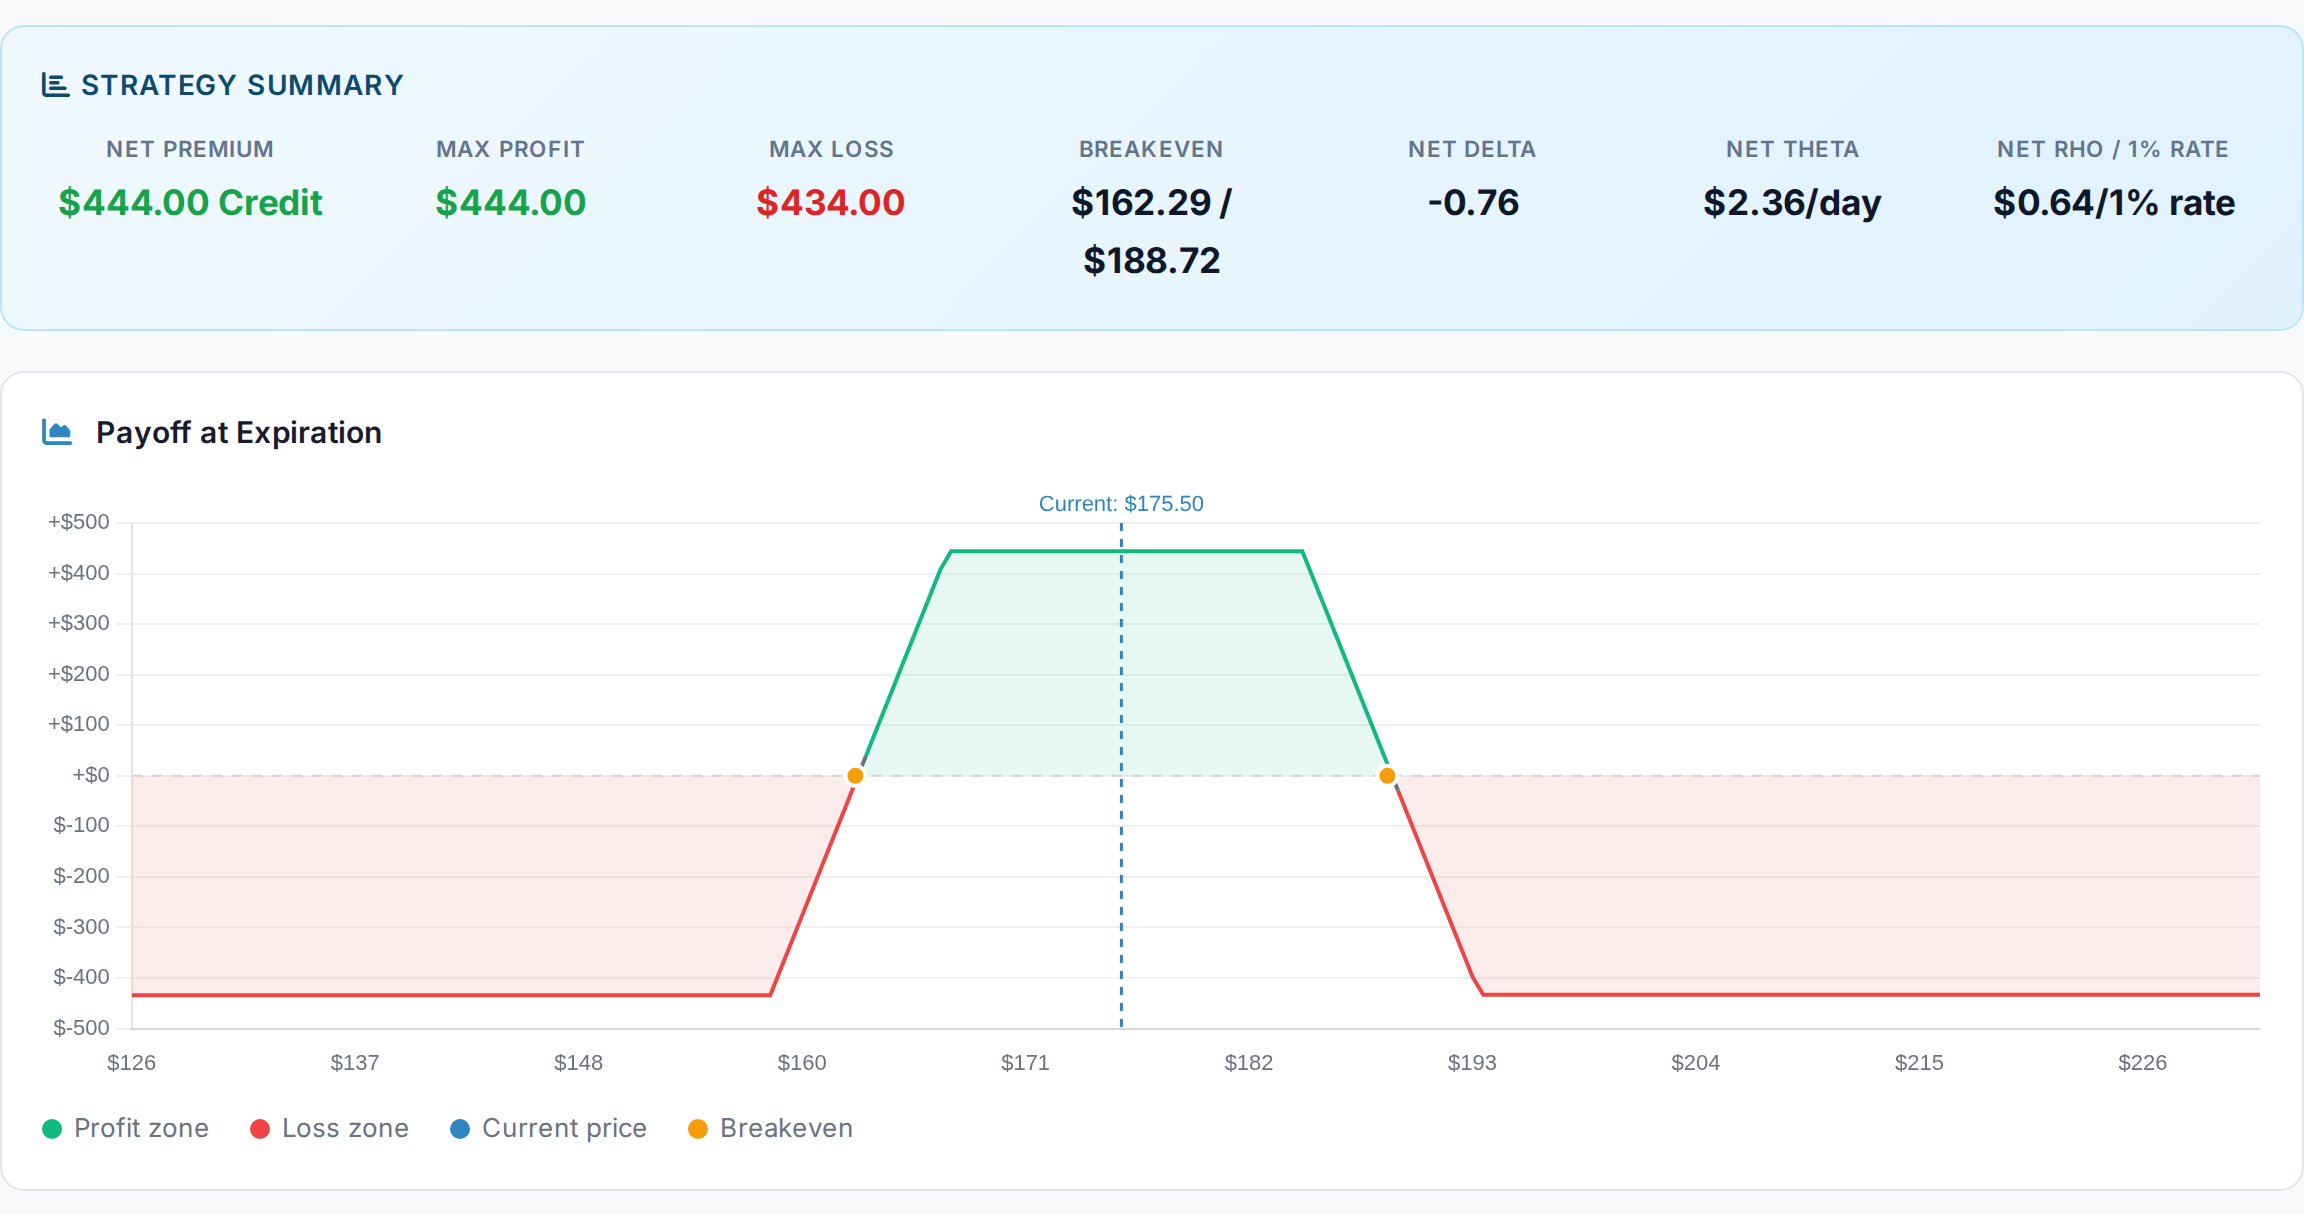
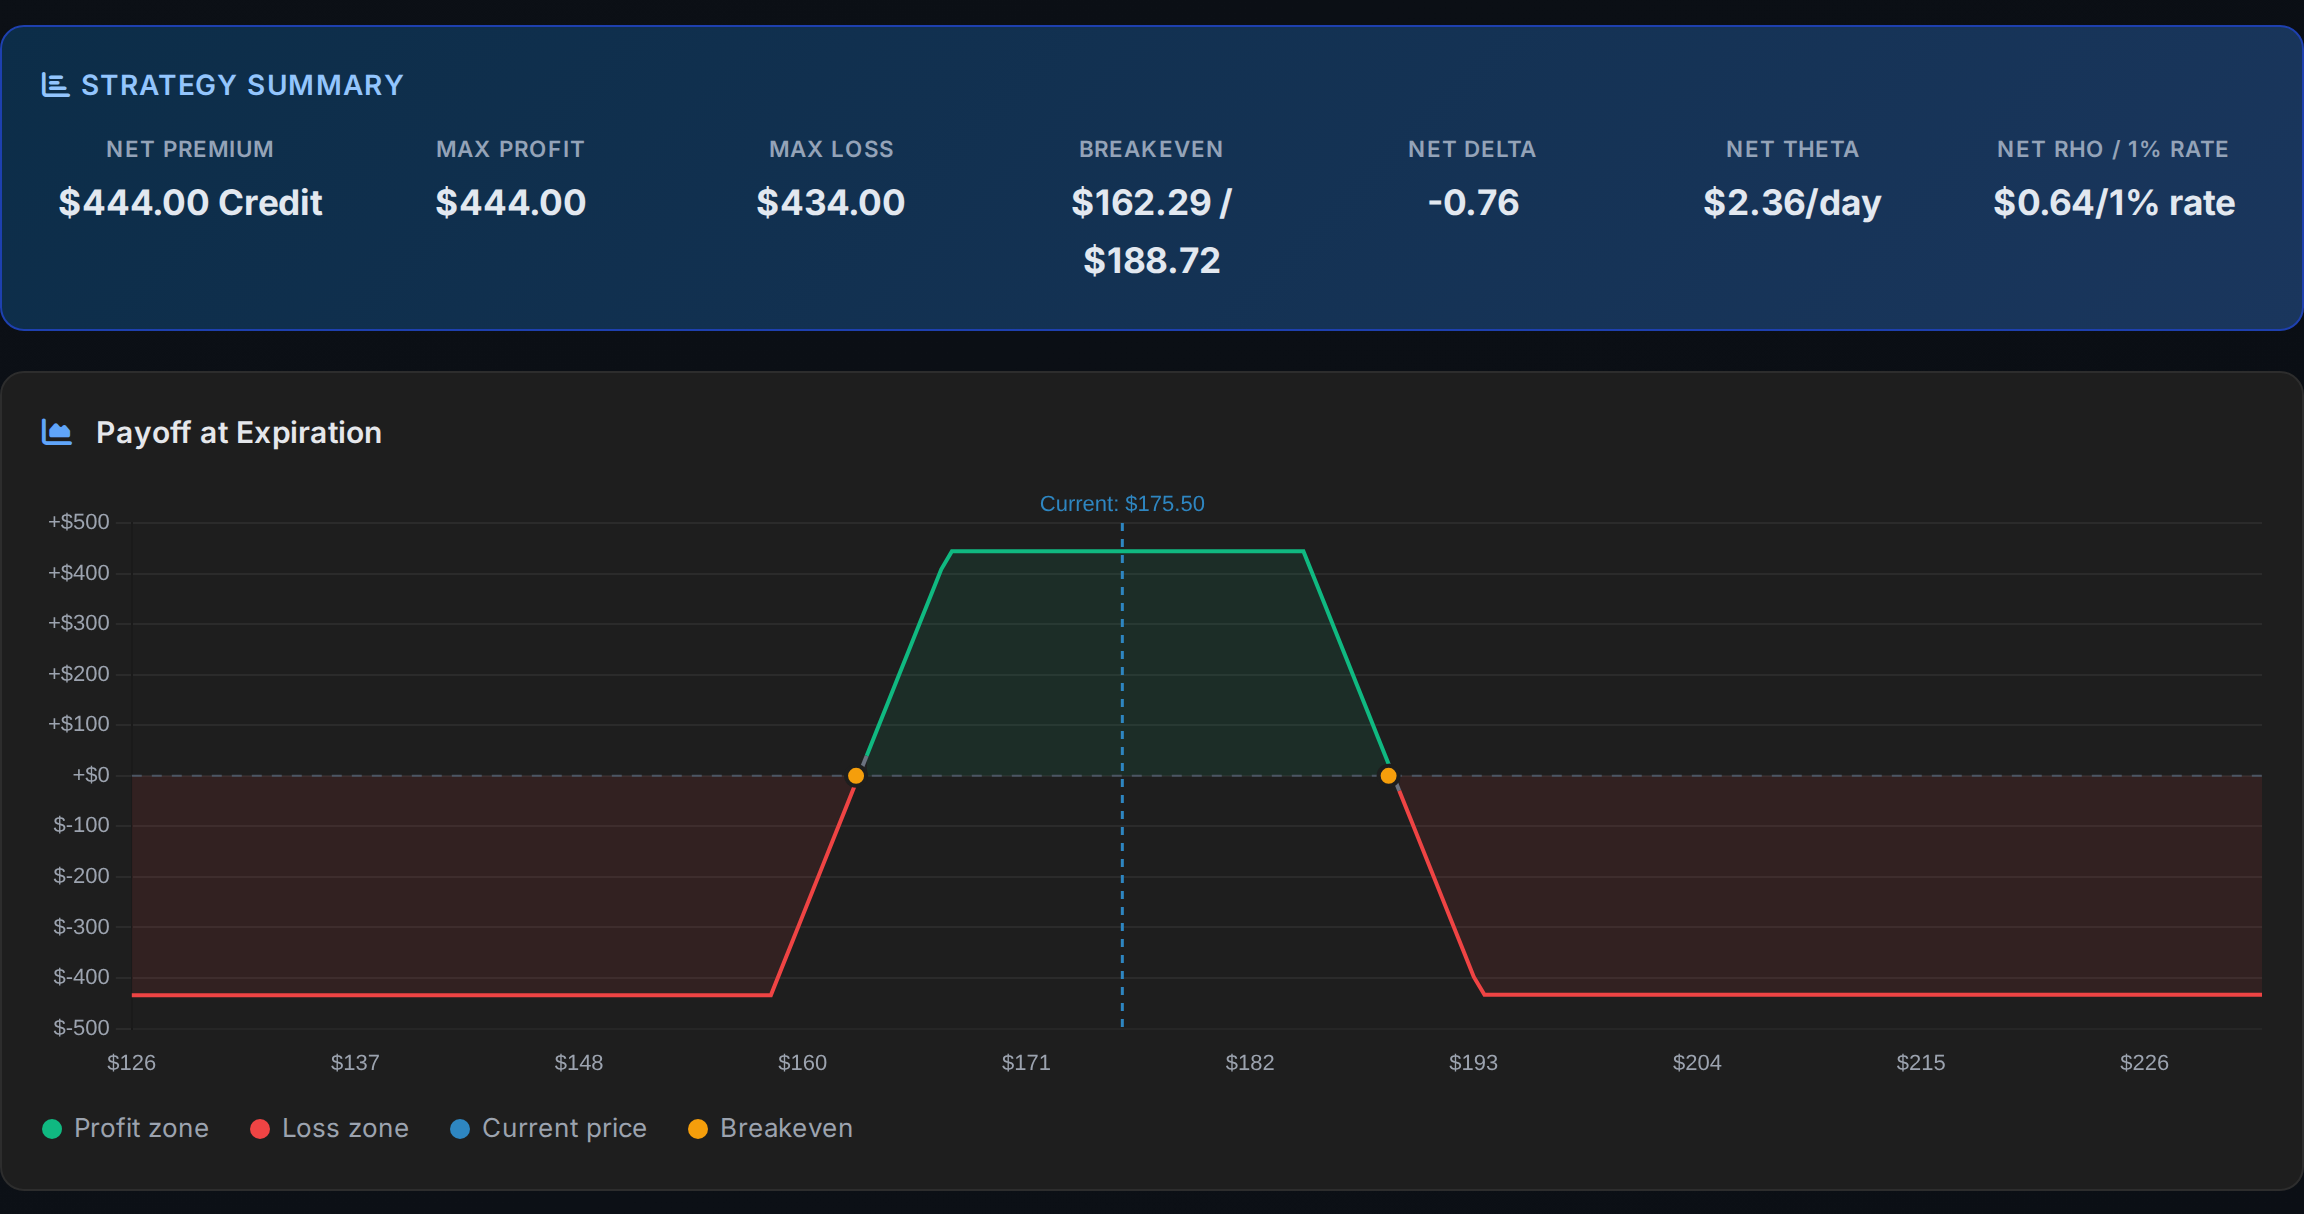
Once you're comfortable with a single call or put, the Strategy Builder lets you compare multi-leg positions. It calculates the combined Greeks and draws the expiration payoff, with maximum profit, maximum loss and breakeven prices together.
In this Iron Condor example, the flat top marks the maximum-profit range. The two orange points show where the position breaks even; beyond the sloping sides, the losses reach their limit. That shape makes the trade-off clear: the position needs the stock to stay within a range, rather than simply rise.
AllInvestView
 Open full-size payoff chart
 Open full-size payoff chart
An expiration chart doesn't tell you the whole story before expiry. AllInvestView's scenario tools also let you change the stock price, volatility and time remaining to explore how the position might respond. Start with a single contract in the options calculator, then compare a strategy when you're ready.
Follow an income trade through assignment
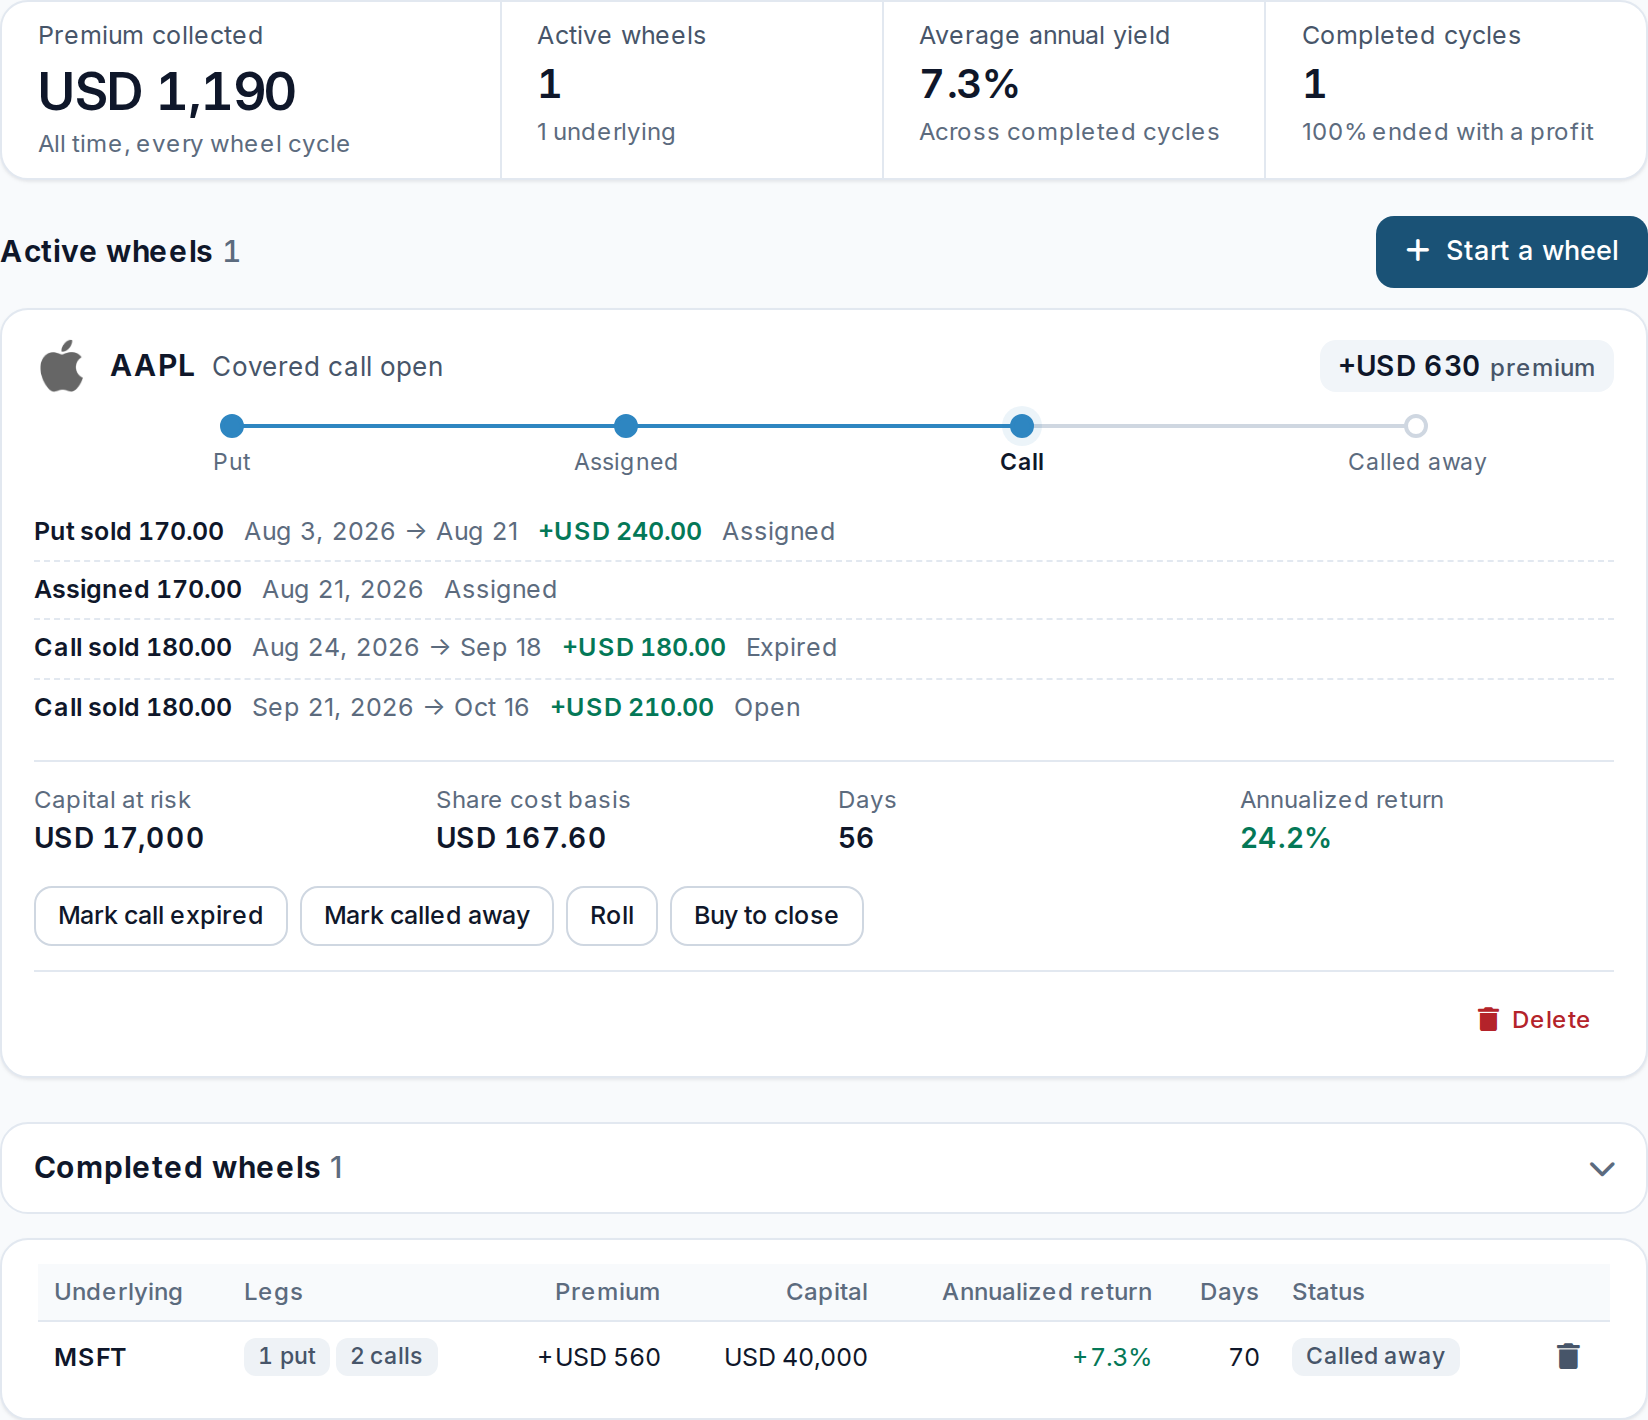
For covered-call and cash-secured-put traders, the stock and the option belong in the same story. A put assignment creates a share position; a later covered call can expire, be closed or result in those shares being called away.
The Wheel view keeps that sequence together. In the AAPL example, the timeline follows a sold put through assignment and two covered calls, with premiums alongside each trade. You can see which call is still open and review completed cycles separately.
AllInvestView
 Open full-size Wheel timeline
 Open full-size Wheel timeline
Explore the Wheel tracker for the full lifecycle, or see the options tracker for imports, trade history and portfolio analysis.
Frequently Asked Questions
Put Your Options Trades in Context
See your options P&L, Greeks and upcoming expiries alongside your stocks. Compare a strategy before you open it, then follow the trade through to its result.
Start Your Free Trial14 days, no card required. Options tracking is included on Starter and above after the trial. Compare plans.
Explore More Options Tools & Guides
All options tools in one place
Track trades, Greeks & P&L
Calls, puts & Greeks explained
Delta, Gamma, Theta & Vega
Visualise profit & loss
CSP → assignment → covered calls
Income strategy analysis
Entry strategy analysis
Complete wheel walkthrough
AAPL, TSLA, NVDA & 50 more
Further reading: FINRA's options overview and the Options Industry Council's long call guide. Educational examples exclude fees and taxes.