1. Home
  2. Dividend tracker
  3. Dividend calculator

Dividend Calculator with DRIP

Enter what you invest and the dividend it pays. See your income a year, a month and per payment, and what reinvesting does to it over time.

Your investment

Start with
$
Enter an amount up to 1,000,000,000.
Dividend as
%
Between 0% and 50%.
Projection settings20 years, $100/month, DRIP on

Each payment buys more shares at that month's price, fractions included.

20 years
%
Between -50% and 50%.
%
Between -50% and 50%.

Yearly rates. The dividend rises once a year and the price a little every month.

$
Up to 1,000,000 a month.
%
Between 0% and 99%.

Your dividend income today

$400.00

a year
A month
$33.33
Per payment
$100.00
Yield
4.00%

After 20 years, reinvesting

Income in year 20
 
 
Portfolio value
 
 
Total dividends
 
 
Yield on cost
 
income ÷ money paid in


  • Income, reinvesting
  • Taking the cash
Year by year projection
YearIncomeA monthValuePaid inYield on cost

Figures follow the rates you enter and keep them steady every year. Real dividends get cut as well as raised, and prices move around far more than a straight line.

Worked example: 200 shares at $50, reinvesting for 10 years

The inputs

You own 200 shares bought at $50, so $10,000 invested. The company pays $2.00 a share a year in four quarterly payments, a 4% yield. You add $100 a month, reinvest every dividend, and assume the dividend grows 5% a year and the price 4%.

  1. Income today: 200 × $2.00 = $400 a year, $100 a quarter, $33.33 a month.
  2. First payment, month 3: by then the first two $100 additions have bought 3.98 shares, so 203.98 shares earn $0.50 each, $101.99. At a price of $50.49 that buys 2.02 more shares.
  3. Year 2: the dividend rises to $2.10 a share, and every share bought so far earns it.

Where it ends up in year 10

Income in year 10
$1,636.00
A month
$136.33
Value
$40,624

You paid in $22,000 over the ten years and collected $9,580.39 in dividends, all of it turned into shares. You now hold 548.88 shares, and year 10 income is 7.44% of what you put in.

Take the dividends as cash instead and year 10 pays $1,212.19, with a portfolio worth $29,472. Reinvesting adds $423.81 a year of income by year 10, and the gap keeps widening after that.

How the dividend calculator works

Today's income is the simple part. It's what you hold times what each share pays.

Annual income = shares × dividend per share = amount invested × yield
Per payment = annual income ÷ payments a year
A month = annual income ÷ 12

The projection runs month by month. In year n the dividend per share is the starting dividend raised by your growth rate once a year, and the share price grows evenly so that it rises by your price growth rate over twelve months.

Dividend per share in year n = D × (1 + g)n − 1
Price after m months = P × (1 + p)m ÷ 12
With DRIP, new shares = dividend after tax ÷ price that month

  • A payment is the shares you hold that month times the year's dividend per share, divided by the number of payments a year.
  • Your monthly addition buys shares at the month's price after any dividend is paid, so it starts earning at the next payment.
  • Yield on cost is the year's income divided by everything you paid in, which is the starting amount plus your additions. Reinvested dividends don't count as money paid in.
  • With a tax rate entered, every income figure is after that tax, and only the after-tax amount is reinvested.

Dividend calculator questions

How do I calculate dividend income?

Multiply the amount invested by the dividend yield, or the number of shares by the annual dividend per share. $10,000 at a 4% yield pays $400 a year. Paid quarterly, that is $100 a payment, or about $33 a month.

What is a DRIP?

A dividend reinvestment plan uses each dividend to buy more shares of the same stock or fund, usually including fractions of a share. The new shares earn dividends at the next payment, so your income grows even if the company never raises its dividend.

How much do I need invested to earn $1,000 a month in dividends?

Divide the $12,000 a year you want by the yield. At 3% you need $400,000, at 4% $300,000 and at 6% $200,000. Higher yields need less money up front and often come with slower dividend growth.

Does payment frequency change how much I earn?

Taking dividends in cash gives the same yearly income from the same shares. Reinvesting makes payment frequency matter even in year one, because earlier payments buy shares that earn later dividends. Start with $10,000 at a 4% yield, 5% dividend growth and 4% price growth, with no additions or tax: monthly reinvestment pays $2,324 in year 20, compared with $2,208 from annual payments.

What dividend growth rate should I use?

Start from the stock or fund's own record: the average yearly rise in its dividend per share over the last 5 or 10 years. Then run a lower rate too, because past raises are not guaranteed, and see how much of your plan depends on them.

Are reinvested dividends taxed?

In a taxable account, yes. They are taxed in the year they are paid, the same as dividends taken in cash, and the shares they buy add to your cost basis. Enter your rate and the calculator reinvests what is left after tax.

What is yield on cost?

Your yearly dividend income divided by the money you put in. A holding bought at a 4% yield whose dividend doubles pays 8% on what you paid, even if the yield quoted today is still around 4%.

Now track the dividends you actually get

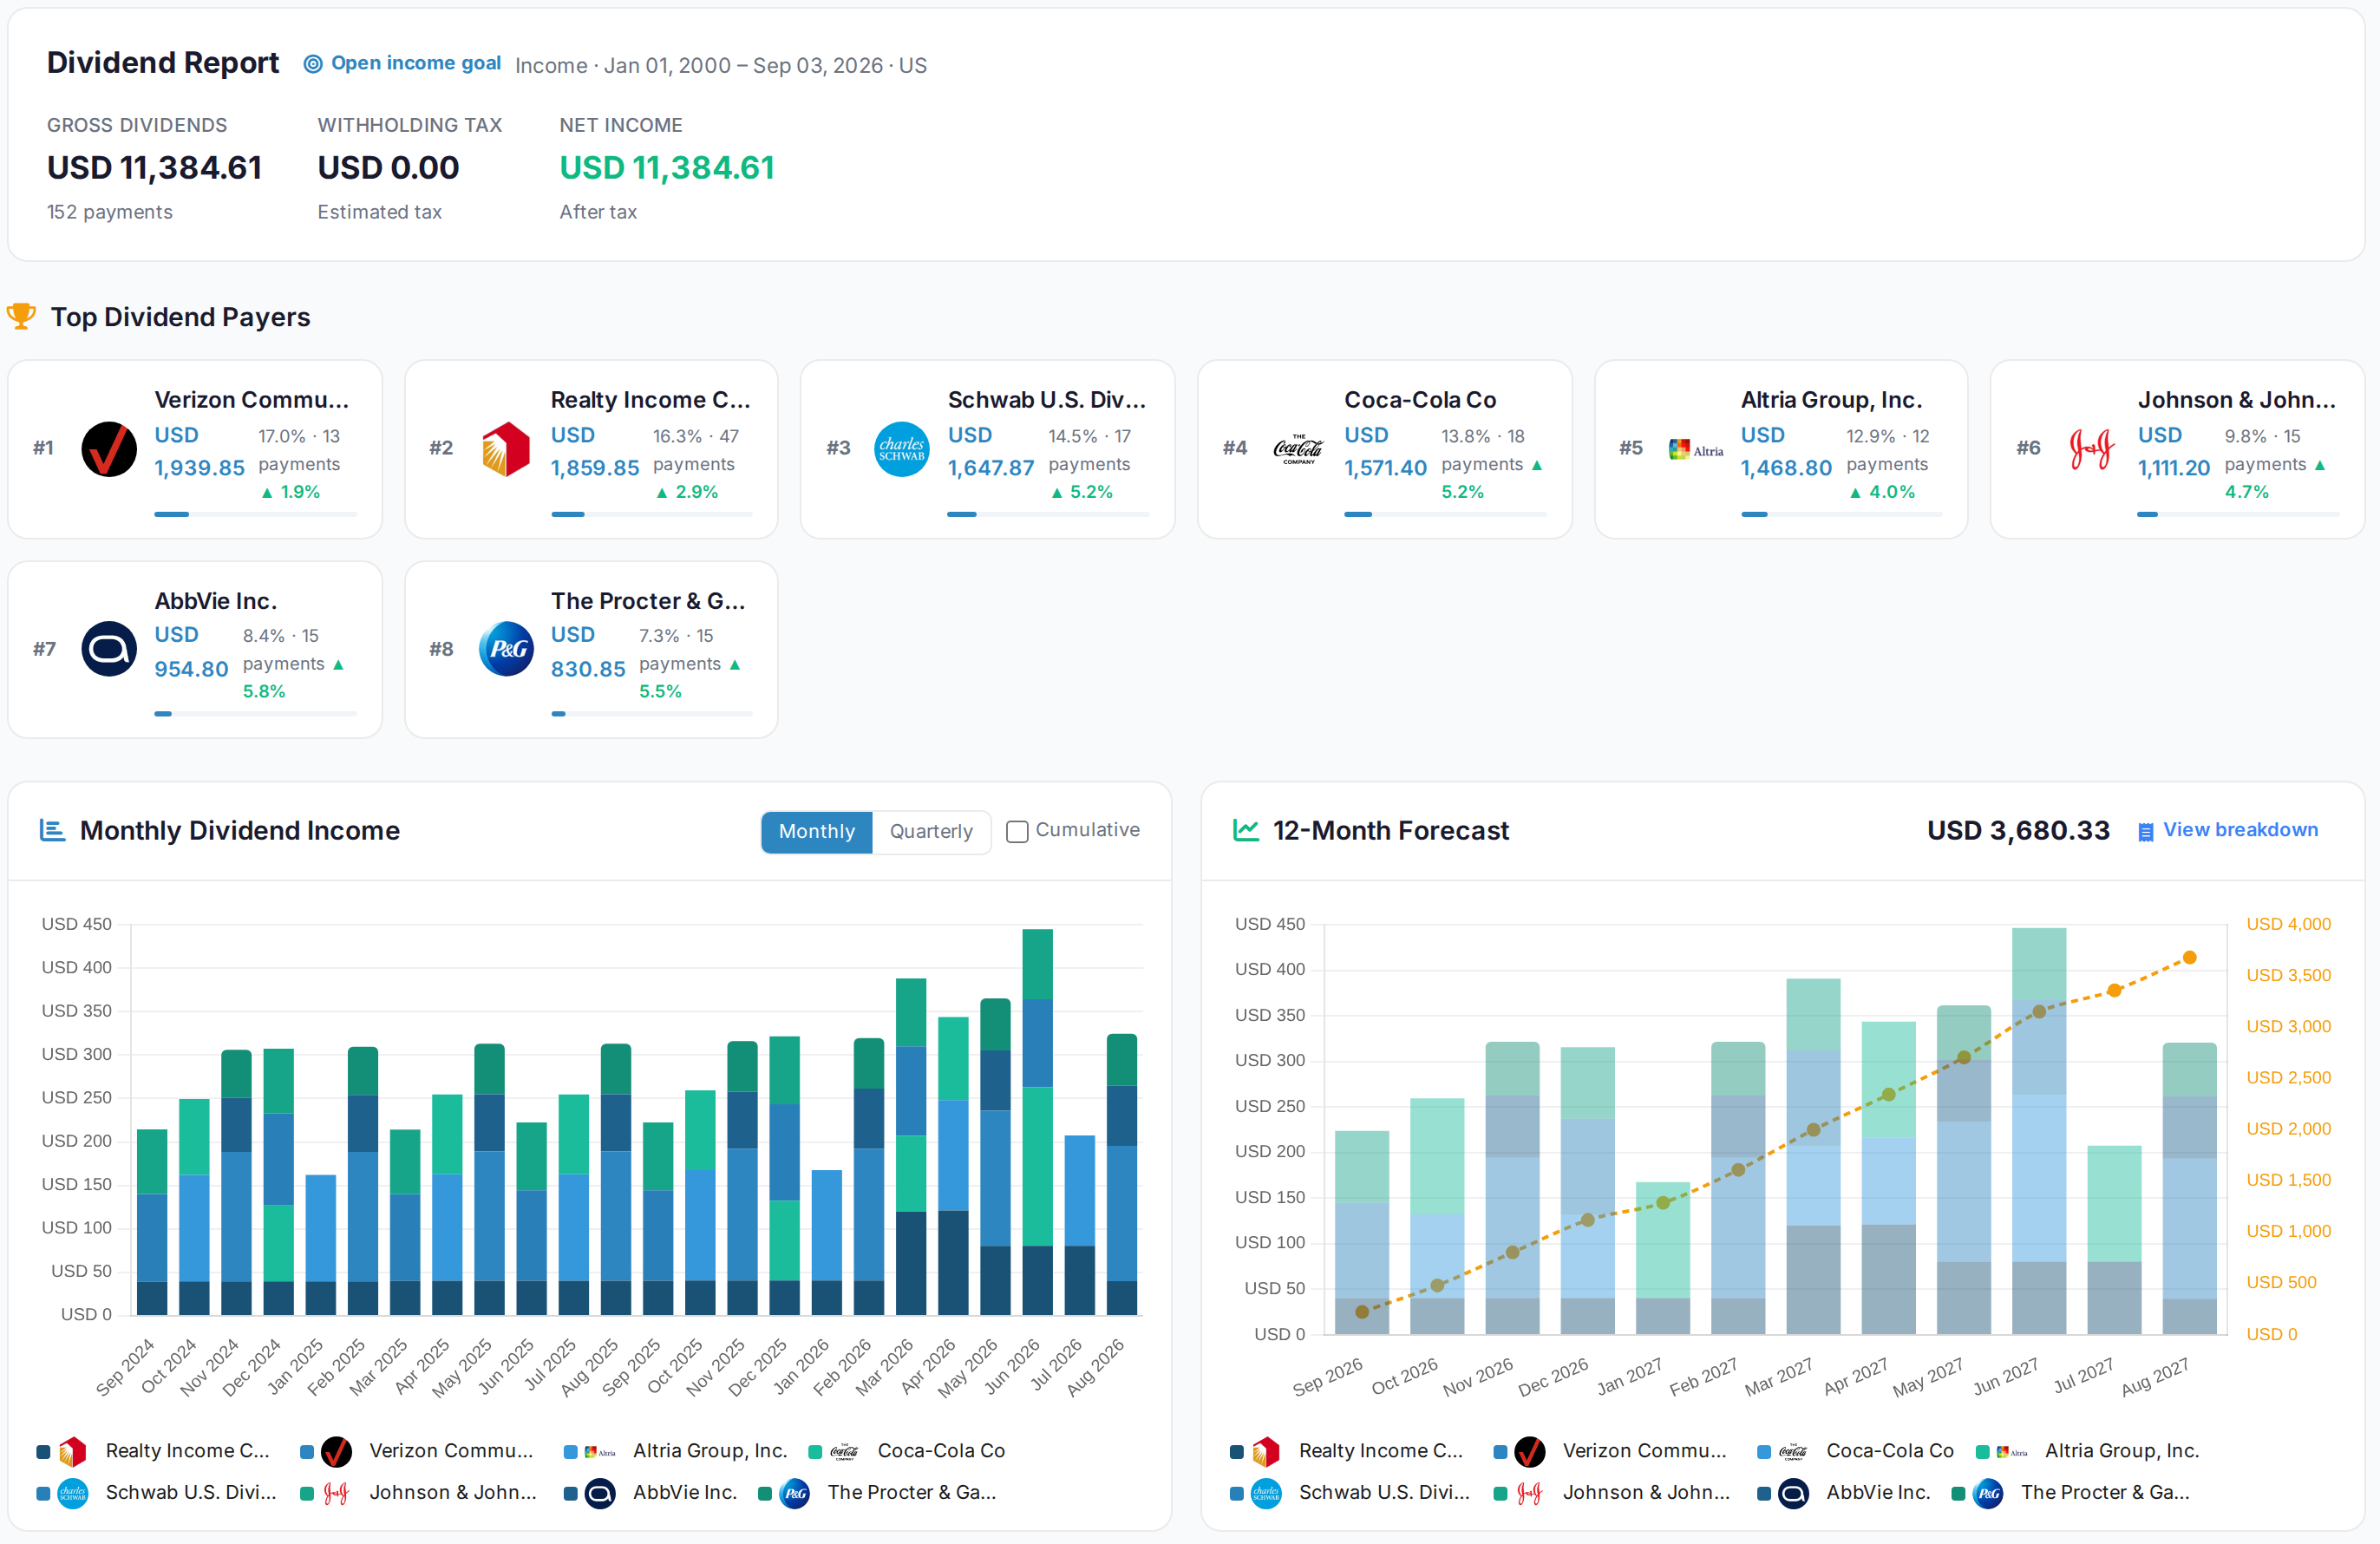
A calculator runs on one yield and one growth rate. Your portfolio pays a different amount from every holding, on its own dates, with withholding tax taken off some of it. AllInvestView records each payment as it arrives and forecasts the next 12 months from what you actually hold.

  • Gross, withheld and net income for every payment
  • A month-by-month forecast and a calendar of pay dates
  • Income by payer, with each one's dividend growth
See the dividend tracker

Start free. No card required.

AllInvestViewDividend report
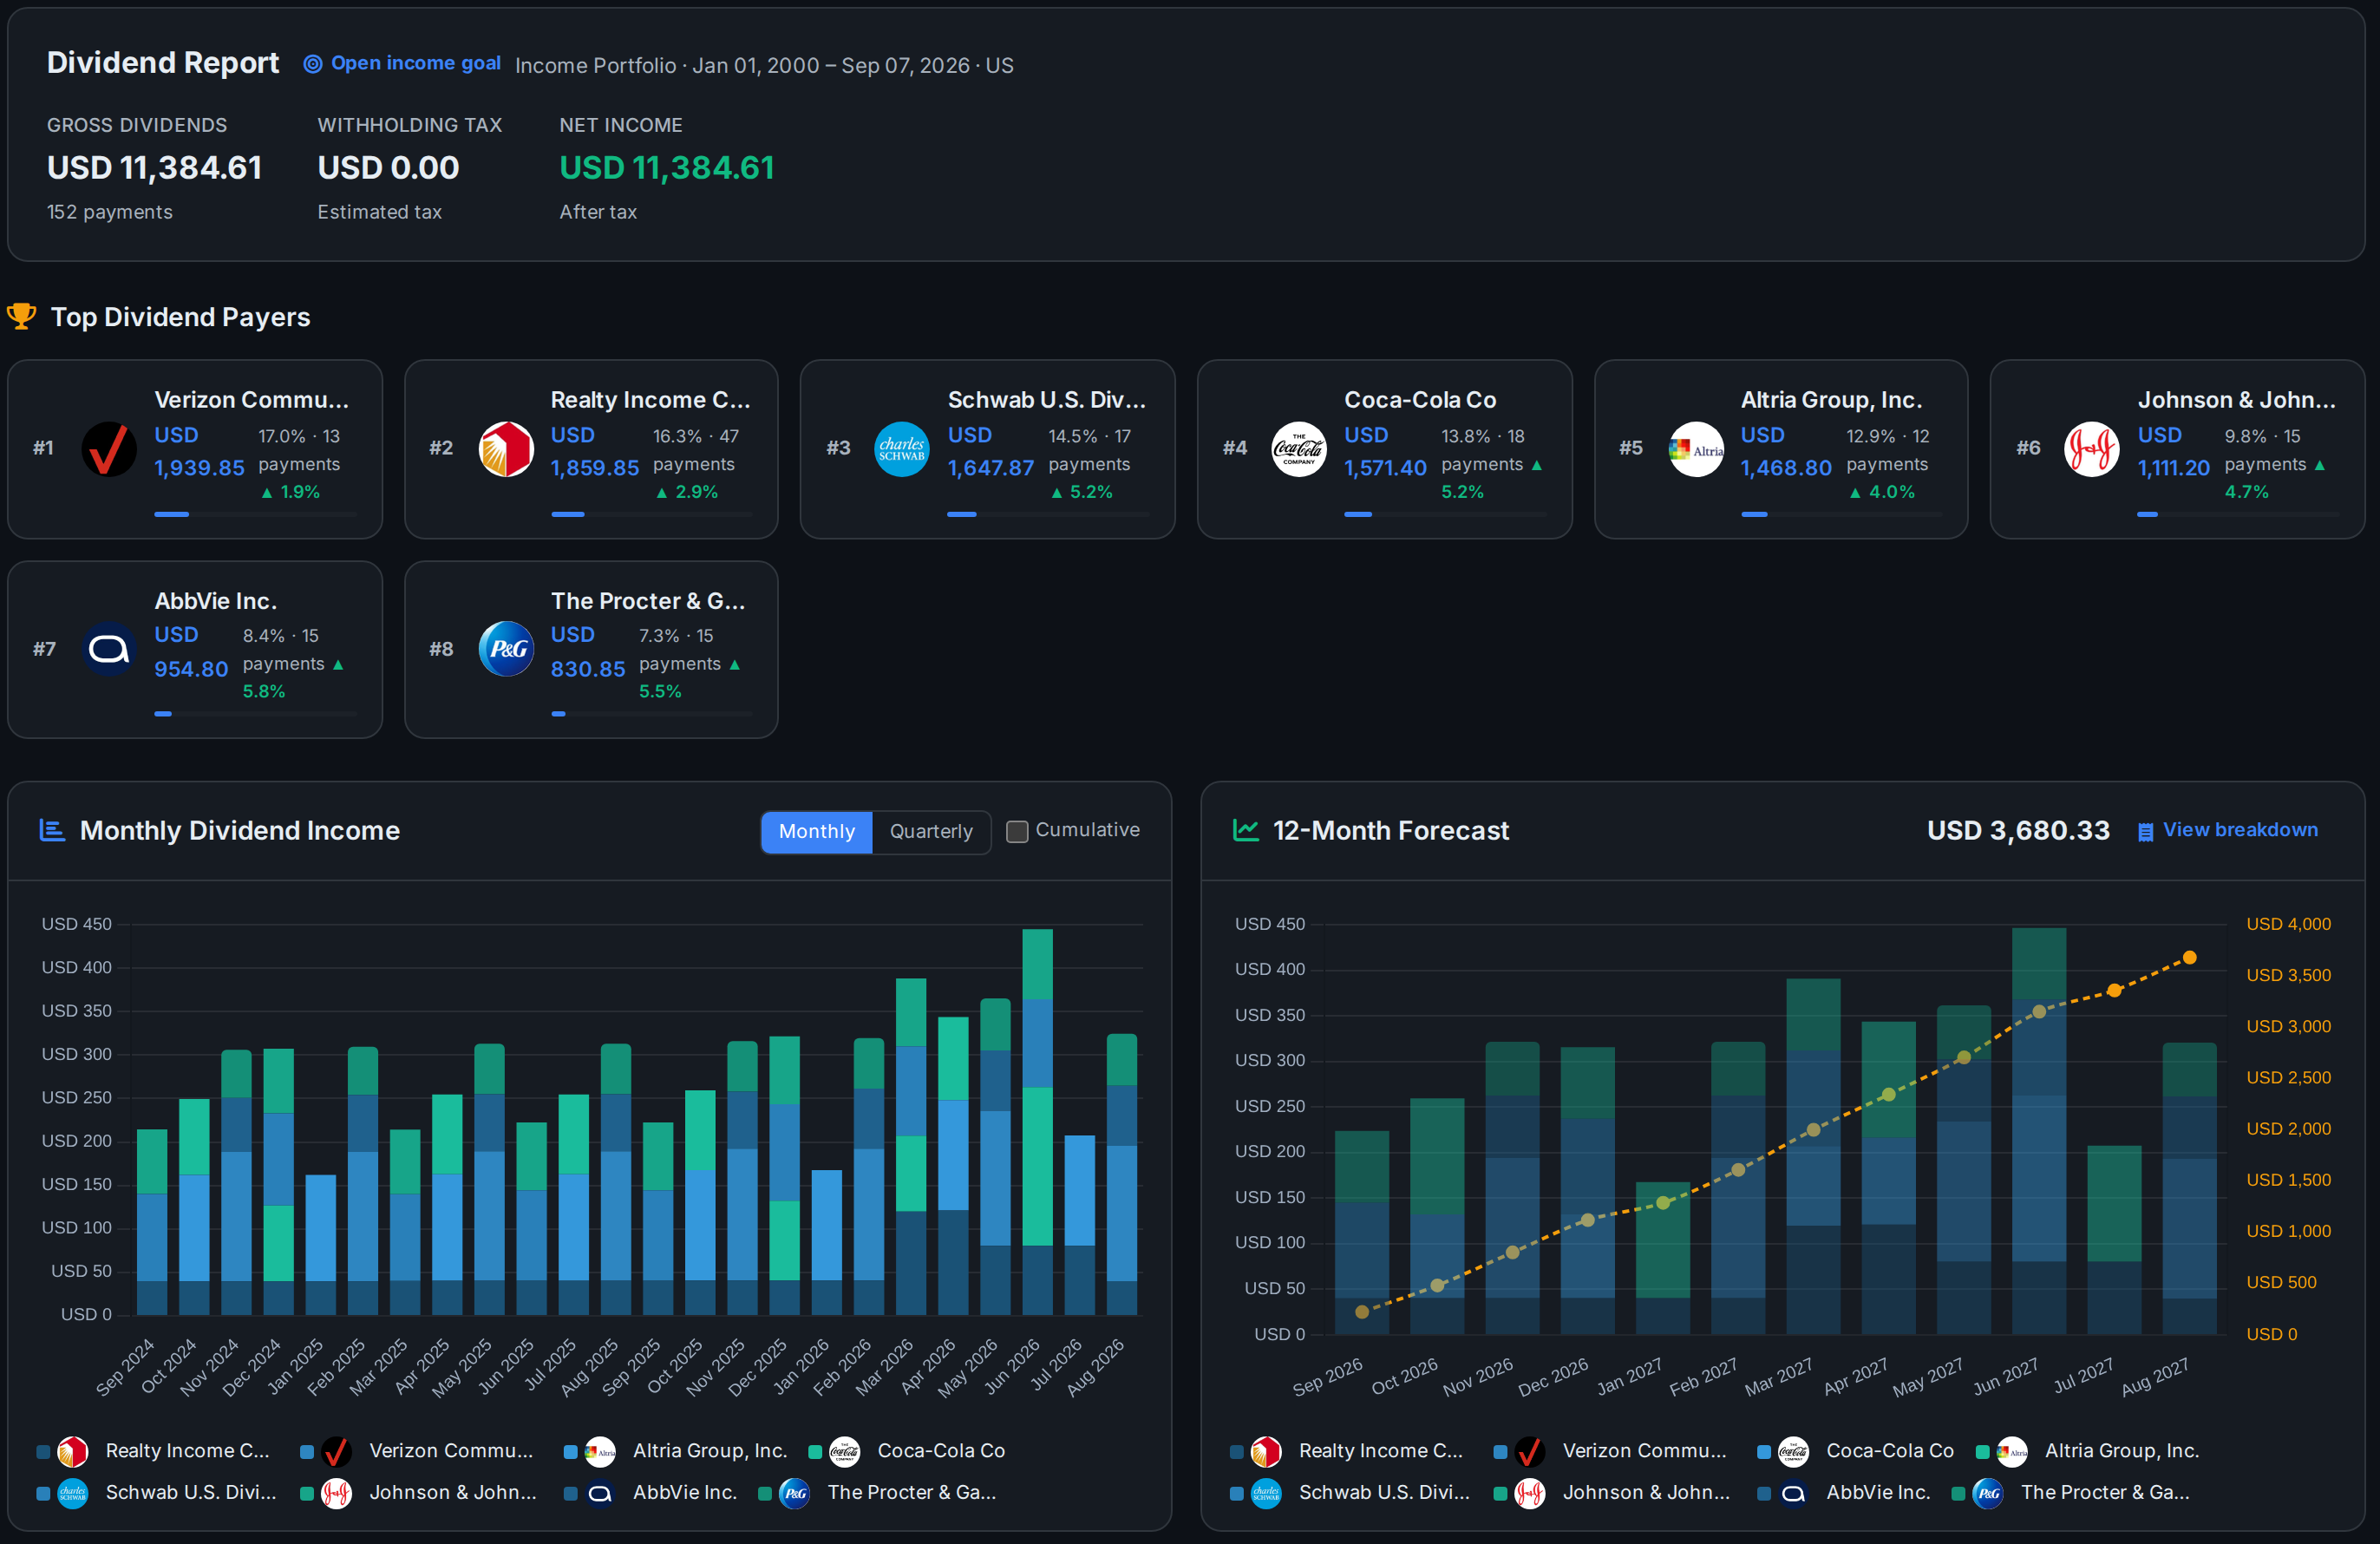
A dividend report showing gross, withholding and net income, the top payers, monthly income history and the twelve month forecast A dividend report showing gross, withholding and net income, the top payers, monthly income history and the twelve month forecast
The dividend report on a demo portfolio.View full sizeView full size

Keep going