1. Home
  2. Portfolio analyzer
  3. Monte Carlo calculator

Free Monte Carlo Simulation Calculator

Enter your balance, what you add or take out each month, and the return and risk you expect. You get 1,000 possible futures and the range they land in.

Your plan

$
Enter an amount up to 100,000,000.
$
Up to 1,000,000 a month.
$
Up to 1,000,000 a month.
%
Between -50% and 50%.
%
Between 0% and 100%.

Roughly 5% for bonds, 10% for a 60/40 mix, 15% for a stock index.

20 years
Pick a year within the horizon.
$
Enter an amount, or leave it empty.
%
Inflation between 0% and 20%.

Median balance after 20 years


Reach the target


5th percentile 
25th 
Median 
75th 
95th percentile 
  • Median
  • Middle 50% of paths
  • Middle 90%
  • Target

1,000 simulated paths with monthly returns. The paths stay the same between runs, so when you change one input, the difference comes from that change.

How to read the result

The median is the middle path: half of the 1,000 simulations finish above it and half below. The 5th percentile is a bad run of markets, where only one path in twenty does worse. The 95th is the mirror image, a good run that only one path in twenty beats.

The darker band on the chart is where the middle half of the paths sit in each year, and the lighter band holds nine paths in ten. Watch how fast it widens. That spread is the risk a single average return line never shows you.

Read the percentiles as a range to plan around. They come from the return and volatility you entered, so if those change, the whole picture moves with them.

How the simulation works

  • Every month, each path draws a random return. On average they add up to the yearly return you entered, and they swing as much as your volatility says. Once you are living off the money, the order of returns matters: a crash in the first years of withdrawals hurts more than the same crash near the end.
  • After the month's return, your contribution goes in and the withdrawal comes out. Withdrawals can start in a later year, so you can model saving first and living off the money after.
  • A path runs out of money when a withdrawal is due and the balance can't cover it. It stays at zero from then on.
  • With today's money switched on, every figure is shown at today's prices, and your contributions and withdrawals rise with inflation so they keep their buying power.

Two plans, two very different pictures

Saving for 30 years

$10,000 to start, $500 added every month, 7% a year at 15% volatility, with a $500,000 goal.

Median
$556,000
5th percentile
$219,000
Reach $500k
57%

Steady saving carries the early years and the market does most of the work later. Even the 5th percentile ends above the $190,000 you put in.

Living off the portfolio

$1,000,000 to start, $3,500 taken out every month and raised with 2.5% inflation, 7% a year at 12% volatility. Shown in today's money.

Median
$685,000
Run out
24%
Usually by
Year 24

The middle case still leaves plenty after 30 years, yet about one path in four runs dry. Those are the paths where bad years come early and the withdrawals keep coming out of a shrinking balance.

Questions about the calculator

What does the 5th percentile mean?

Five percent of the simulated paths ended below it. Think of it as a bad run of markets for the return and volatility you entered, though not the worst one possible.

Can I add monthly savings and withdrawals?

Yes, and you can use both at once. Each month the return is applied first, then the contribution goes in and the withdrawal comes out. Withdrawals can start in a later year.

How are the returns modeled?

Each month draws a random return from a lognormal distribution, so a balance can fall but never below zero from returns alone. The draws average out to the yearly return you enter and swing as much as the volatility says.

Why does higher volatility lower the median?

Losses hurt more than equal gains help: after a 20% drop you need 25% just to get back. So with the same average return, a bumpier portfolio ends lower in the middle case and spreads its outcomes much wider.

What does running out of money mean here?

A path runs out when a withdrawal is due and the balance can not cover it. The balance is set to zero and stays there for the rest of the horizon. The percentage shown is the share of the 1,000 paths where that happened.

Is this a retirement calculator?

It answers the core retirement question, whether a balance with your contributions and withdrawals lasts or reaches a goal, over up to 40 years. Taxes, fees and pensions are not part of the model.

Run it on your real portfolio

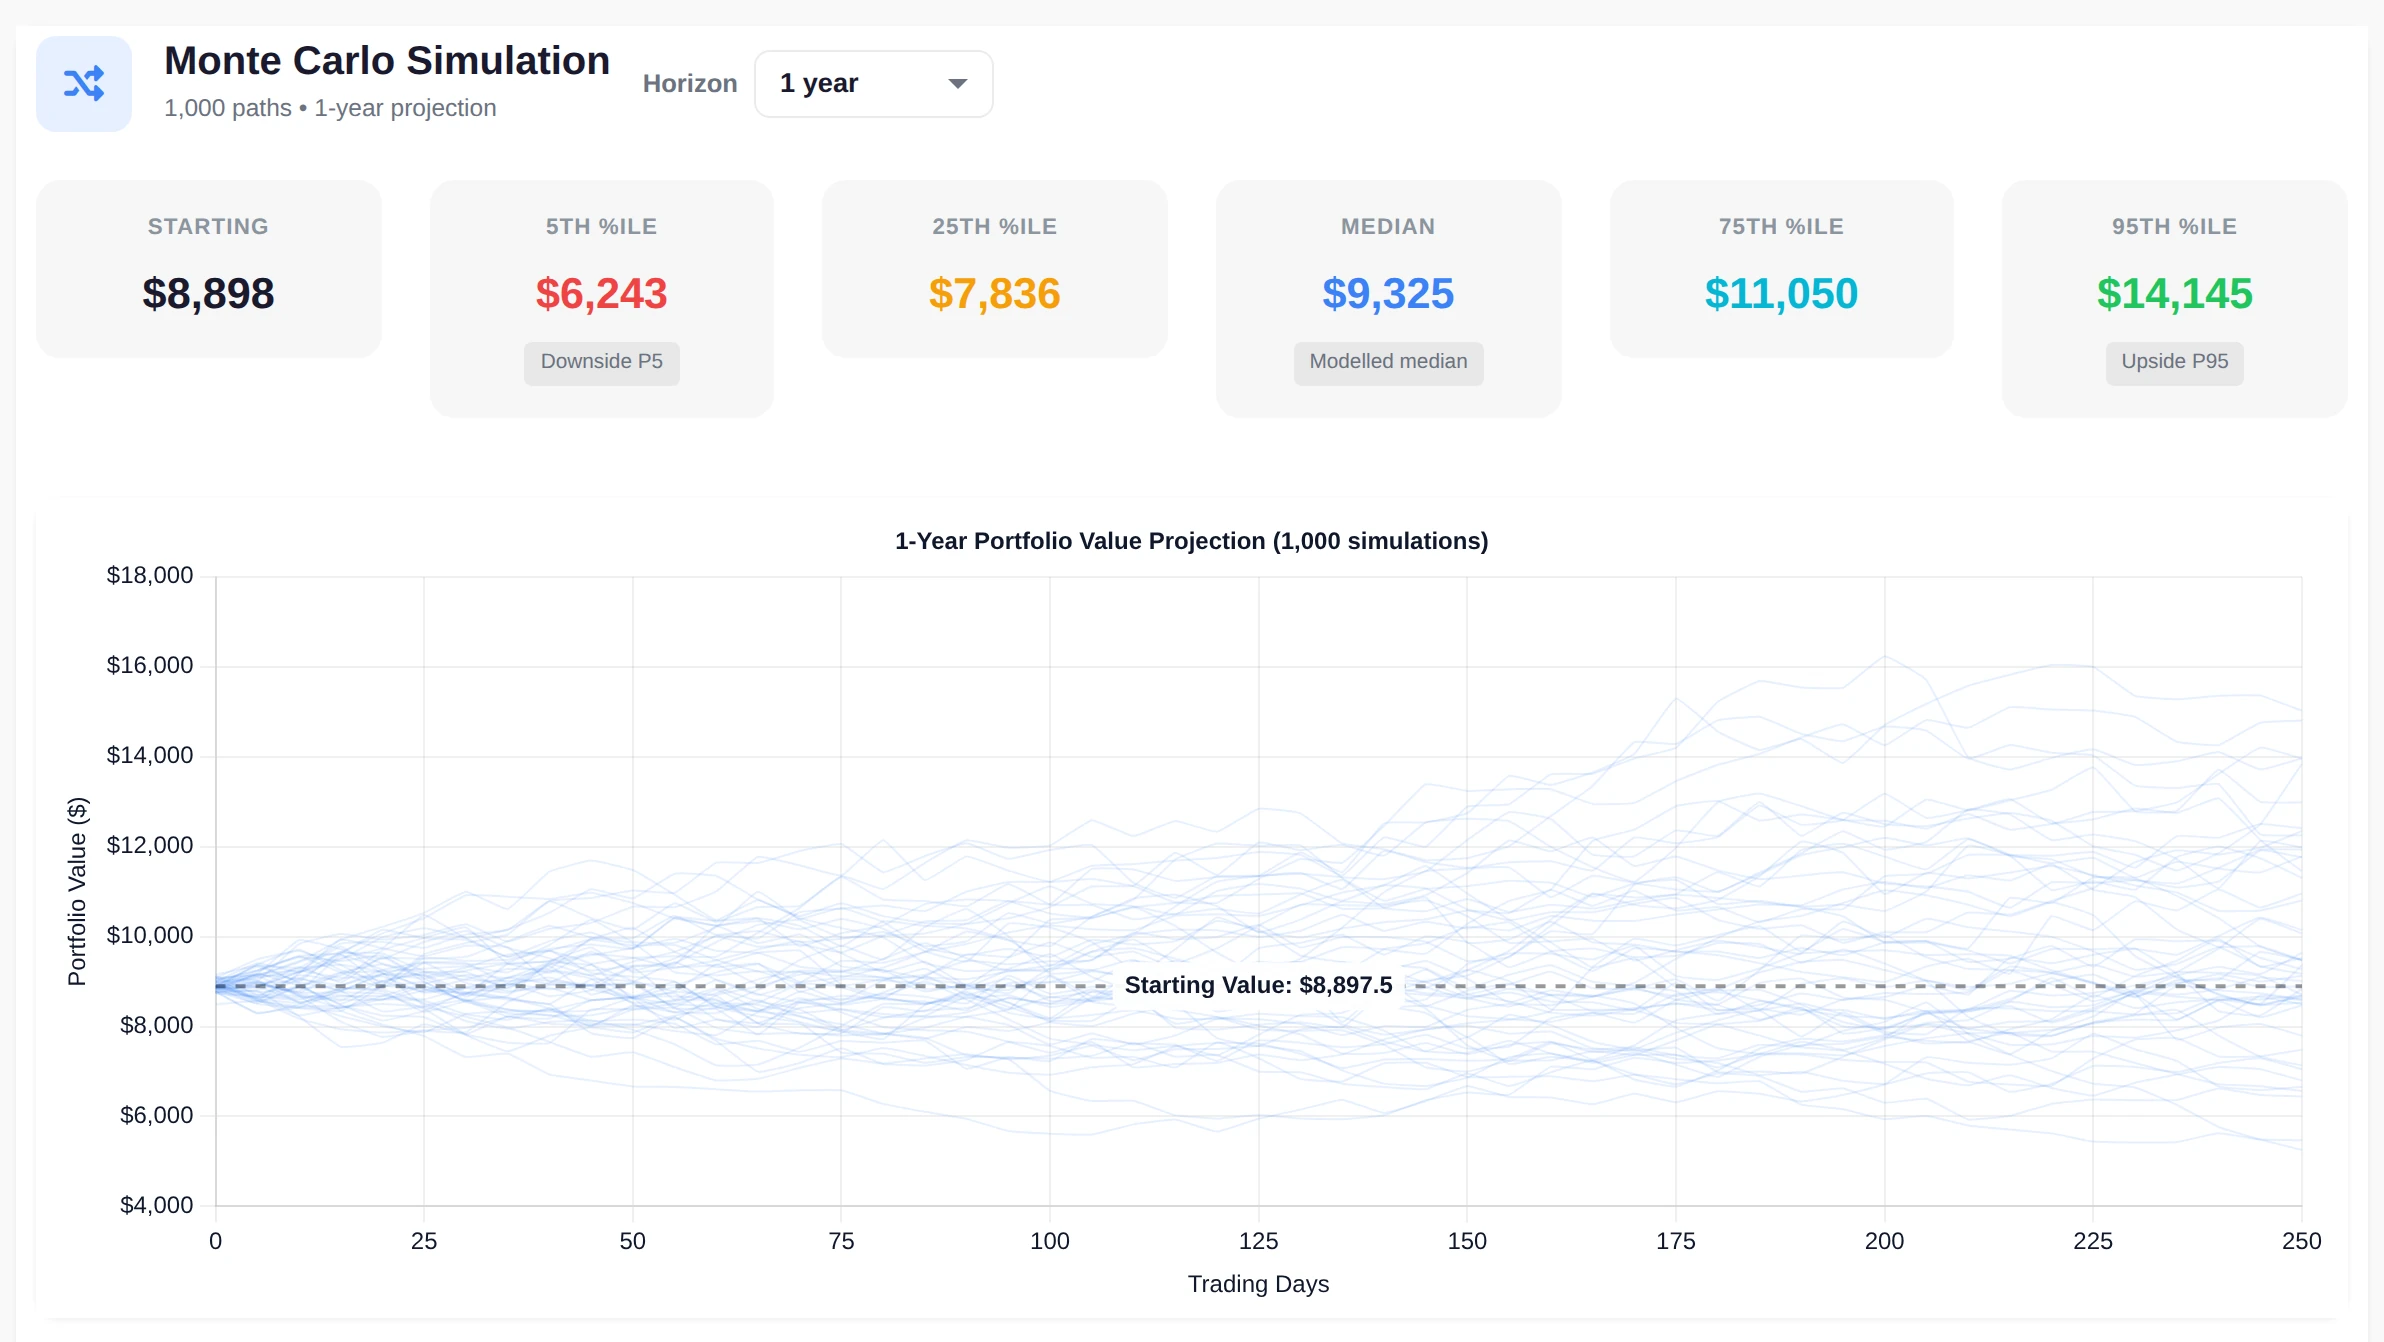
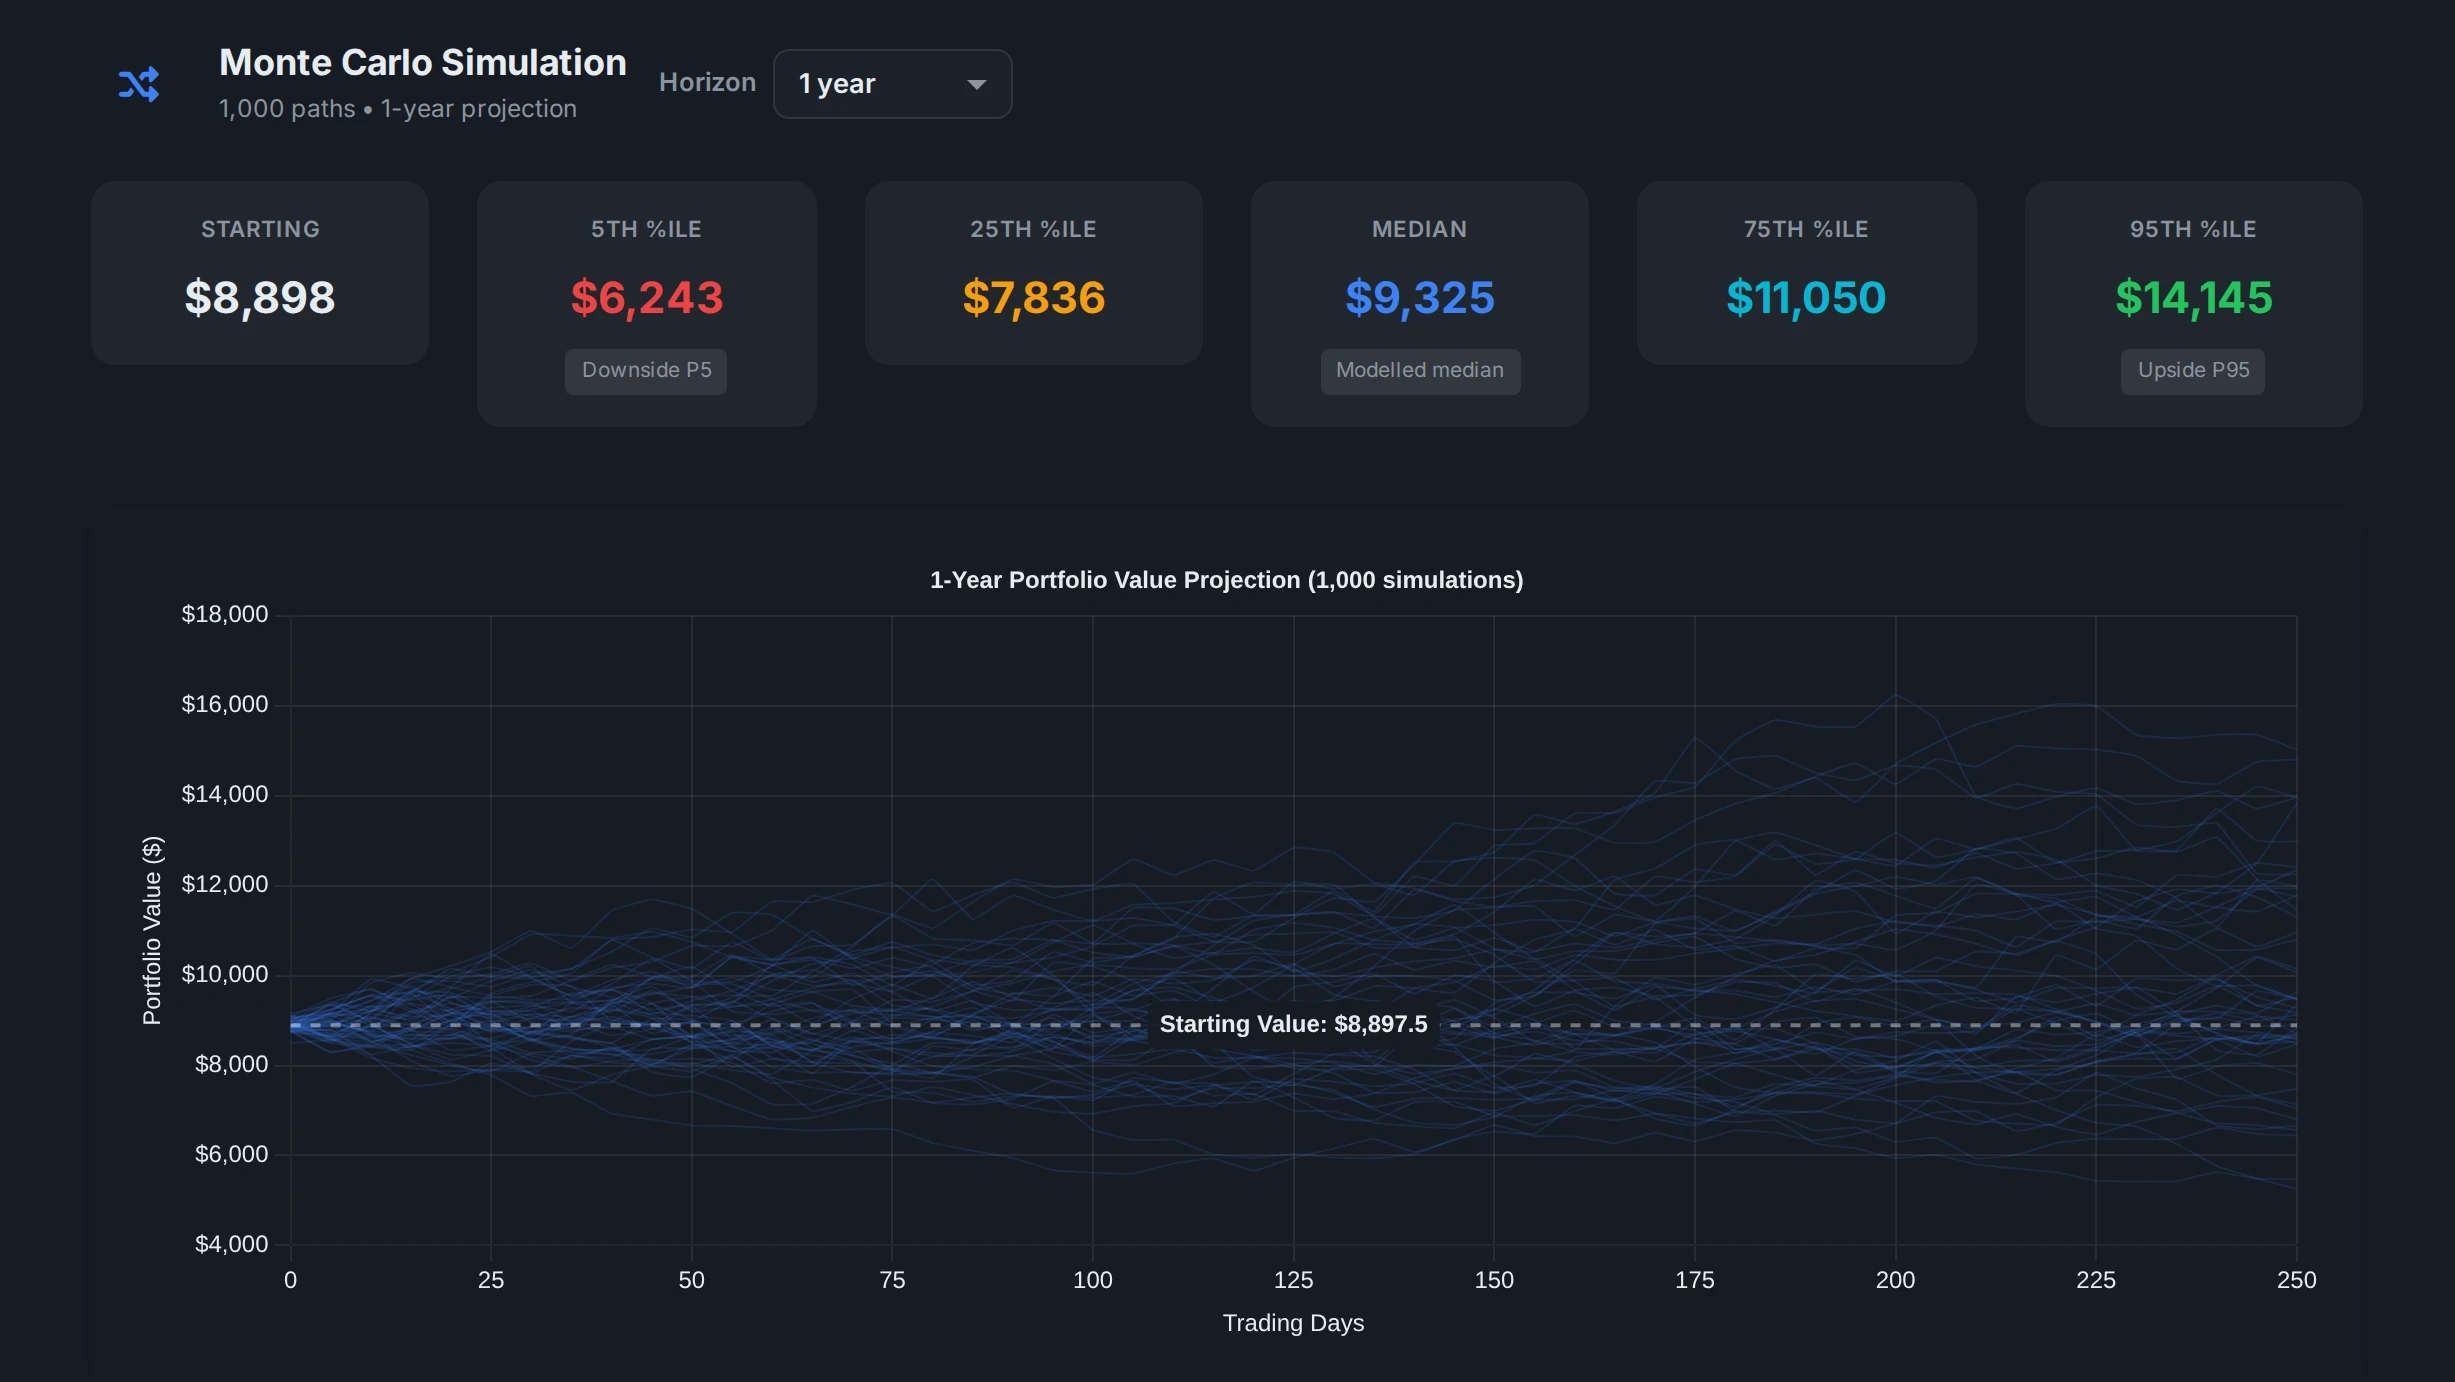
Here you guess the return and the volatility. In AllInvestView the simulation starts from what you actually hold. Each holding's expected return comes from its market risk, and the spread comes from how your holdings really move together, so five tech stocks and a mix of bonds and world funds get very different ranges.

  • 1,000 paths from your own holdings, from one to ten years ahead
  • Next to your efficient frontier, Sharpe ratio, VaR and stress tests
  • Holdings kept current through broker sync or a file import
Start your free trial

14-day Advanced trial. No card required.

AllInvestViewMonte Carlo simulation
The AllInvestView Monte Carlo panel: starting value, the 5th, 25th, median, 75th and 95th percentile outcomes, and a chart of sampled portfolio paths over one year The AllInvestView Monte Carlo panel: starting value, the 5th, 25th, median, 75th and 95th percentile outcomes, and a chart of sampled portfolio paths over one year
A demo portfolio's one-year simulation in the app.View full sizeView full size

Keep going

Results come from the return and volatility you enter. They are model outcomes, not a forecast or financial advice.