- Home
- Portfolio analyzer
- Efficient frontier calculator
Free Portfolio Optimizer and Efficient Frontier Calculator
Enter up to 8 stocks or ETFs with your weights. Compare their efficient mixes, from the calmest to the one with the best return for its risk.
Over the 3 years to 22 Oct 2026, the best-Sharpe mix averaged 20.8% a year at 12.5% volatility. Your weights averaged 15.3% at 10.0%.
- Efficient frontier
- Single ticker
- Your mix
- Lowest volatility
- Best Sharpe
| Ticker | Yours | Lowest vol. | Best Sharpe |
|---|---|---|---|
VT VTIVanguard Total Stock Market Index Fund ETF Shares | 45% | 27% | 33% |
VX VXUSVanguard Total Intl Stock Idx Fund | 20% | 9% | 23% |
BN BNDVanguard Total Bond Market Index Fund ETF Shares | 25% | 33% | 3% |
GL GLDSPDR Gold Shares | 5% | 11% | 33% |
VN VNQVanguard Real Estate Index Fund ETF Shares | 5% | 20% | 8% |
Daily closing prices from 24 Oct 2023 to 22 Oct 2026, 781 trading days shared by every ticker. All tickers are compared in one currency (USD), price only. Sharpe uses a 4% risk-free rate. No holding above 33%.
Reading the chart
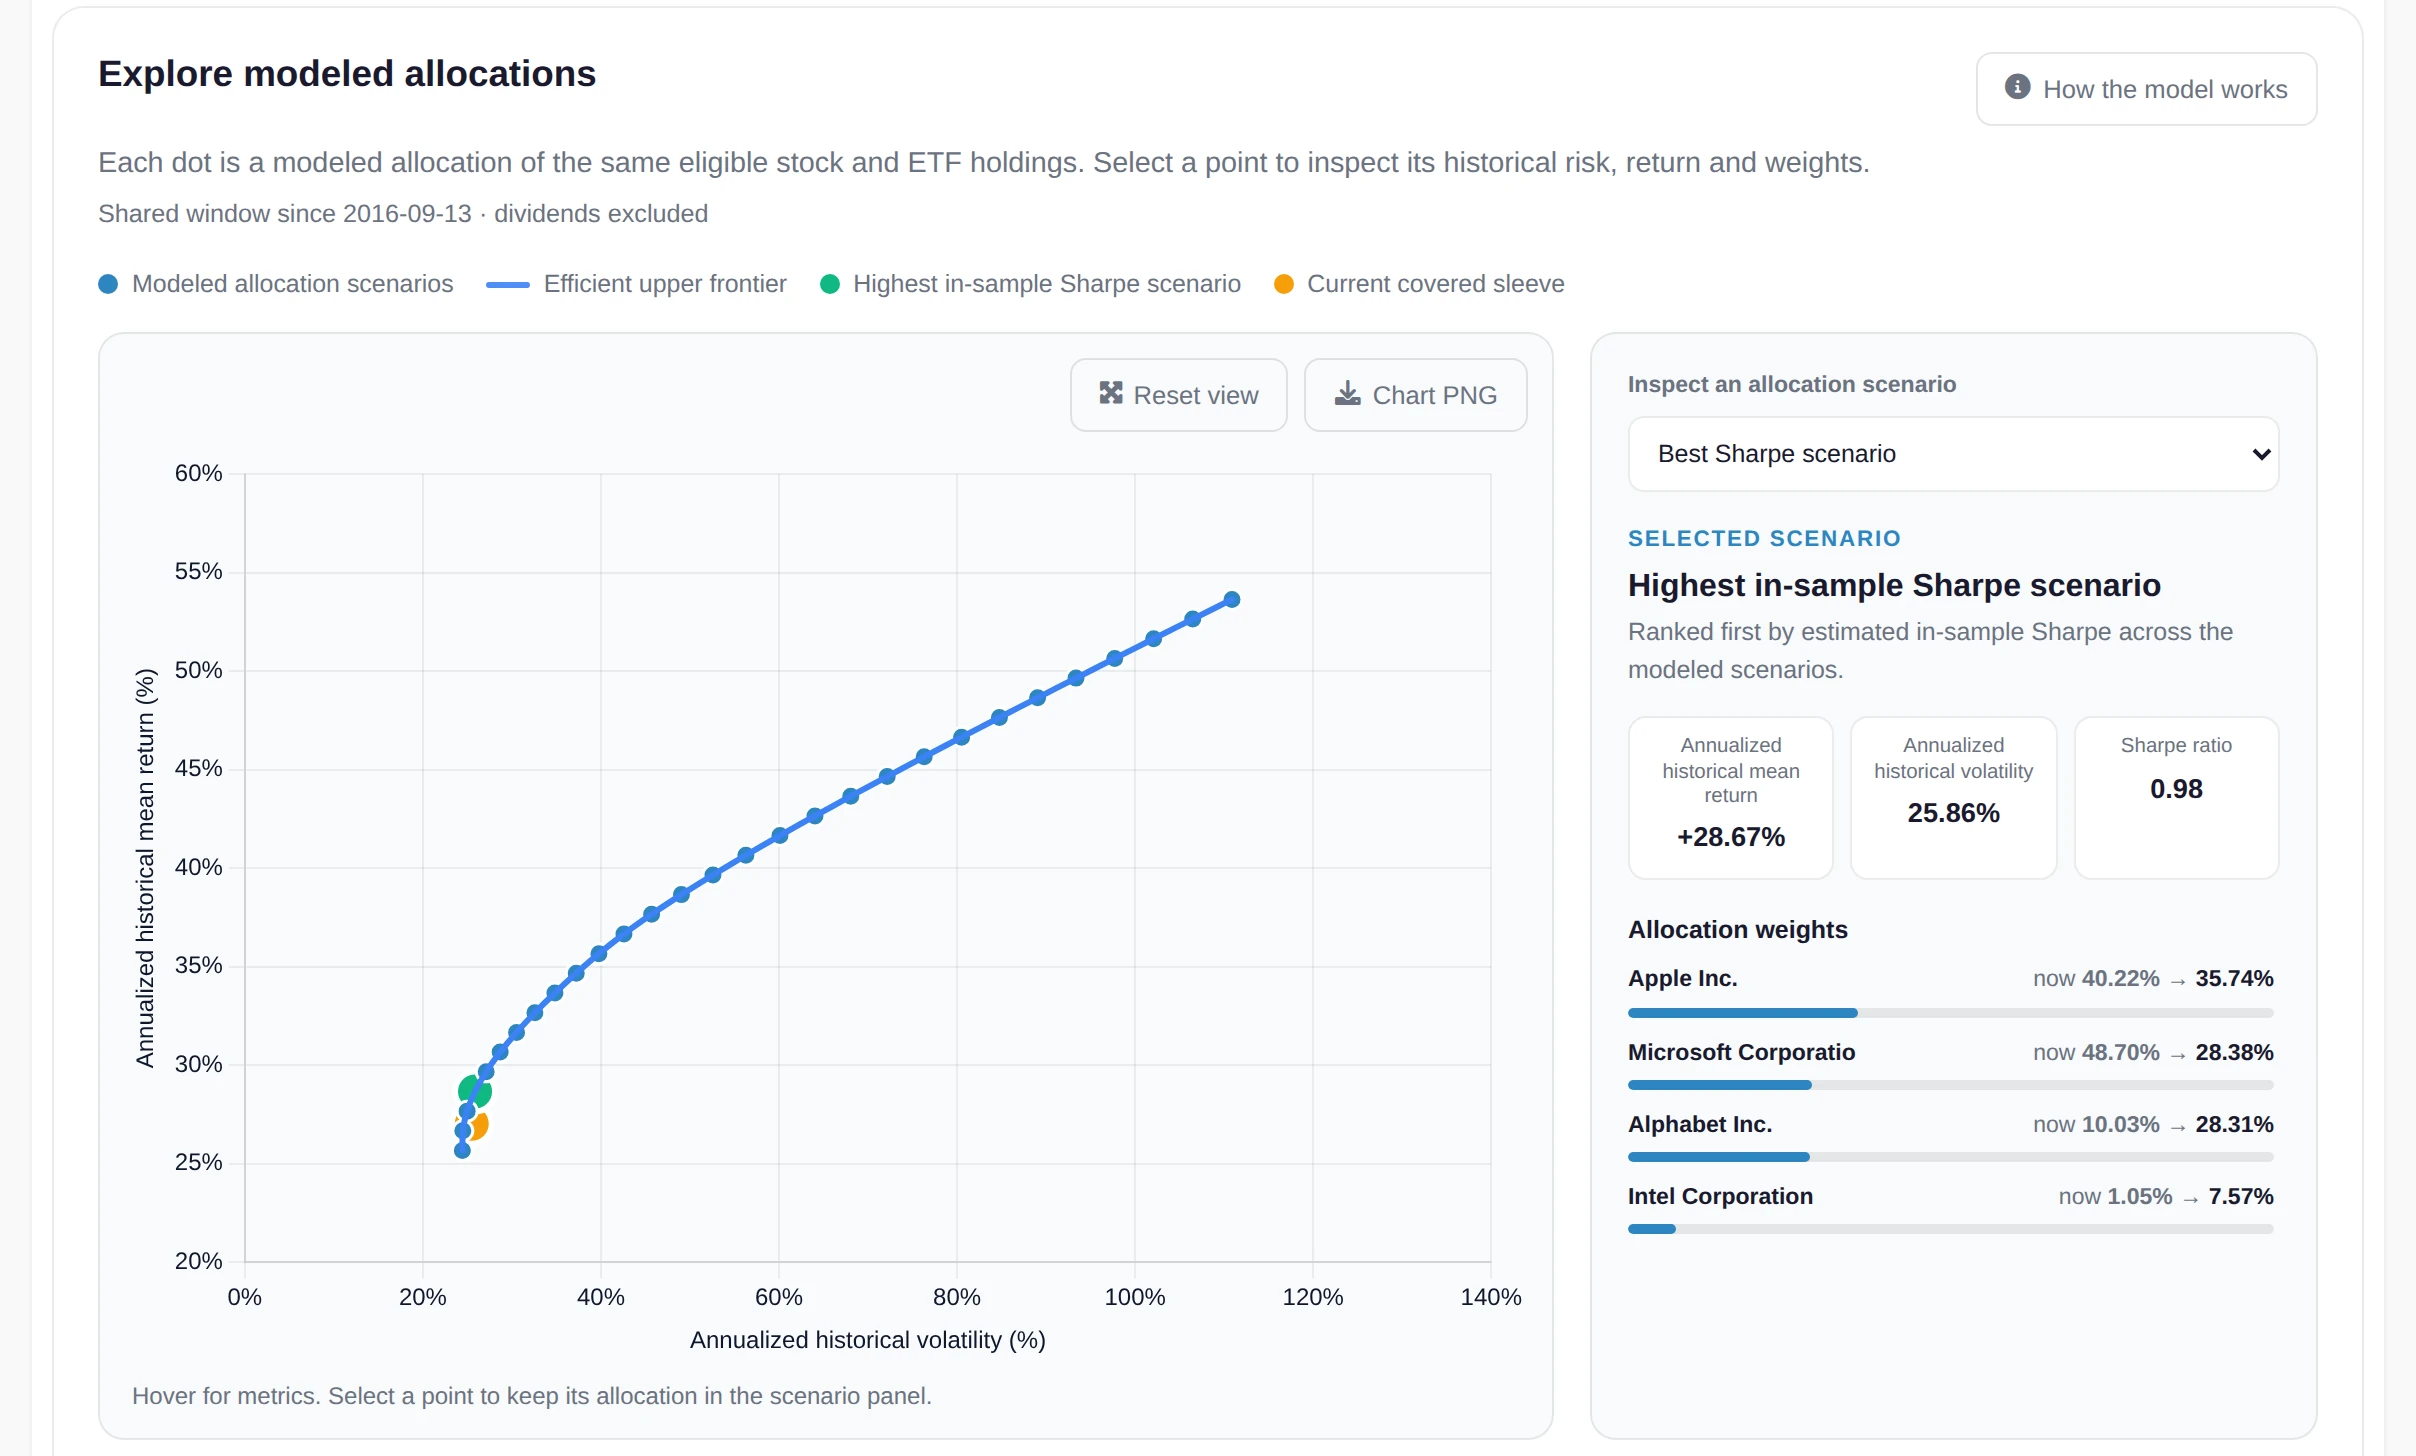
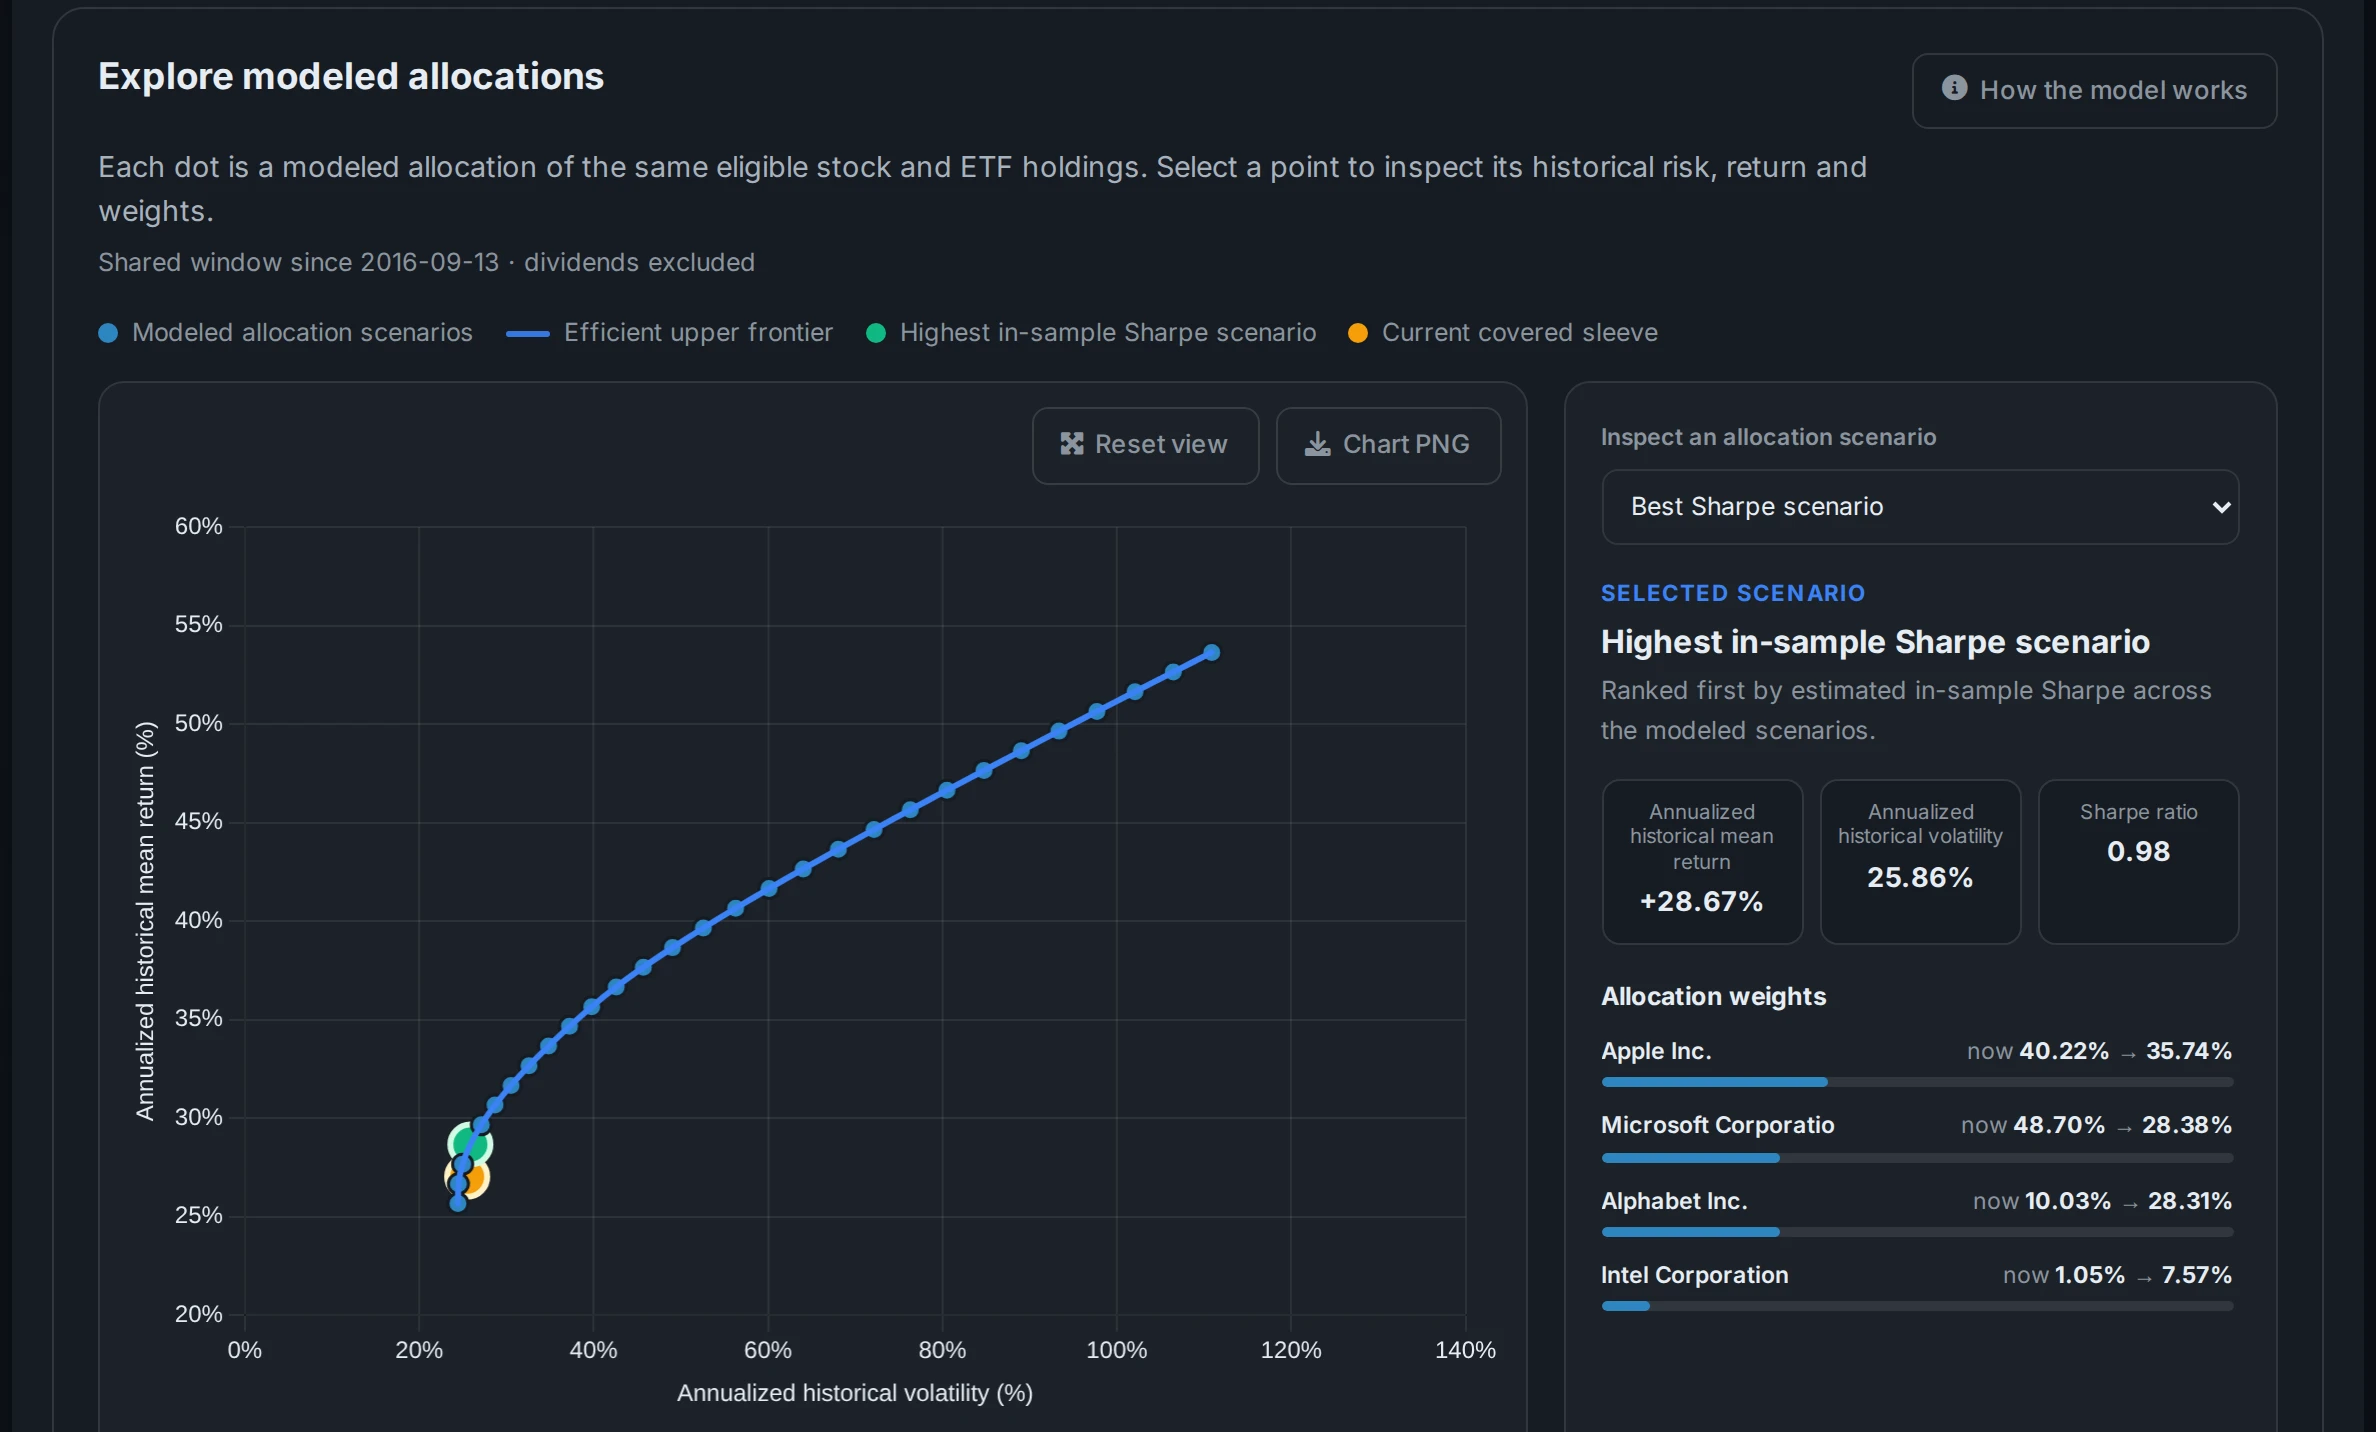
Each grey dot is one of your tickers held on its own. The blue curve is the efficient frontier: for every level of volatility, the mix of those same tickers that had the highest return. Any mix below the curve could have earned more for the same risk, or taken less risk for the same return.
The green point is the lowest-volatility mix, the calmest ride these tickers allow. The gold point has the best Sharpe ratio, the most return for each unit of risk above a 4% cash rate. Your own weights are the dark point. The distance between it and the curve is what the same tickers could have given you just by changing the weights.
Why cap a single holding
Left alone, the optimizer piles into whatever did best in the window. Over three strong years for gold or one tech stock, the best-Sharpe mix can end up more than half in a single name. A cap of 25% or 33% makes it spread the money out, and the curve you get back is one you could actually hold.
A cap has to leave room for a full portfolio. Four tickers can't add up to 100% at 20% each, so the calculator tells you how many you need when the cap is too tight.
Where the numbers come from
Returns, volatility and how your tickers move together all come from daily closing prices over the 1, 3 or 5 years that every ticker has in common. The optimizer is the same one that runs inside the AllInvestView portfolio analyzer: long only, weights adding up to 100%, solved point by point along the curve.
A window that caught a big rally will tilt the best-Sharpe mix towards whatever rallied. Switch between the 1, 3 and 5 year histories before you read much into one answer.
Questions about the optimizer
What is an efficient frontier?
It is the set of portfolio mixes that had the highest return for each level of volatility. Any mix below the curve was beaten by one on it, either on return for the same risk or on risk for the same return.
How does a cap change the result?
A cap limits how much of the portfolio any one ticker can take. The curve gets shorter and the best-Sharpe mix spreads across more holdings, usually giving up a little historical return for a mix you would be more comfortable holding.
Why was one of my tickers left out?
Every ticker needs stored daily prices for the whole window you picked, in the same currency as the first ticker. A fund that launched more recently, a ticker whose prices stopped updating or one priced in another currency is listed with the reason above the chart. A shorter history often brings a newer fund back.
Are the returns historical or a forecast?
Historical. Returns, volatility and correlations are measured from daily closing prices over the window you choose, without dividends. They show what each mix did, which is a useful guide but not a prediction.
What is the best-Sharpe mix?
The point on the curve with the highest Sharpe ratio: return above a 4% cash rate, divided by volatility. It is the mix that paid the most for each unit of risk taken in the window.
Can I use ETFs and stocks from other countries?
Yes, if we have their price history. Use the ticker as it is listed, such as VWCE.DE or IWDA.AS. Each calculation compares tickers in one currency, so pick listings that trade in the same one.
Run it on the portfolio you hold
In AllInvestView your weights come straight from your holdings, across every broker you sync or import, and the frontier updates as prices move. It can count dividends in the returns and use your own risk-free rate.
- Your current mix next to the best-Sharpe weights, holding by holding
- Sharpe and Sortino, VaR at 95% and 99%, and four historical stress tests
- A 1,000-path Monte Carlo built from the same holdings
14-day Advanced trial. No card required.
 AllInvestViewEfficient frontier
Keep going
Built from past prices. The frontier shows what these mixes did, not what they will do, and it is not investment advice.