Analyze your real portfolio. Find a better mix.
Risk, optimization, fund look-through and crash tests on the holdings you actually own, synced from your broker and priced every day.
- Sharpe and volatility for each holding, plus portfolio beta, VaR and drawdown
- A better mix on the efficient frontier, with a cap per holding
- ETF look-through, plus 2008 and COVID stress tests on your holdings
14-day Advanced trial. No card required.
 AllInvestViewEfficient frontier
Know where the risk sits
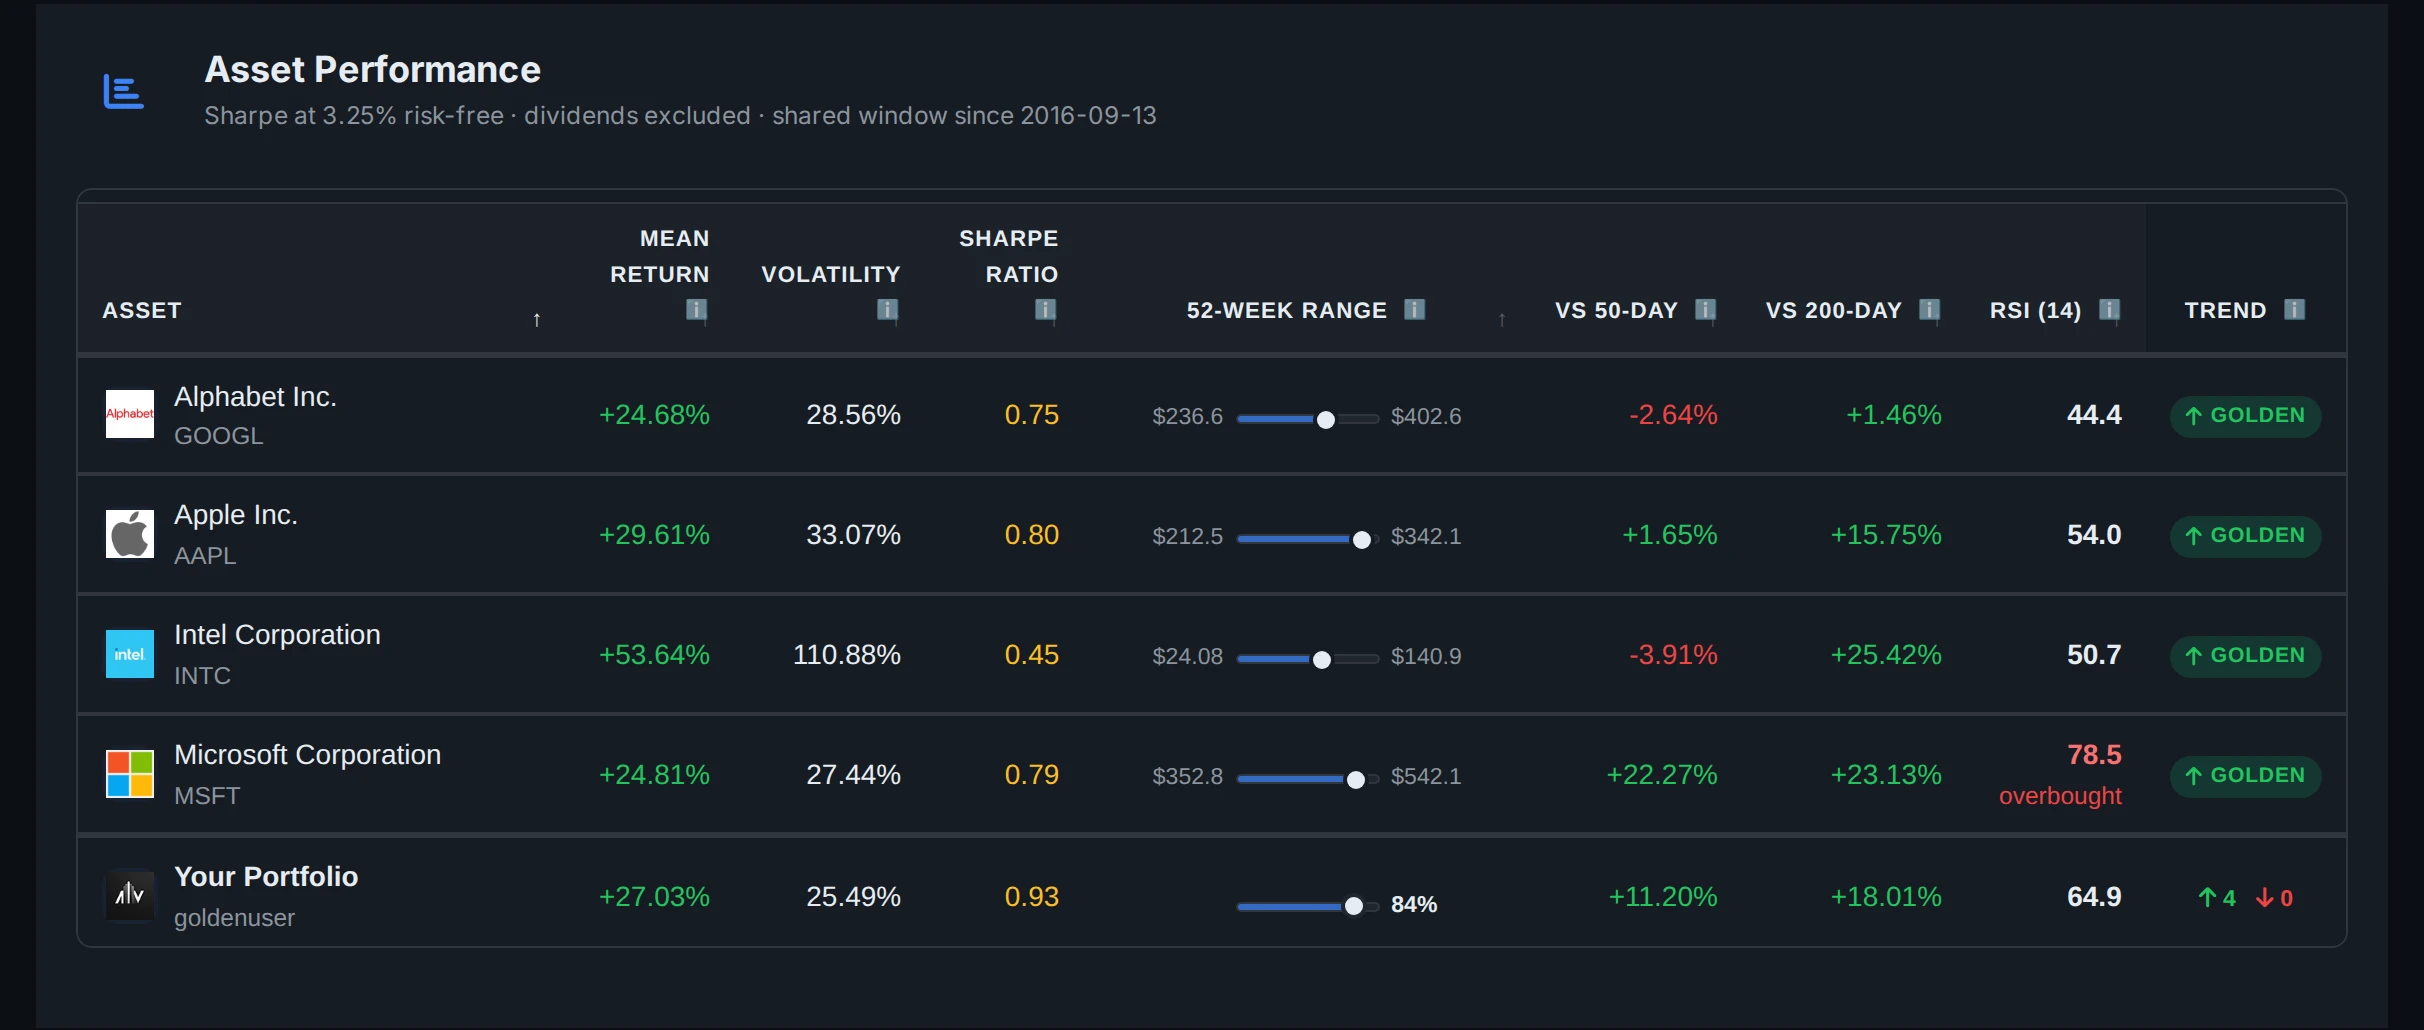
Sharpe and volatility for each holding, plus portfolio beta, maximum drawdown and VaR at 95% and 99%. Correlations and risk contribution show where your risk really comes from, including the small position that moves far more than its size.
Keep it all in one dated PDF, ready to share with an adviser or file away.
- Sharpe ratio
- Beta
- Maximum drawdown
- VaR 95% and 99%
- Correlation matrix
- Risk by holding
AllInvestViewAsset performance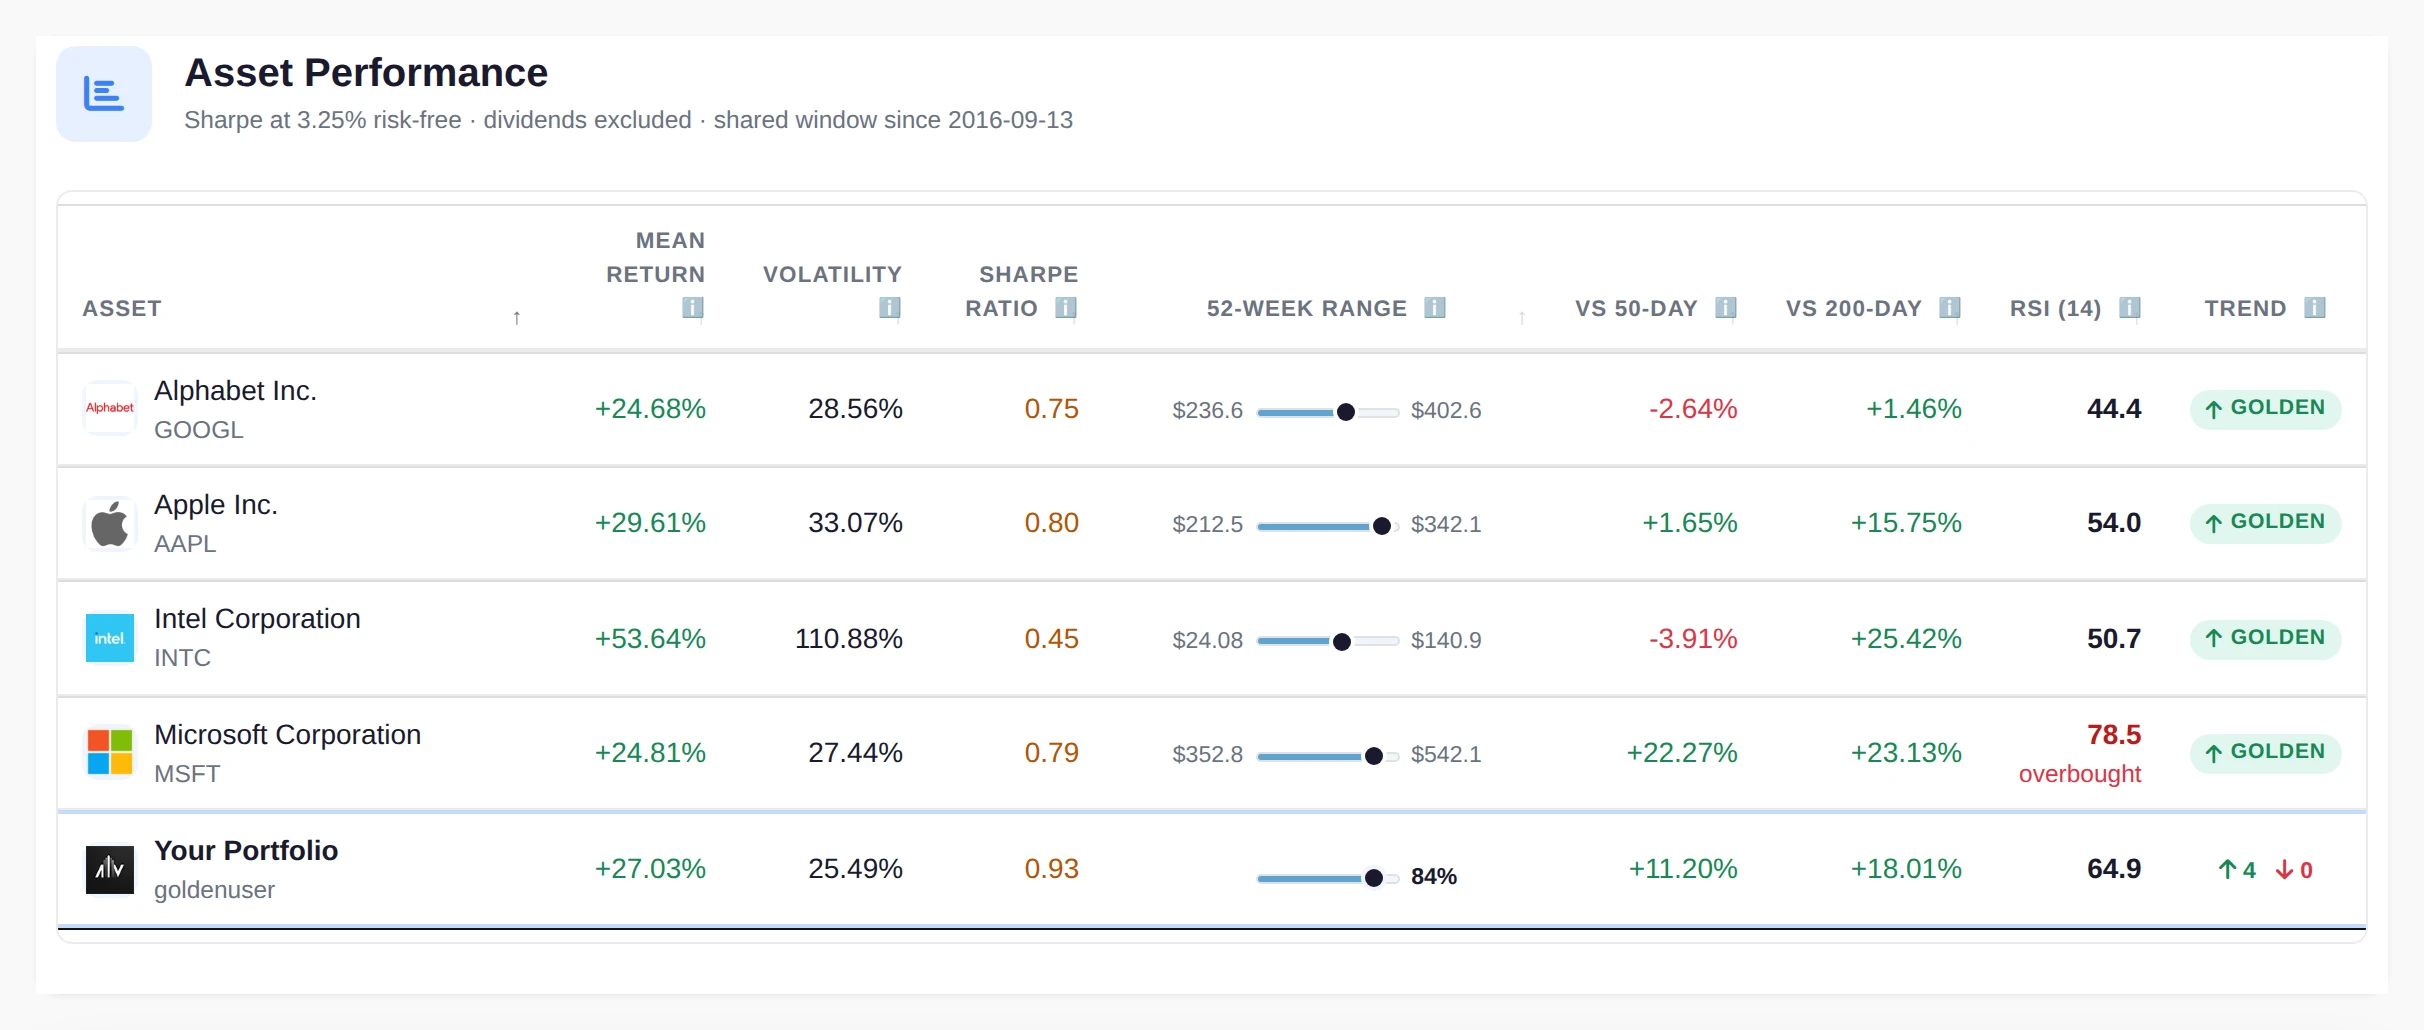
Find the mix that fits your risk
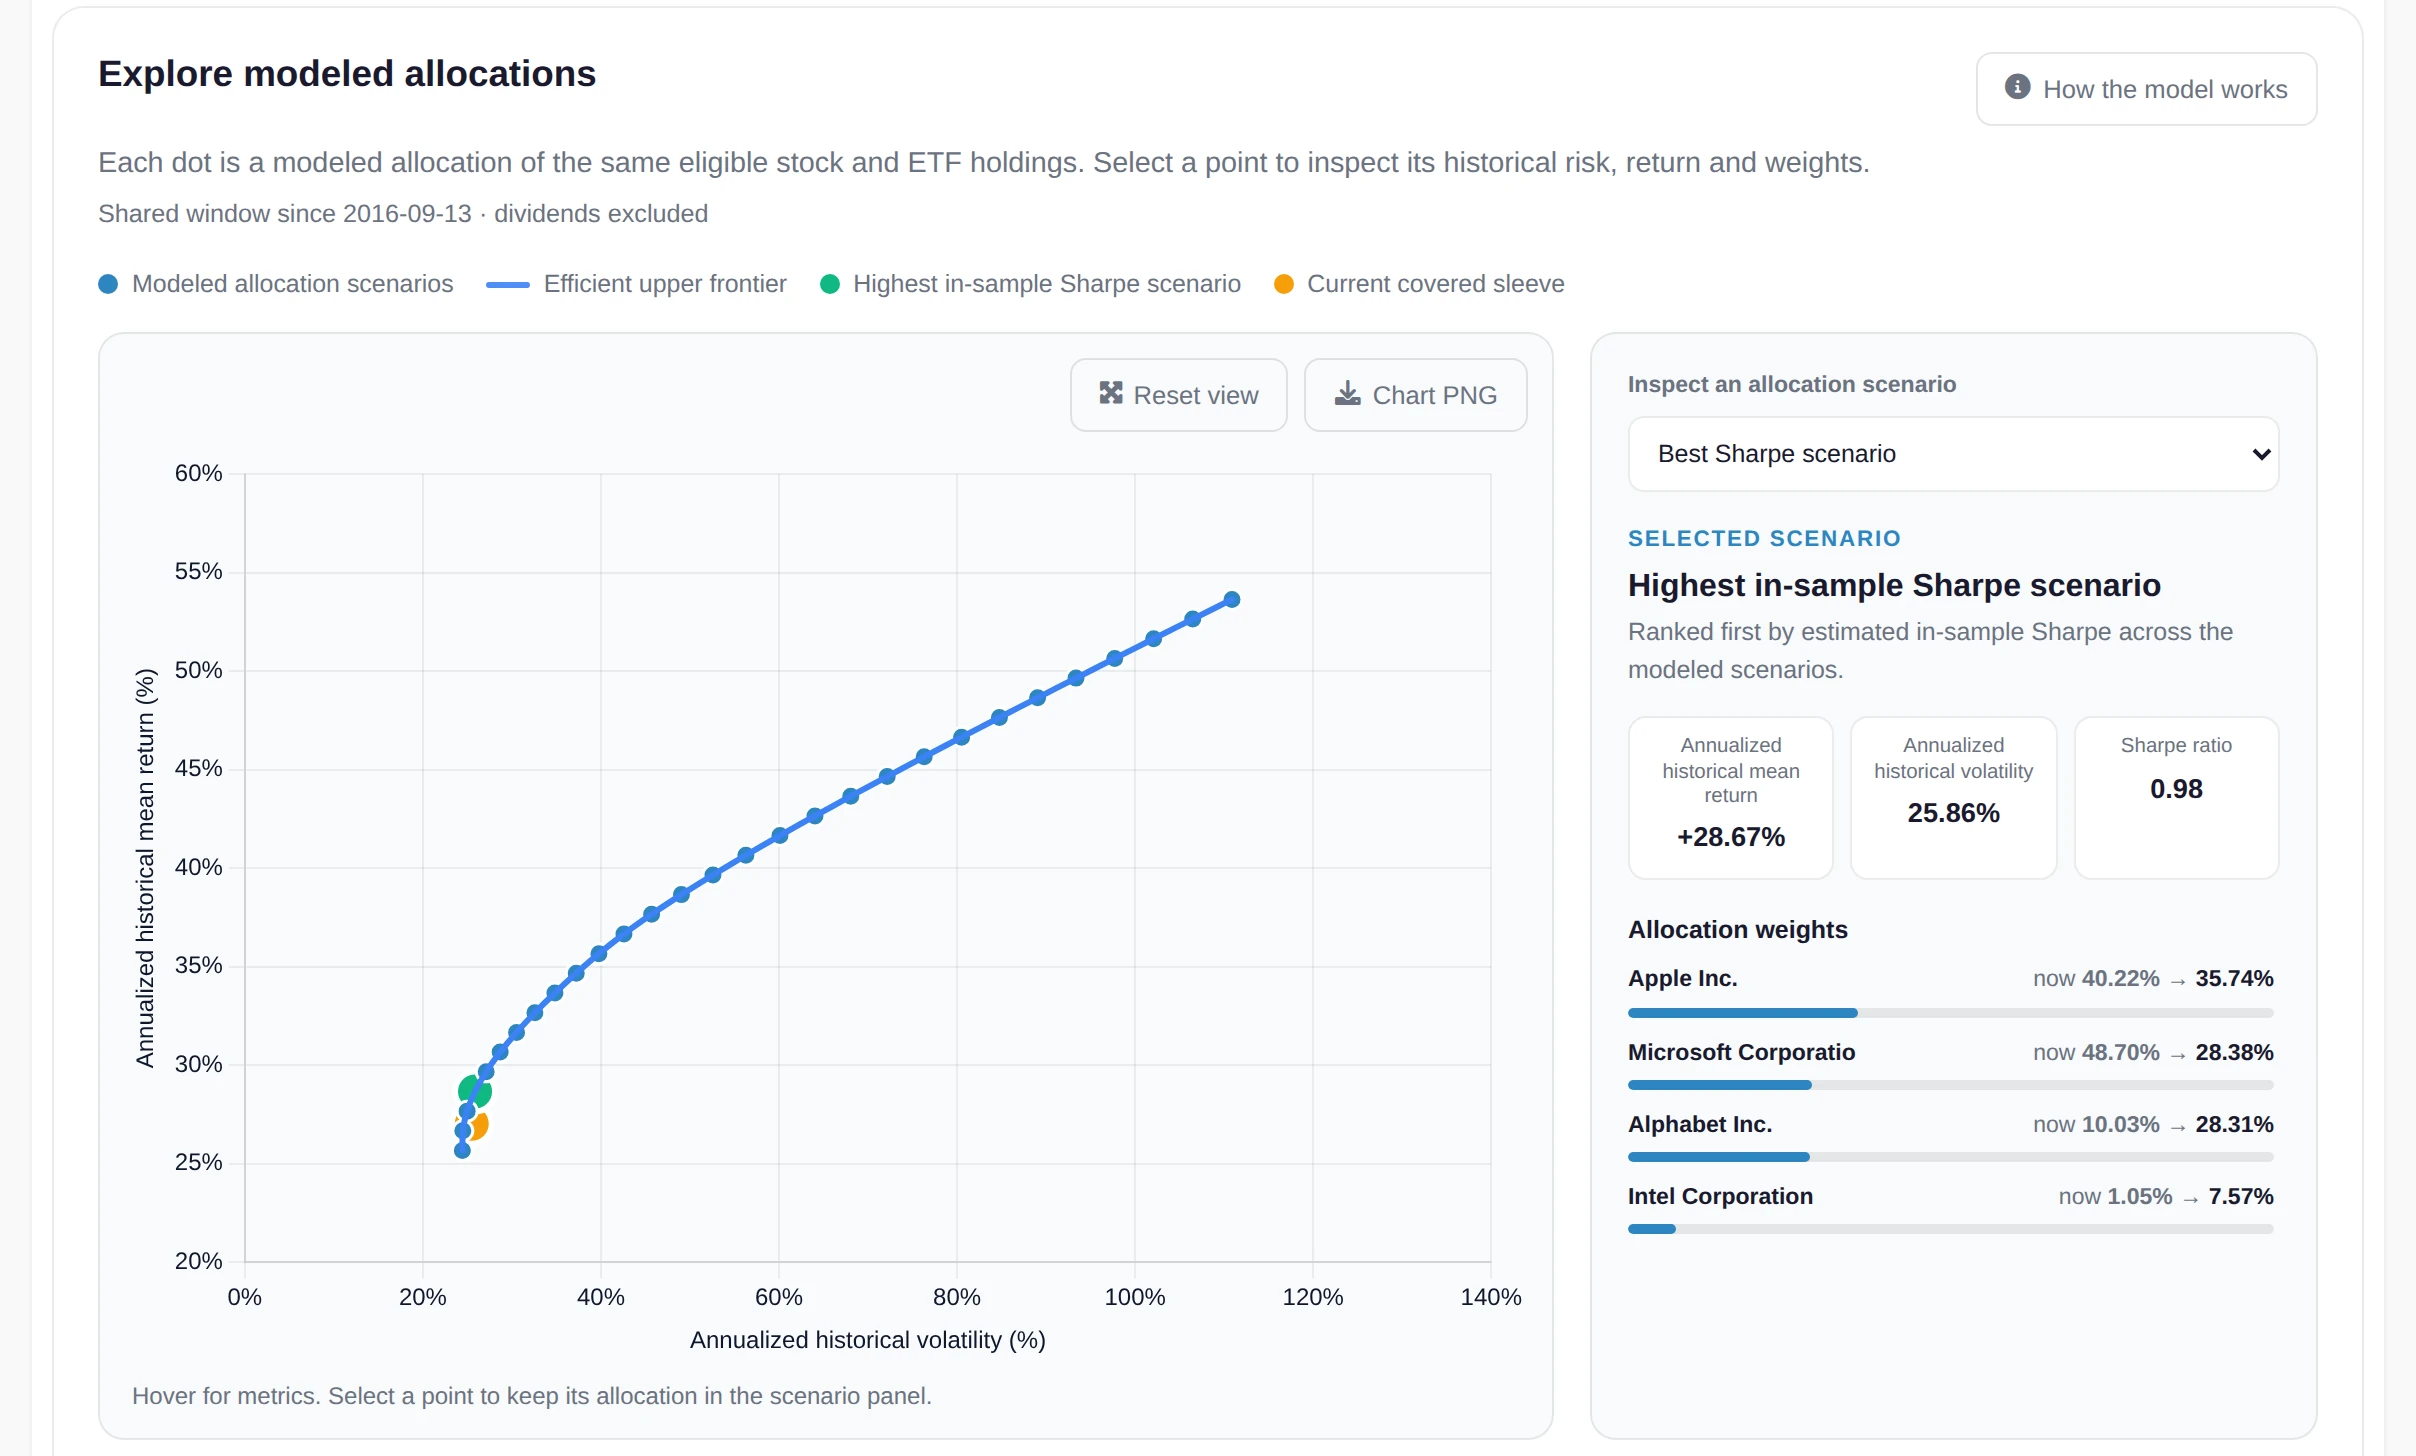
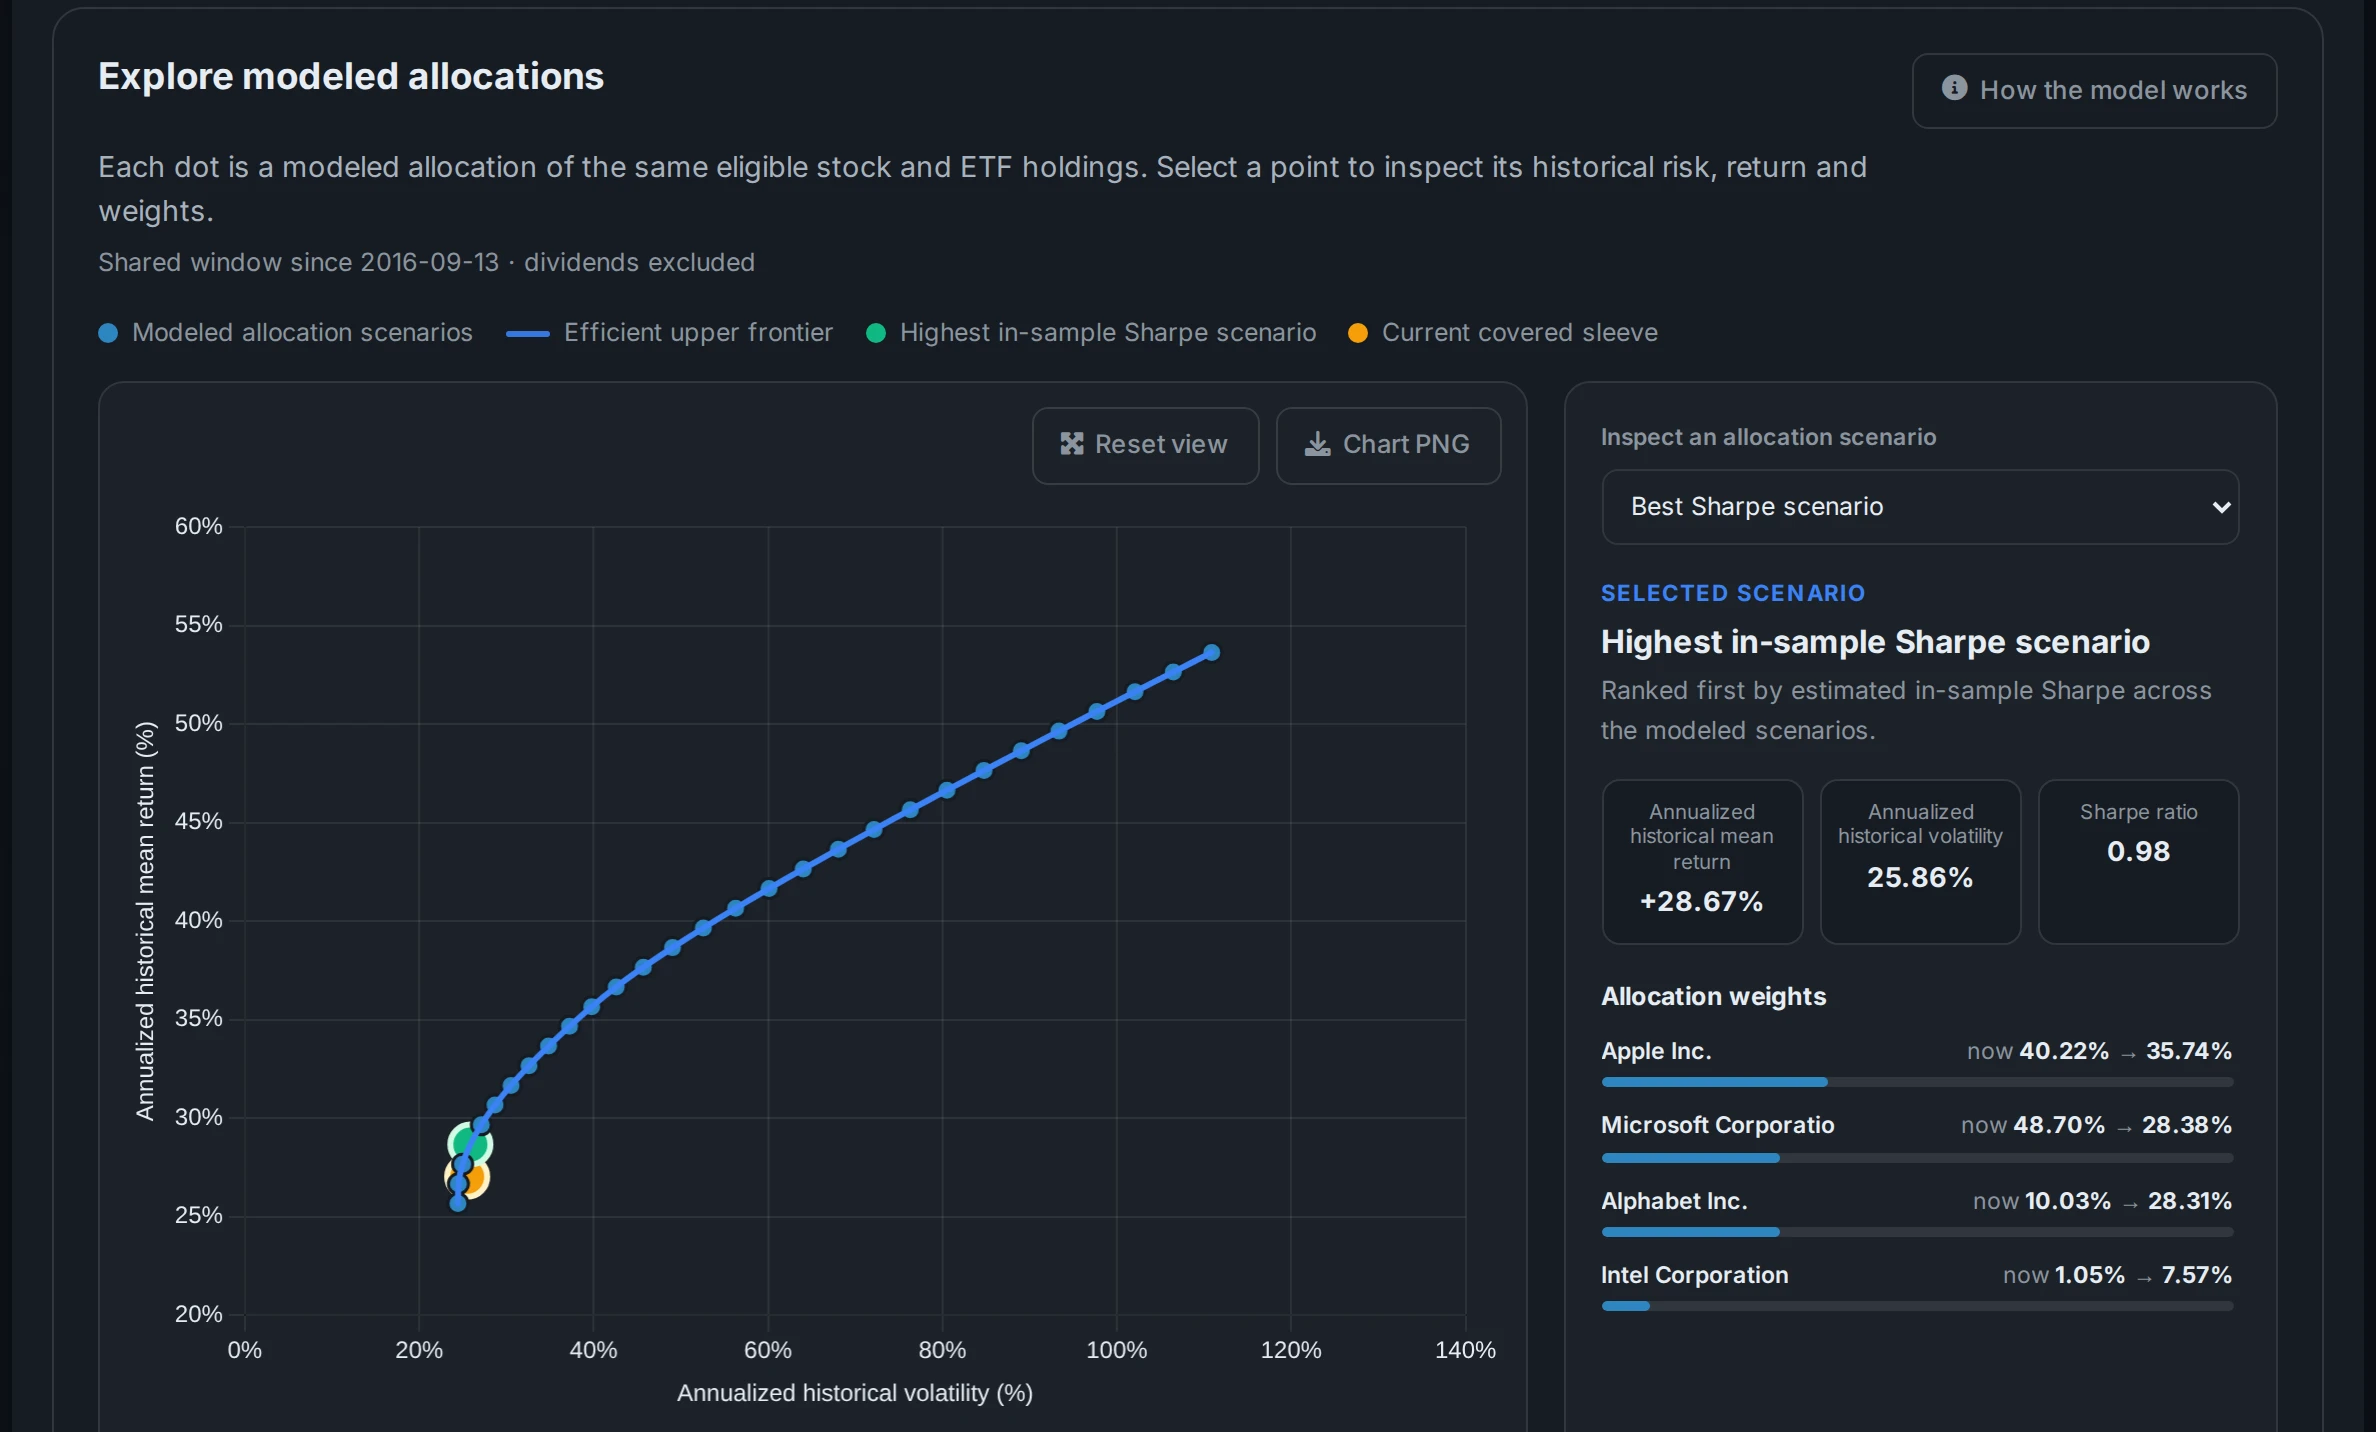
Every mix of your holdings, plotted by return and volatility. The best risk-adjusted mix sits next to your current weights, and you can cap how much any one holding takes.
Pick any point on the curve, from the calmest mix to the one that reaches for return, and see exactly which weights move and by how much.
What the efficient frontier showsEnter a few tickers and see the mix with the best return for its risk, with a cap per holding.
See what you really own
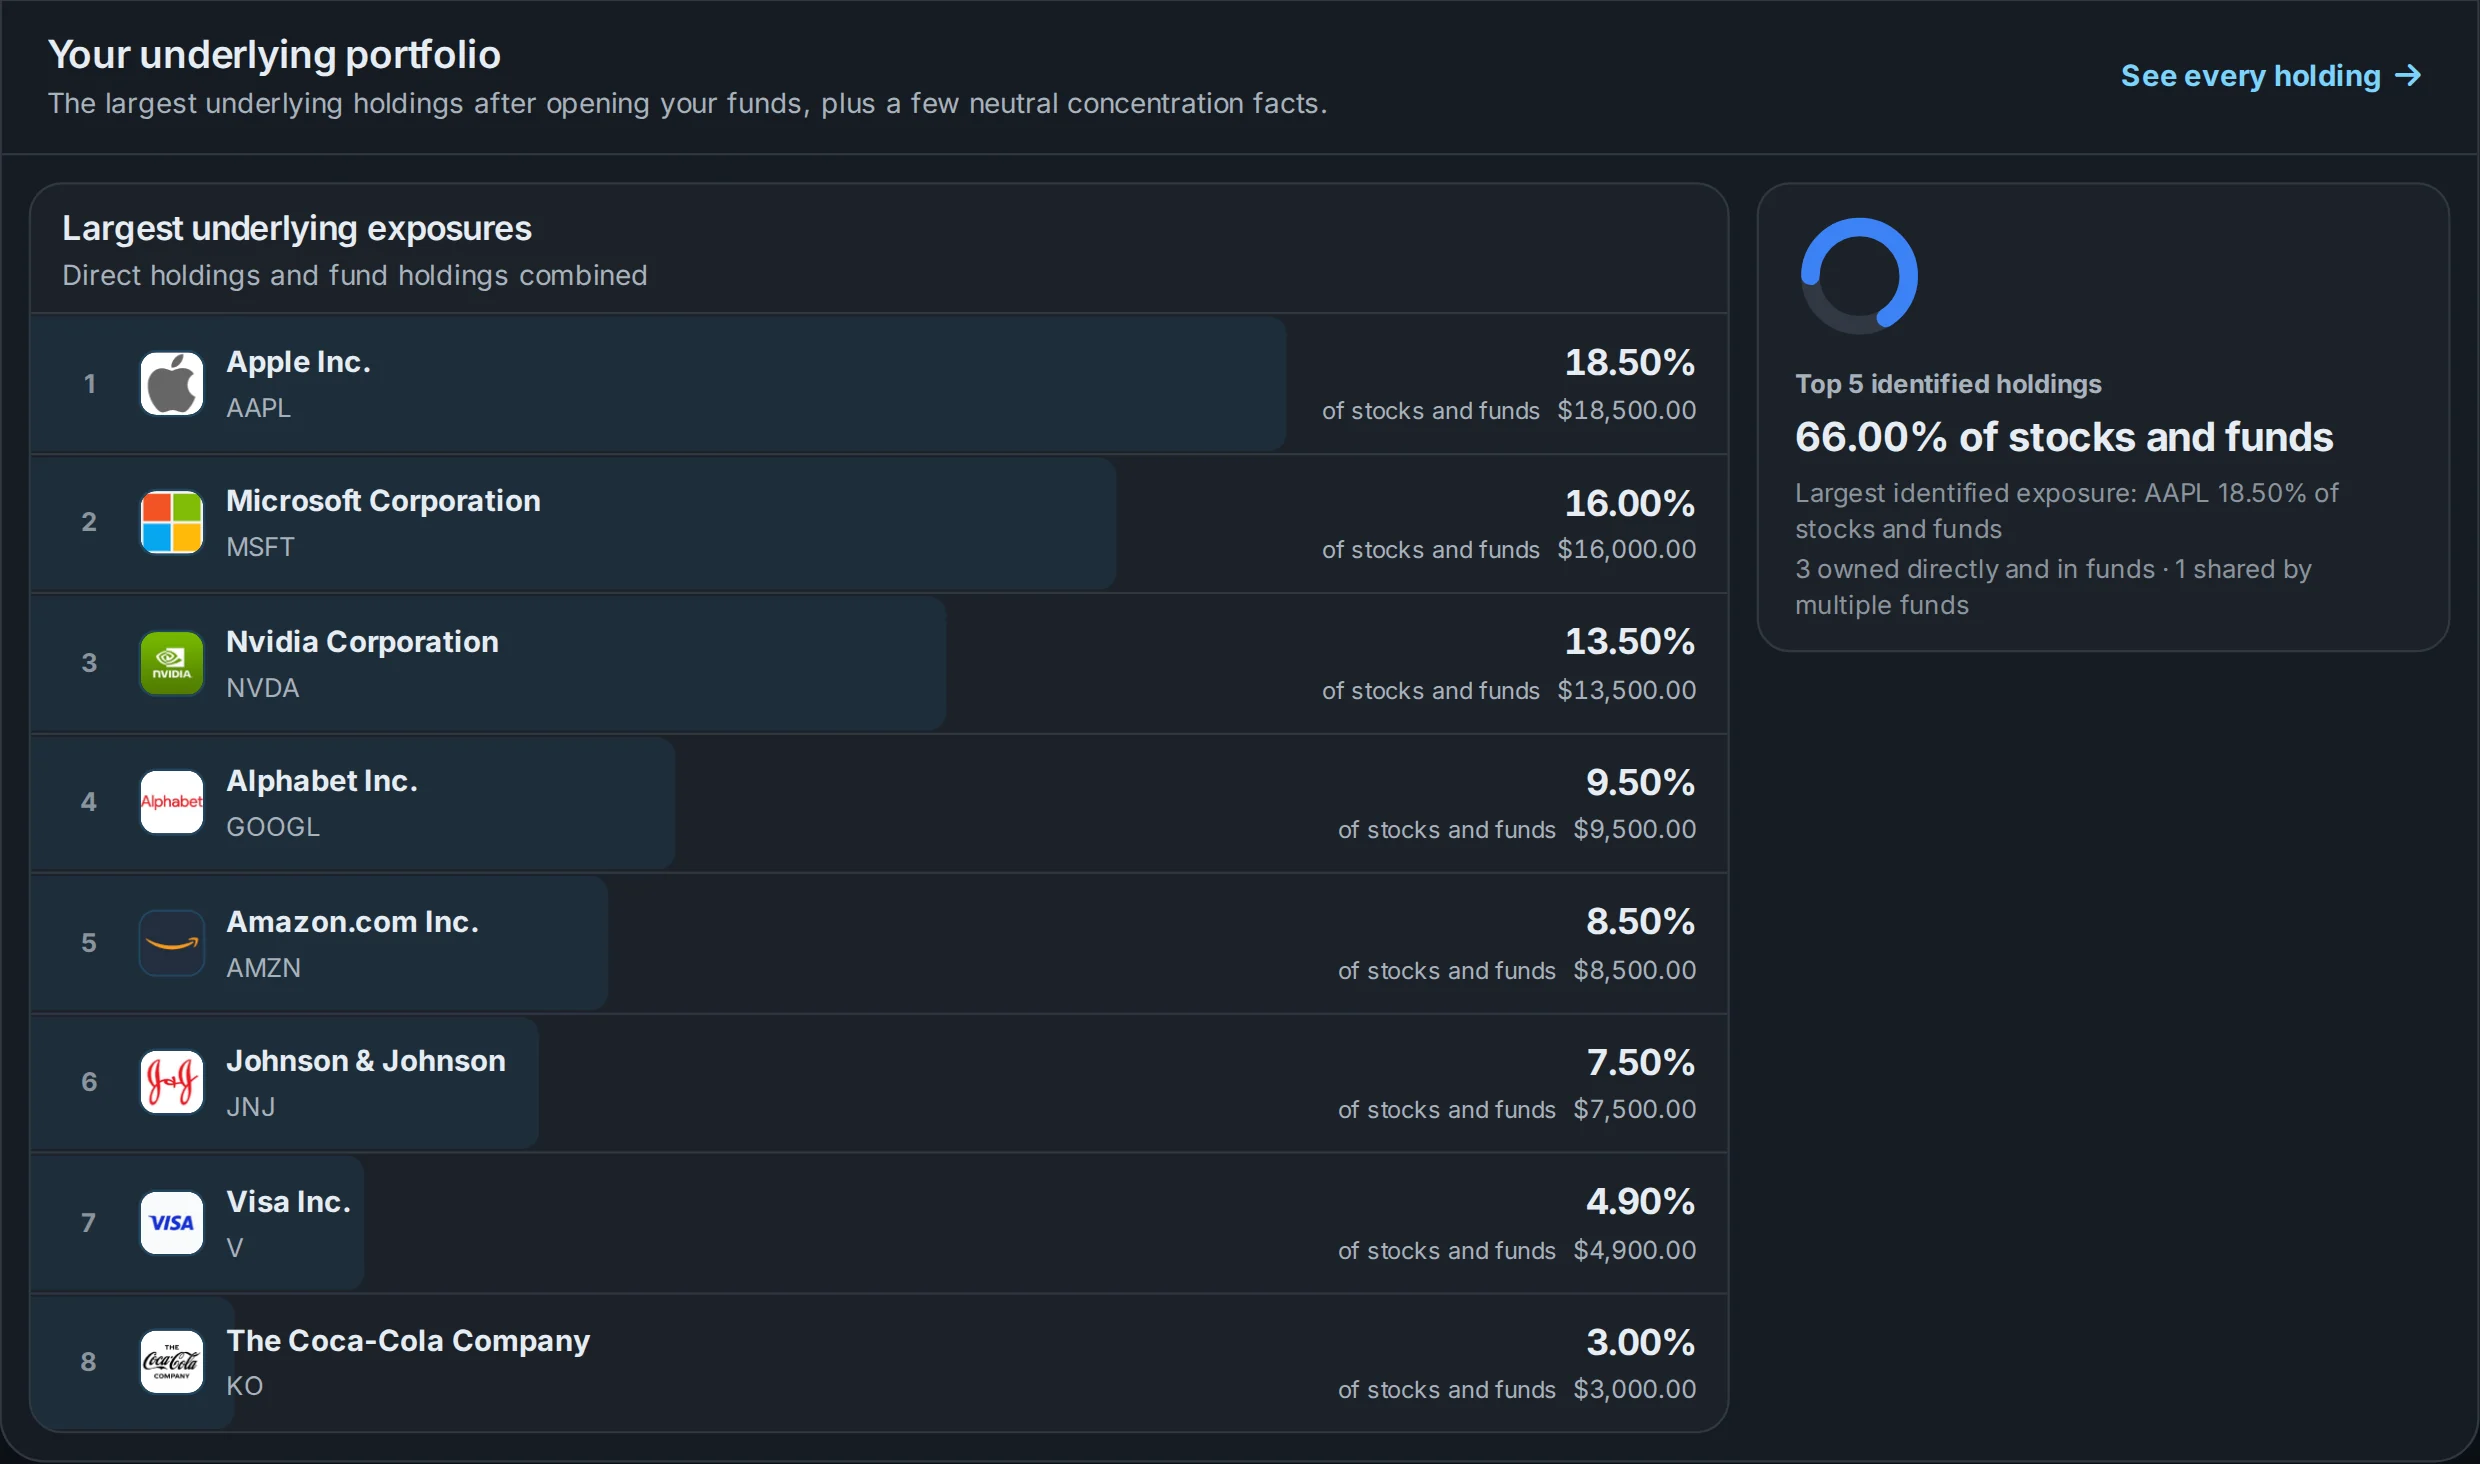
X-Ray combines the companies inside your funds with the shares you own directly. Search for a company and you see your total exposure to it in one figure, however many funds it hides in.
Filter to the holdings you own two ways, or the ones that sit in several funds at once, and see where your funds overlap.
Compare two ETFs freeAllInvestViewPortfolio X-Ray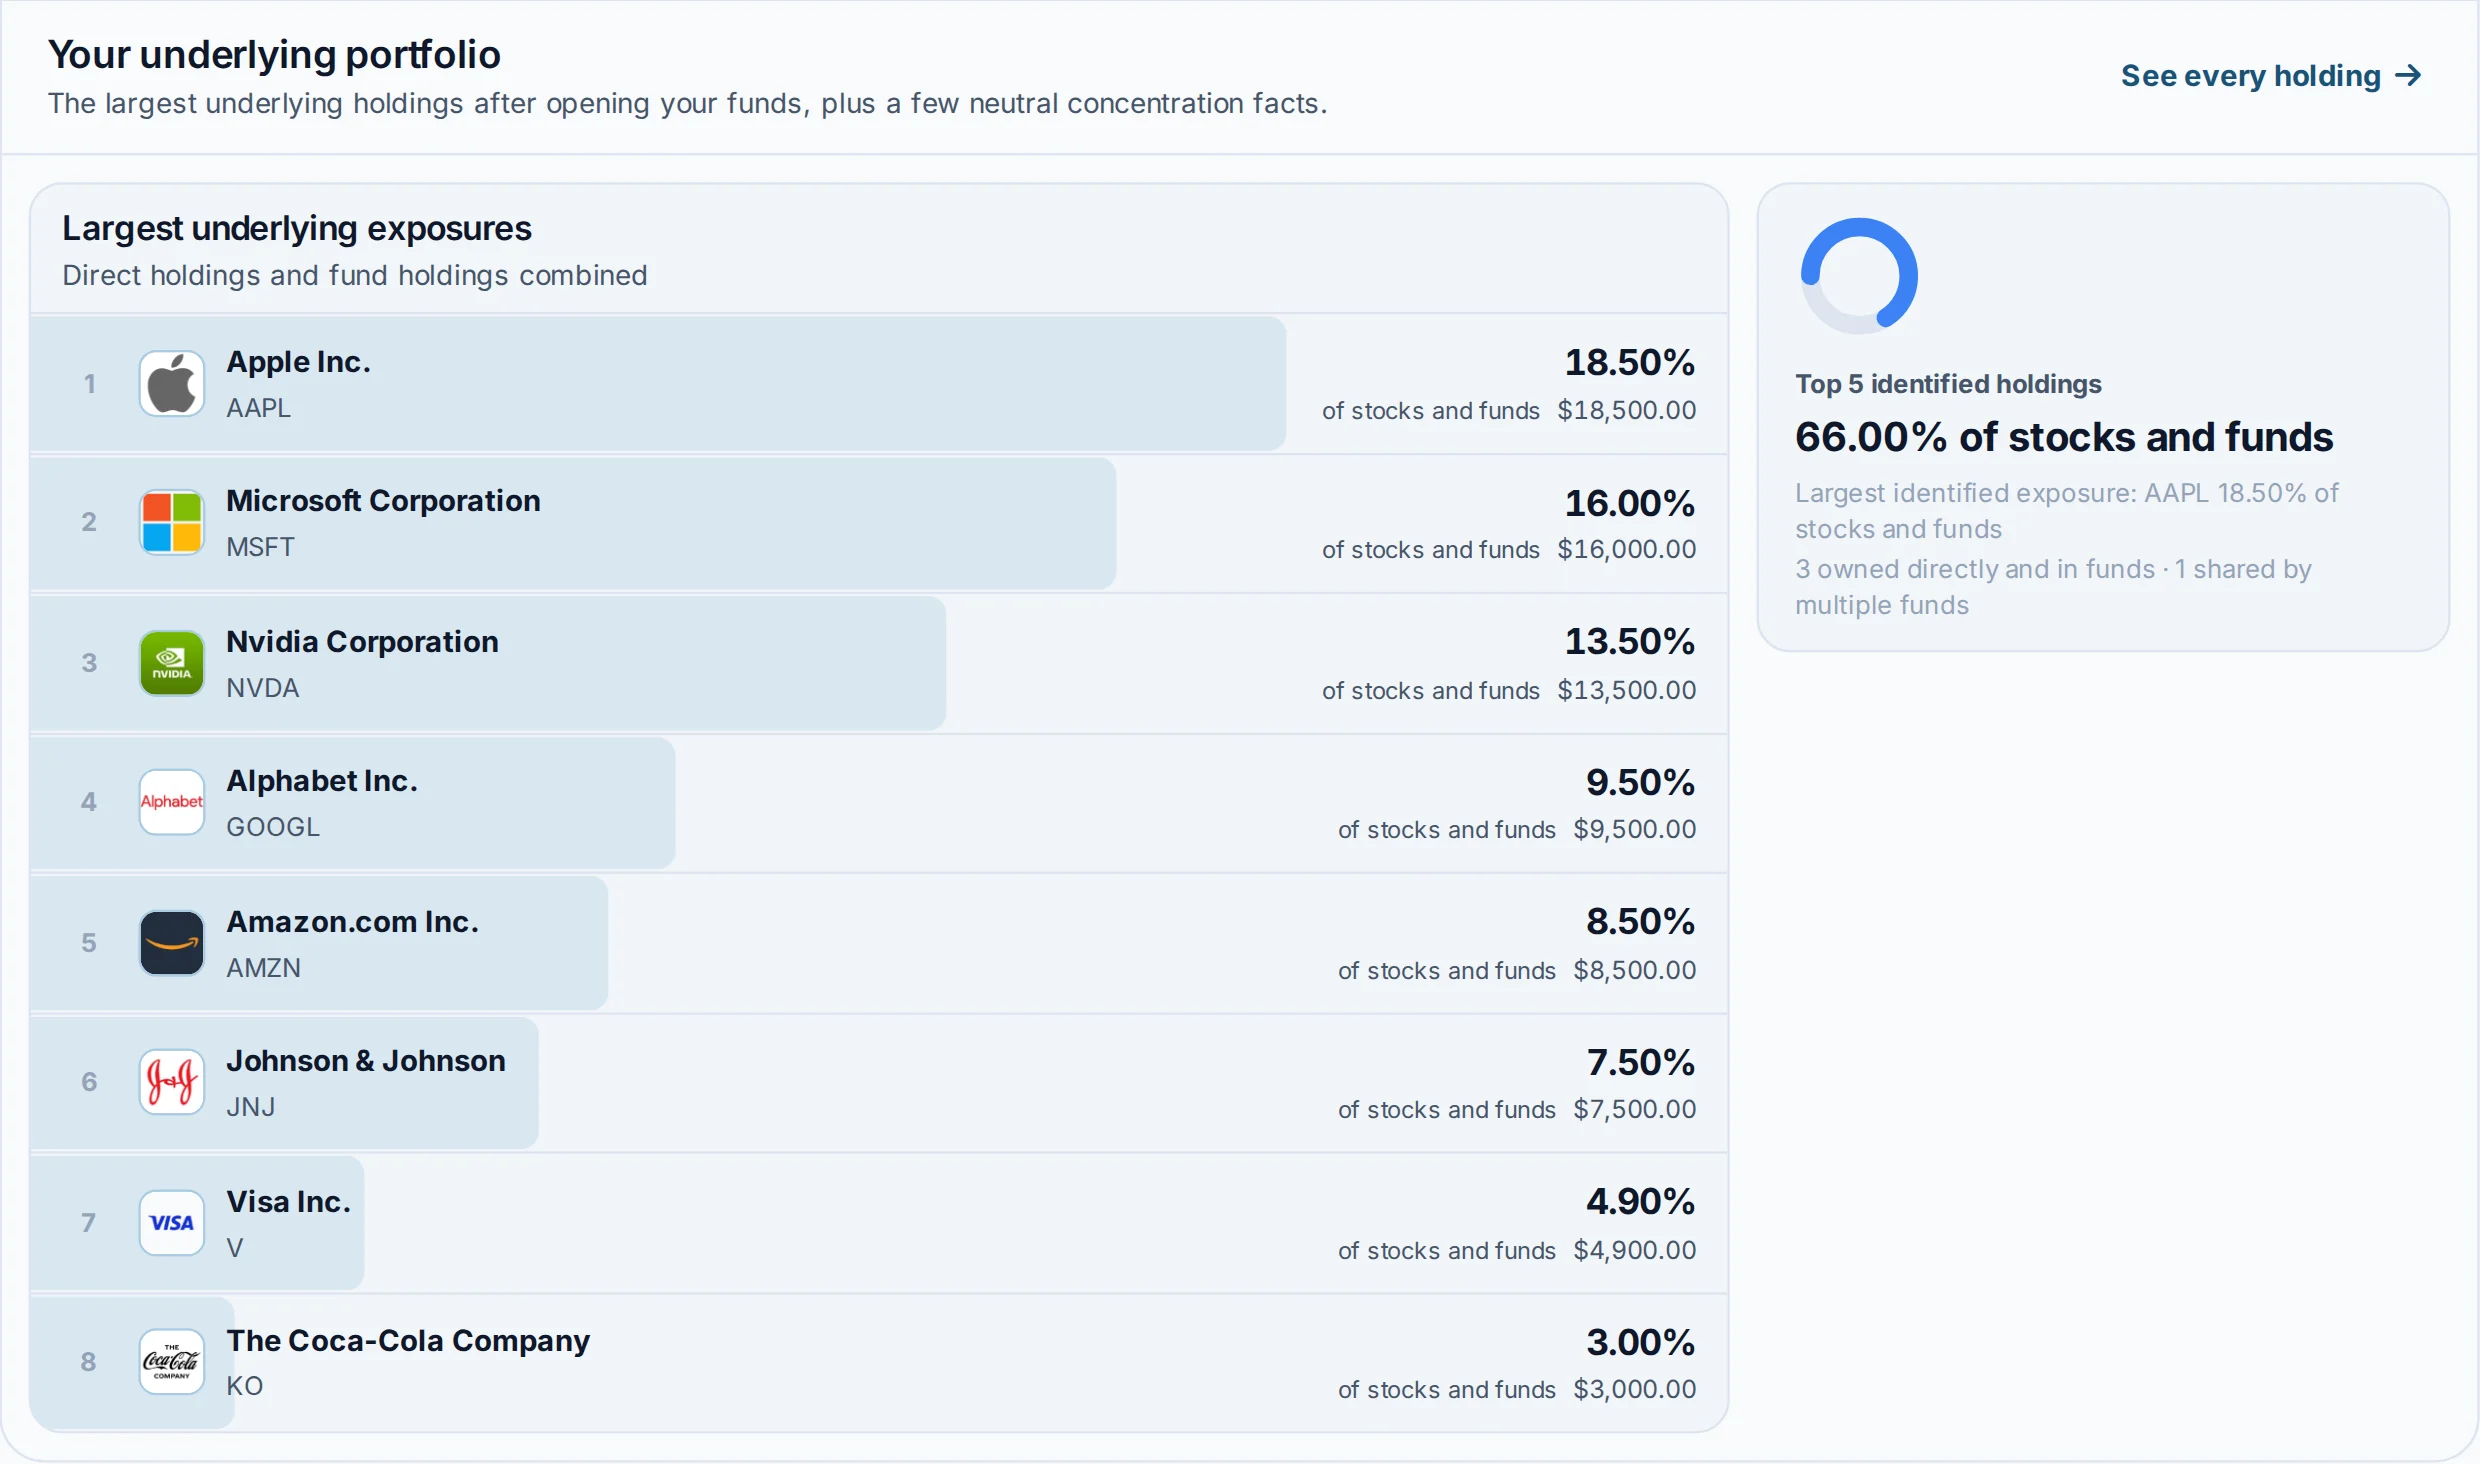
See how your holdings handle a crash
Run Black Monday, 2008, the COVID crash and the 2022 rate shock against what you hold today. Where your holdings have prices for the period you see it position by position, and for older events your portfolio beta gives the estimate.
Each result sits next to what the index did in the same window, so you can see if you'd have fallen harder than the market.
AllInvestViewStress tests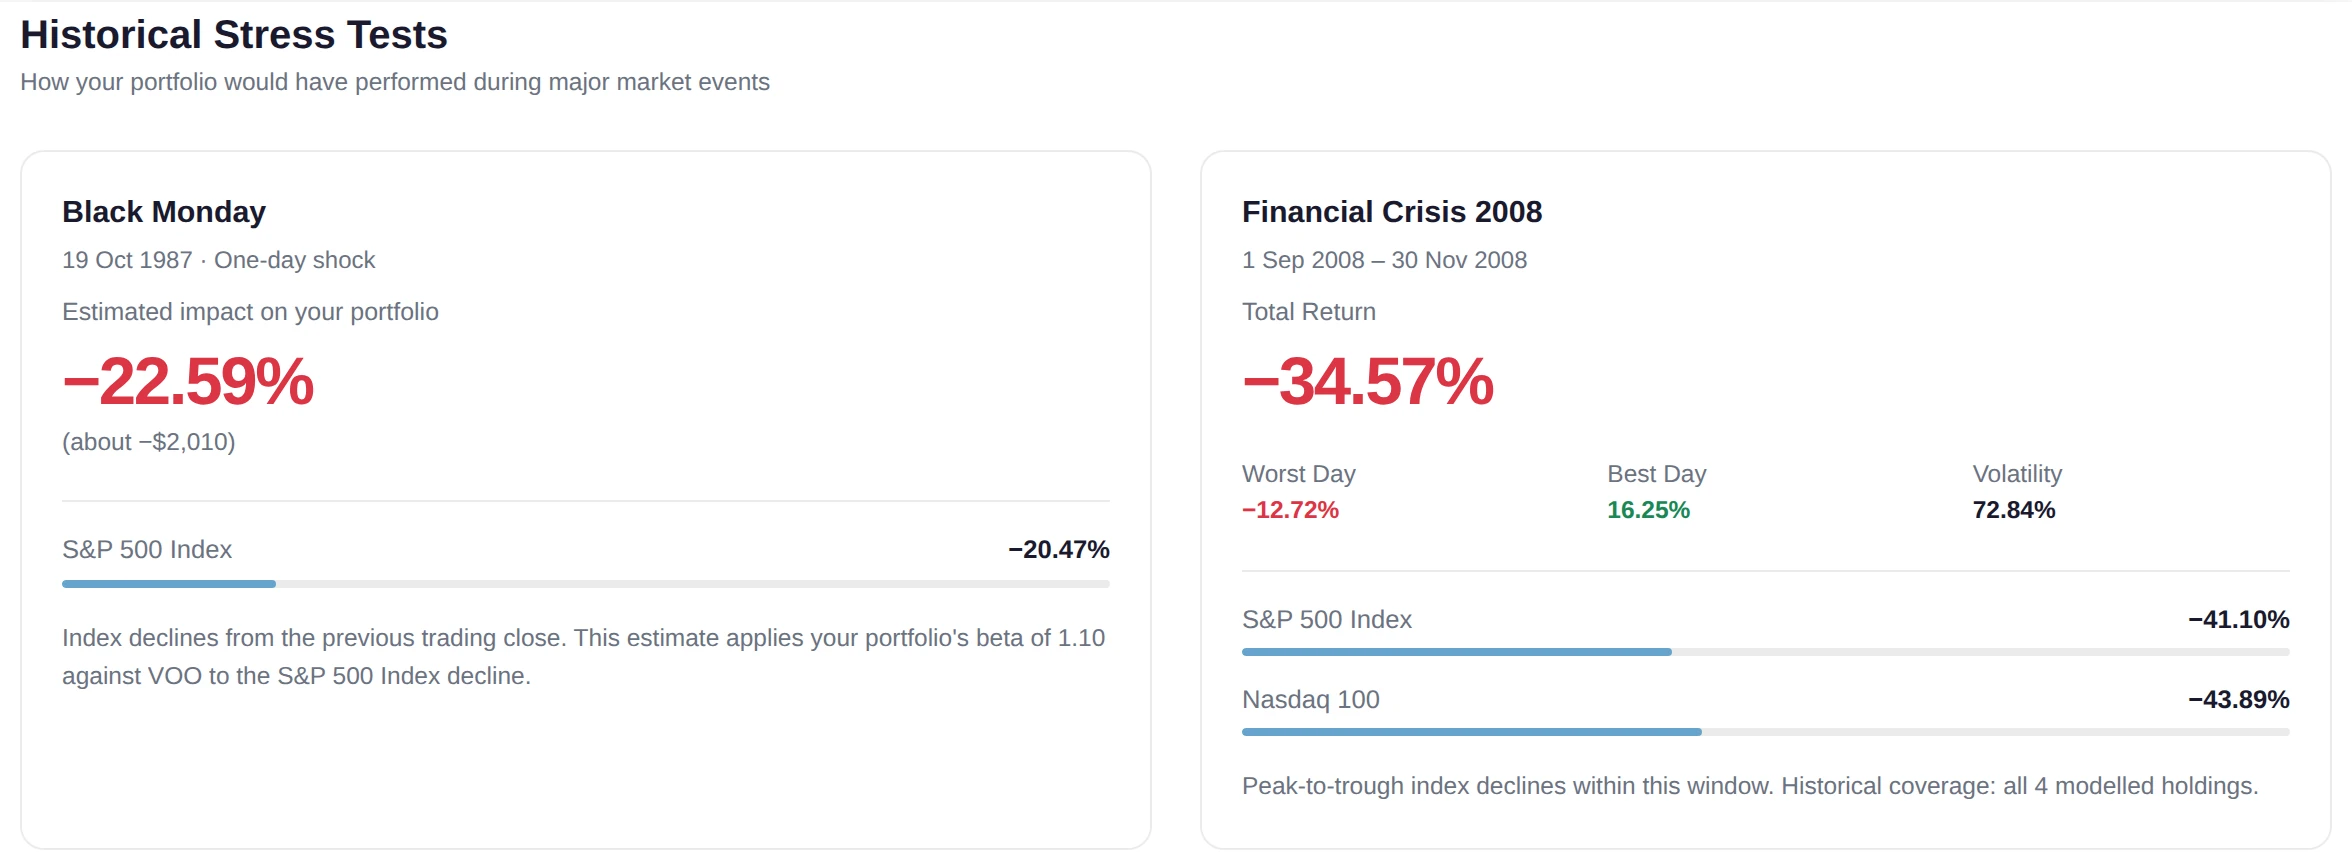
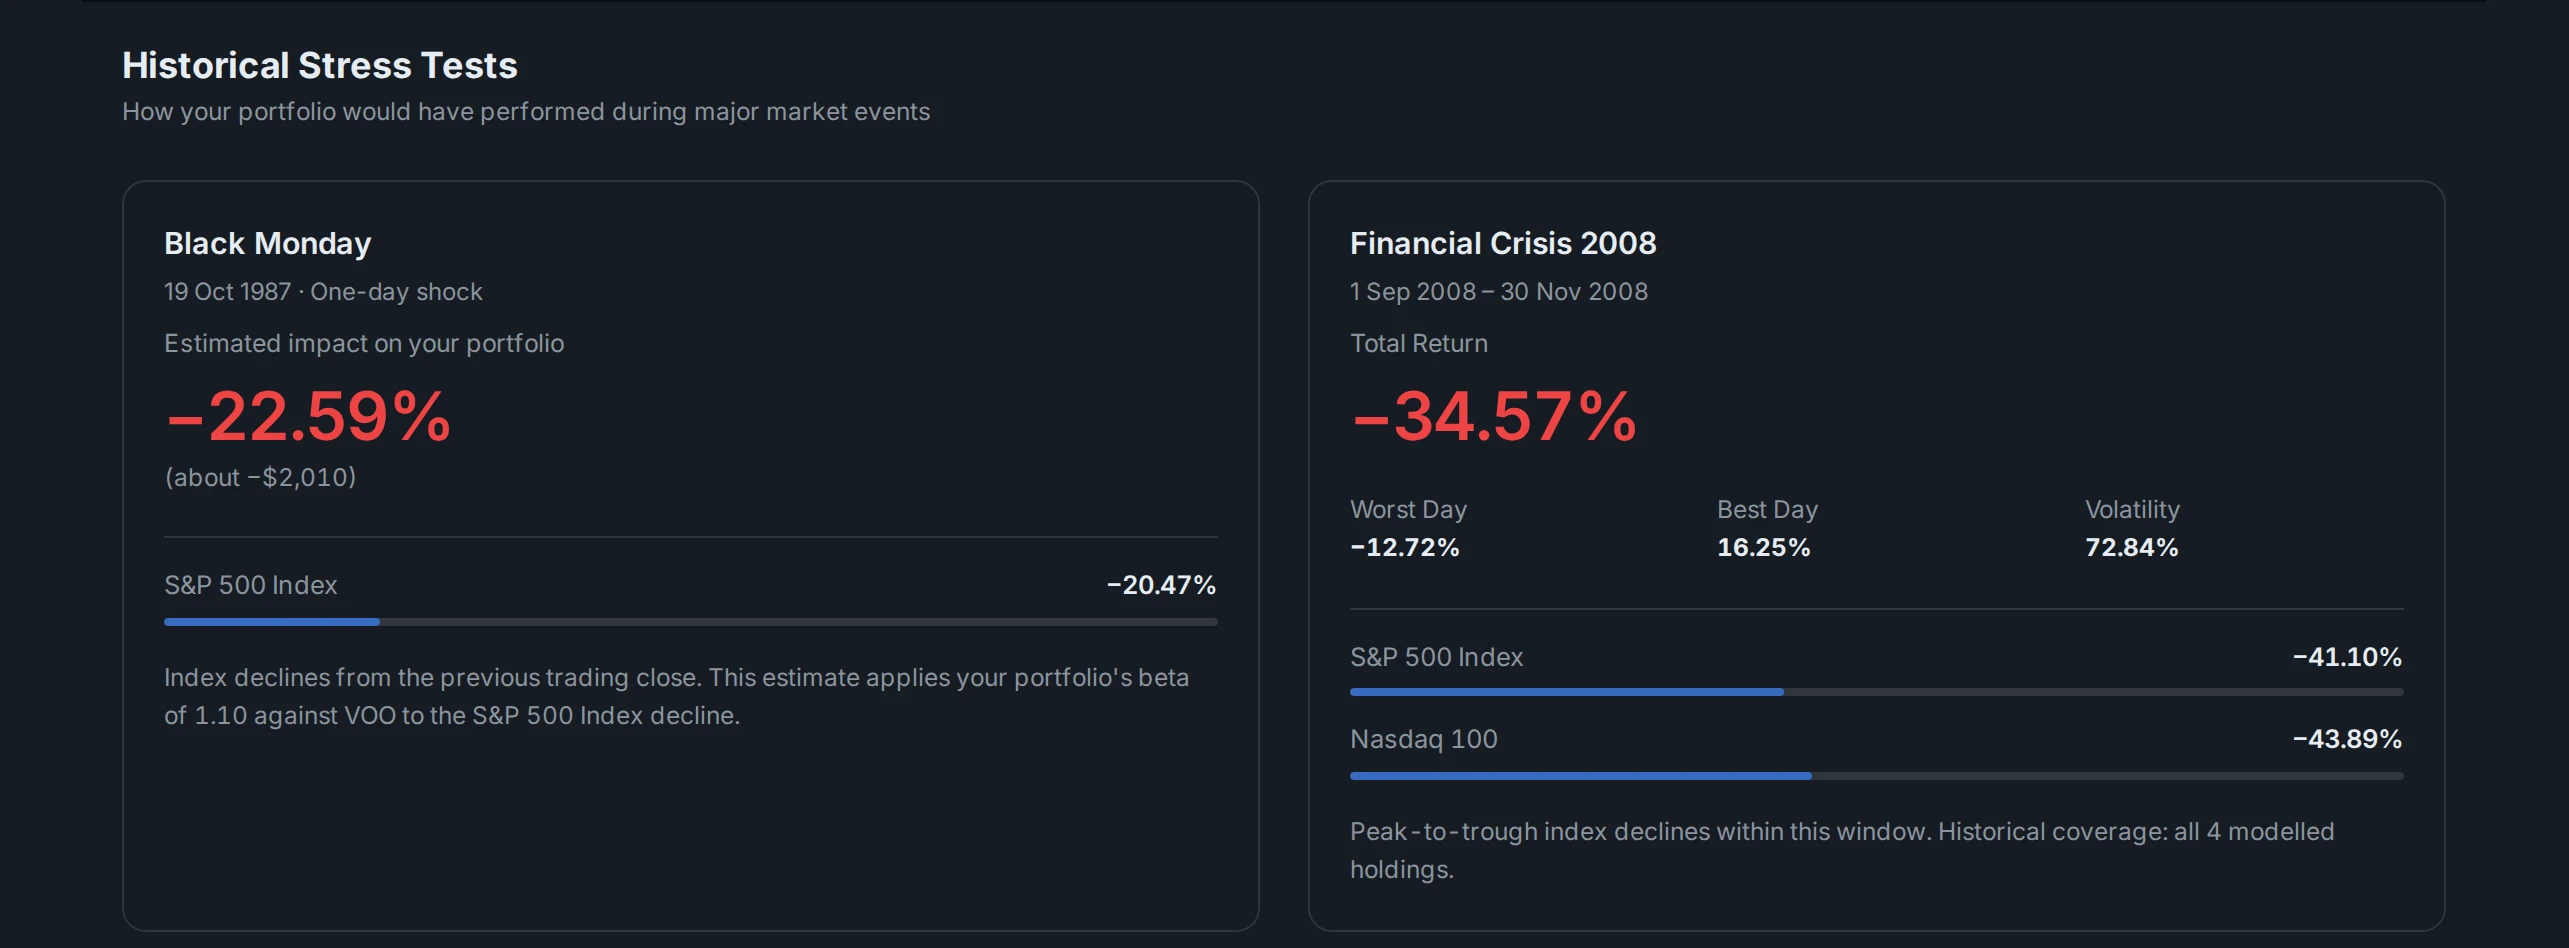
See more than one possible outcome
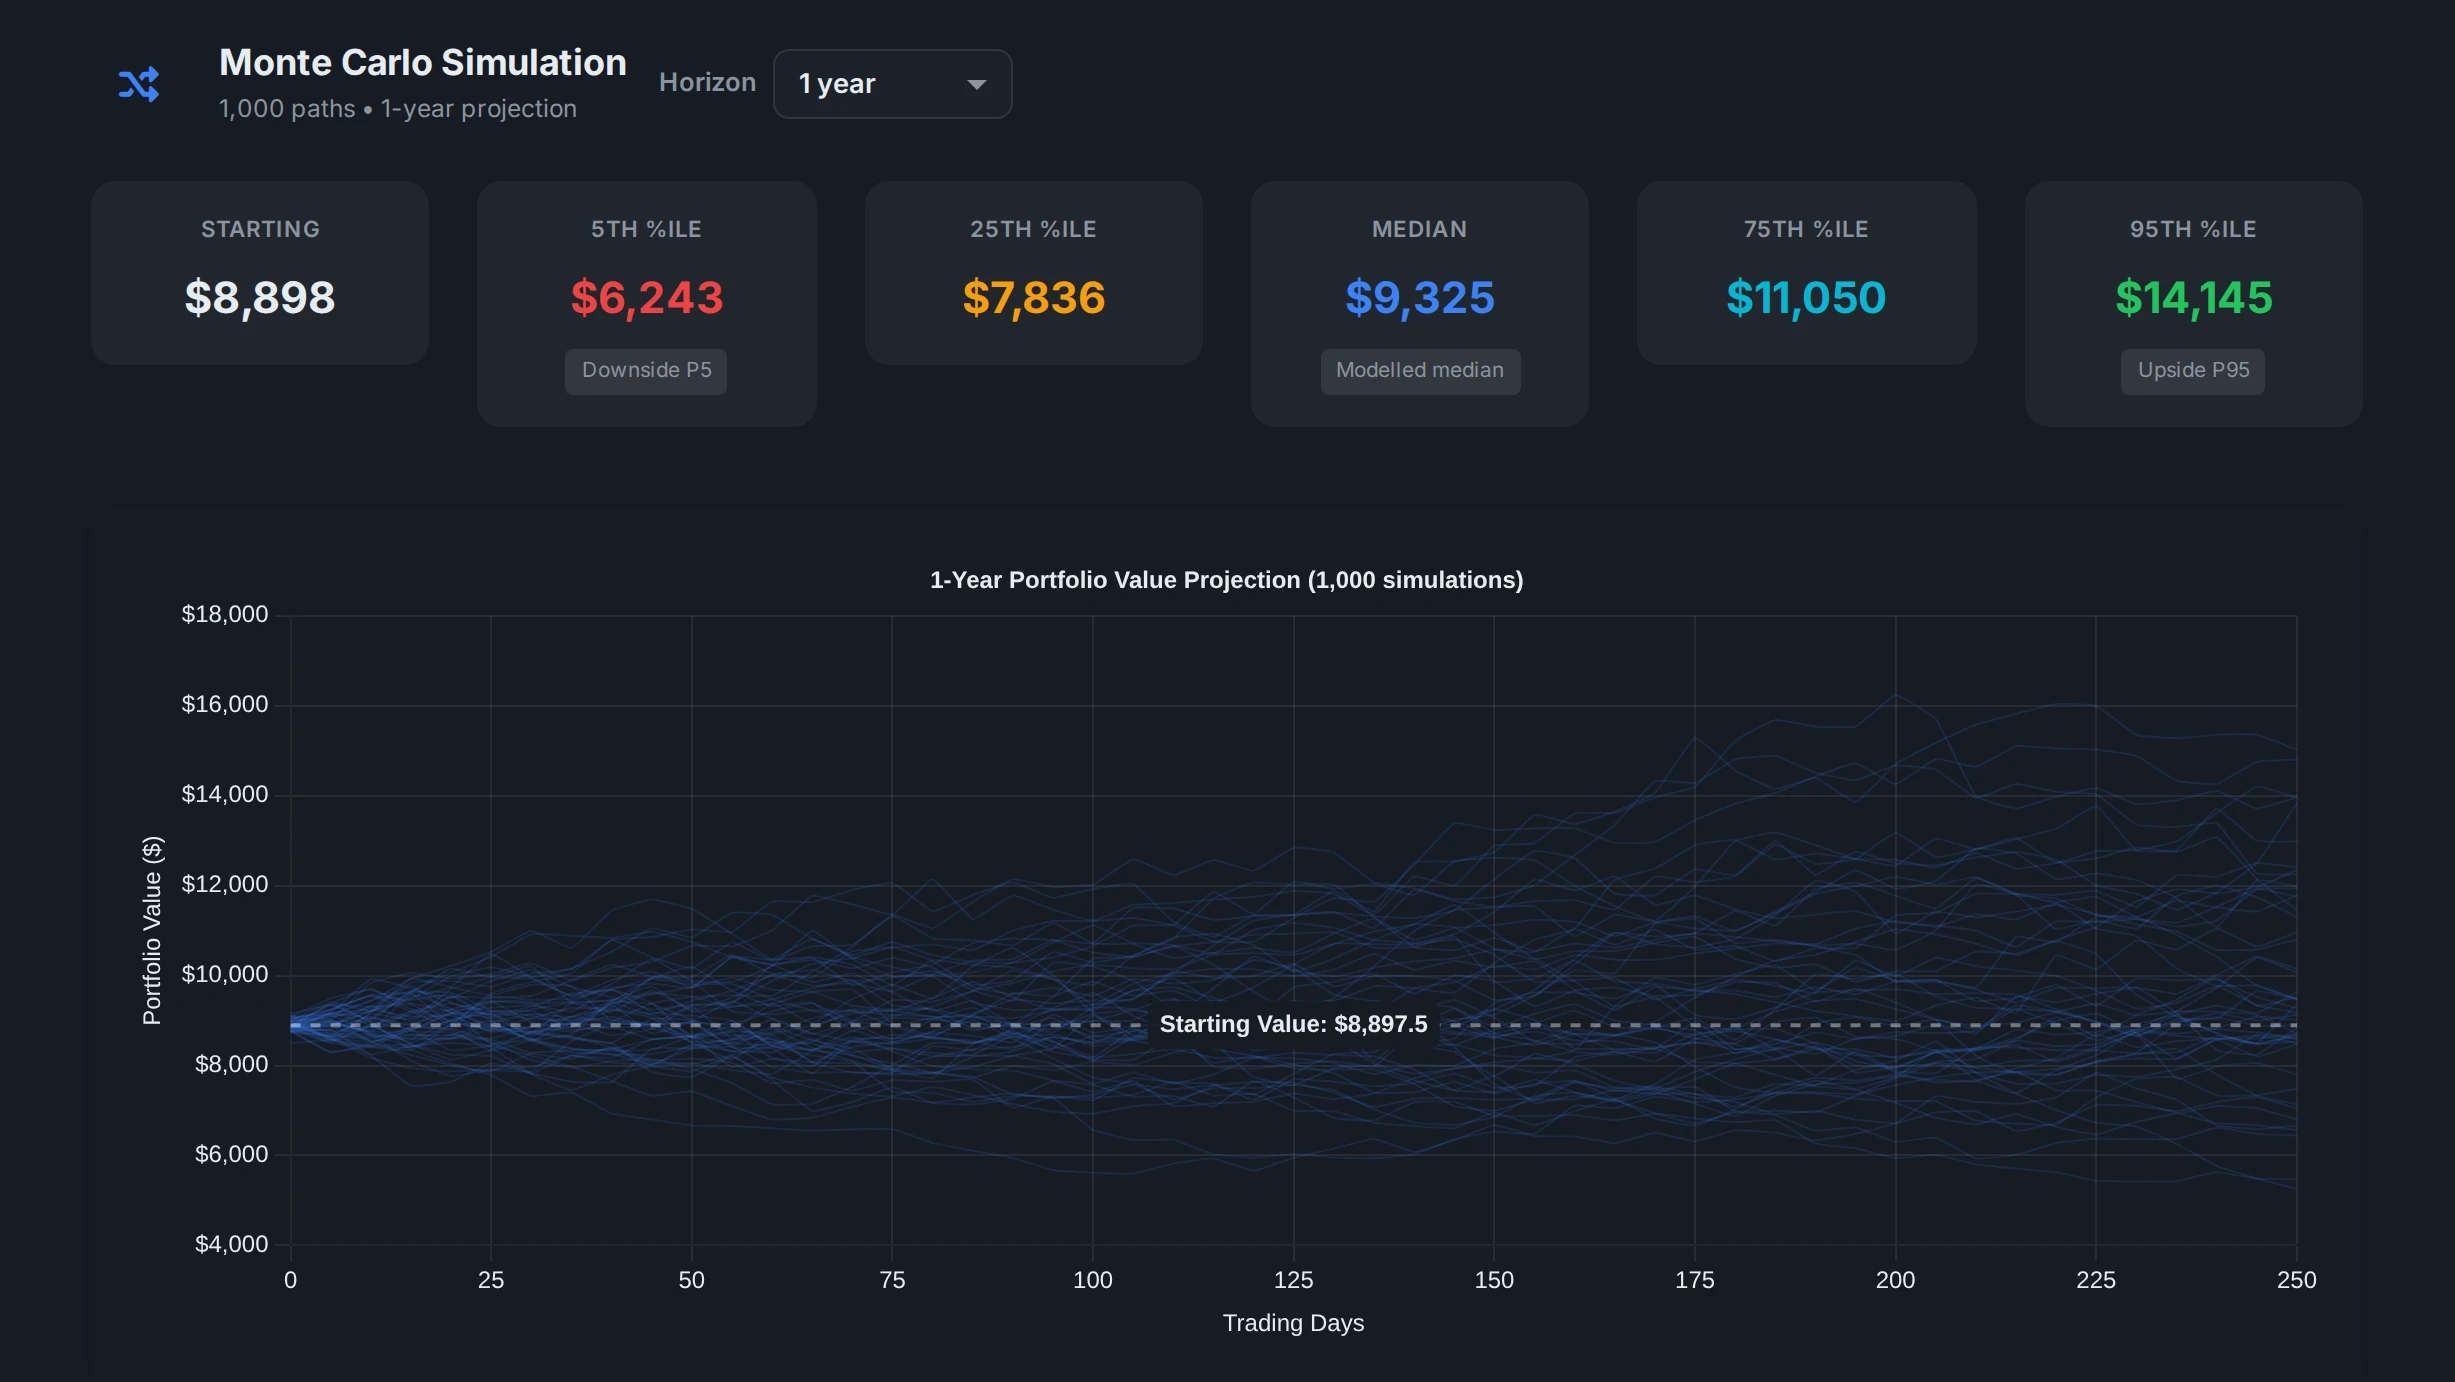
One forecast line hides the risk. Monte Carlo runs 1,000 paths from your own holdings and shows the whole range, from a bad year to a great one. Pick any horizon from one to ten years.
You can also pick any ticker as your benchmark and get alpha, beta, tracking error and information ratio against it, or put two of your portfolios side by side to test an idea before you trade it.
How Monte Carlo works Choosing a benchmarkAllInvestViewMonte Carlo simulation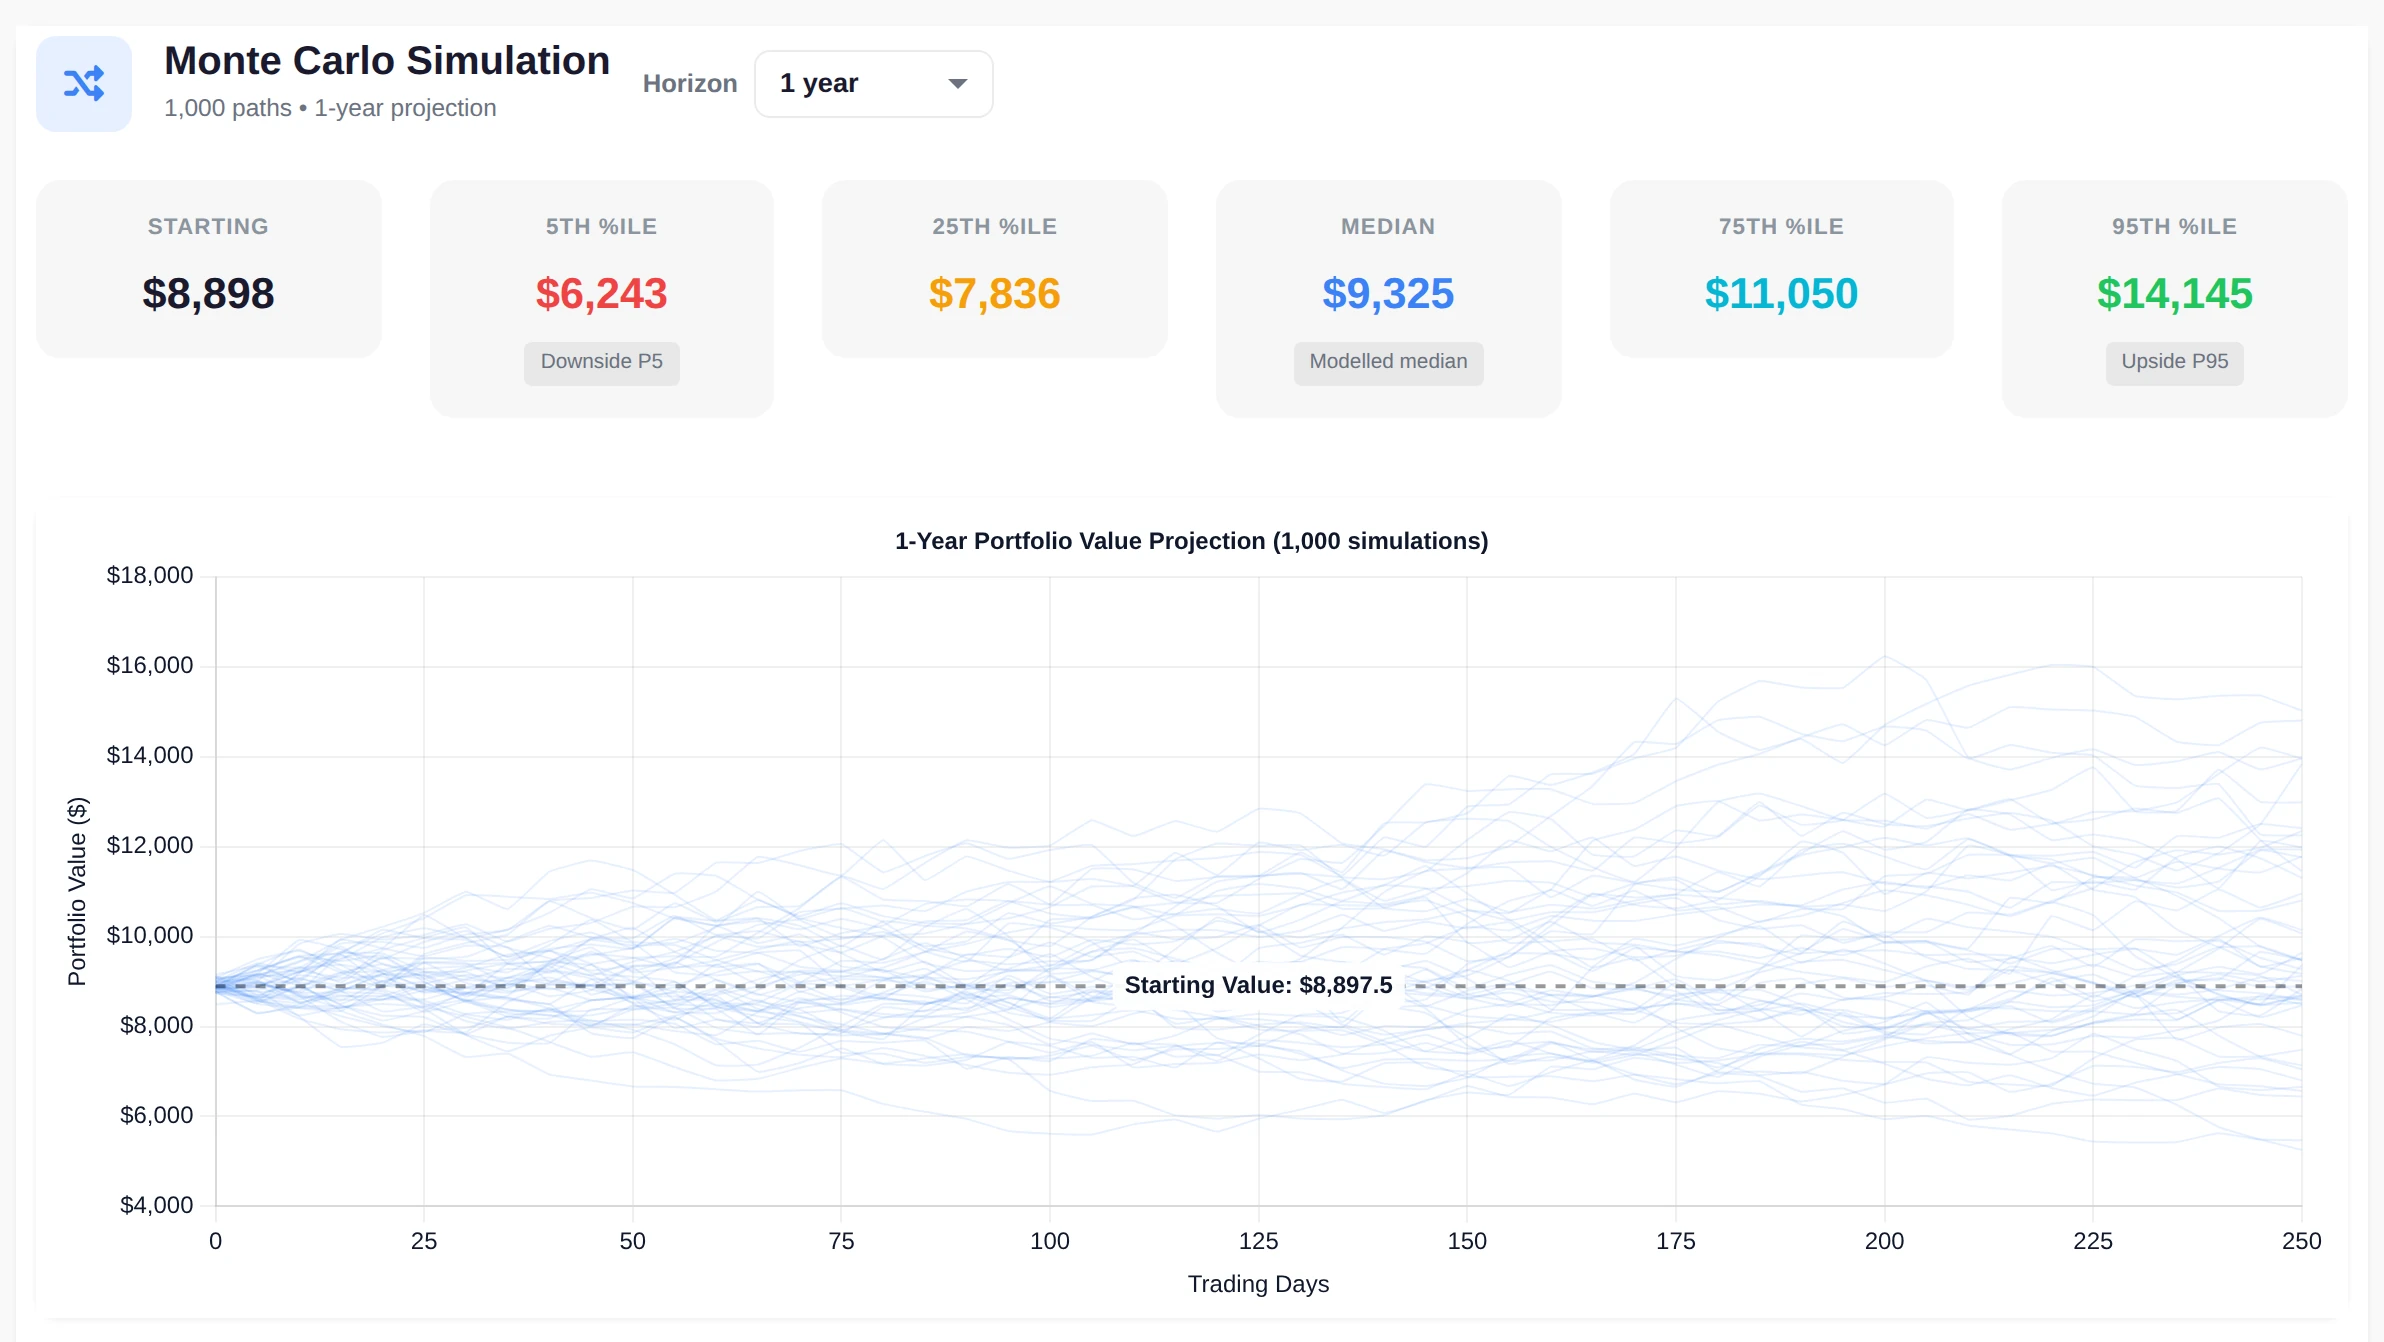
Built on your real holdings, not a pasted list
A chatbot or a spreadsheet only knows what you give it. Here every number starts from what's really in your accounts.
Your positions, kept up to date
Connect your broker or import your statements once. Every account sits in one place, and the analysis updates as your trades come in.
Real daily price history
Volatility, correlations, drawdowns and crash replays run on stored daily prices going back years, so the same question gives the same answer every time.
An assistant that reads your portfolio
Ask in plain words. It ranks the single changes that would lift your Sharpe and shows each one before and after.
- What single change improves my Sharpe the most?
- What happens if I replace QQQ with SCHD?
Try it free, no account
Portfolio analysis, answered
What does the optimizer compare?
It plots the possible mixes of your holdings by historical return and volatility, and shows the best risk-adjusted mix next to your current weights.
Which risk measures are included?
Sharpe, beta, volatility, VaR at 95% and 99%, maximum drawdown, correlations and risk contribution by holding.
Can I see my total exposure to one company across my ETFs?
X-Ray combines the companies inside your funds with the shares you own directly. Search for a company and you get one exposure figure for it, and you can see which holdings you own two ways or through several funds.
How do the stress tests work?
Four market shocks are replayed from your holdings' prices. When those prices do not reach back far enough, your portfolio beta gives an estimate.
What does the Monte Carlo simulation show?
It runs 1,000 possible paths and shows percentile outcomes over a horizon of one to ten years.
Can I compare my portfolio with my own benchmark?
Yes. Pick any ticker as your benchmark and you get alpha, beta, tracking error and information ratio against it, with both return lines on one chart.
Is there a free portfolio analyzer?
The efficient frontier calculator, the Monte Carlo calculator and the ETF overlap tool are free and need no account. The full analyzer on your own holdings comes with a 14-day Advanced trial, no card needed.
Can I export the analysis?
Yes. The PDF includes risk measures, holdings, correlations and stress results.
Which plan includes the analyzer?
It is included in the 14-day Advanced trial, and after that on Starter, Advanced and Pro.
Plans
Every new account starts with 14 days of Advanced, no card. After that it moves to Free unless you pick a plan.
Free
Forever
- 1 portfolio, 10 holdings
- Dividend tracking and the assistant
Starter
Billed annually, or $8.99 monthly
- The full analyzer and X-Ray
- Broker sync
- 2 portfolios, 25 holdings
Advanced
Billed annually, or $14.99 monthly
- Everything in Starter
- Unlimited holdings, 15 portfolios
- Priority support
Pro
Billed annually, or $29.99 monthly
- Everything in Advanced
- Unlimited portfolios
- Personal setup help
See the risk behind your allocation
Find a better mix, test the downside, keep the report.
Create your free account14-day Advanced trial. No card required.
Or open the live demoScreens show demo portfolios. Figures come from historical prices and aren't a forecast or investment advice.