Vanguard's growth fund and the biggest of the group. On 29 July 2026 its index took the Morningstar name; the fund itself didn't change.
VUG vs VOO, side by sideBest Growth ETFs for 2026
The best growth ETF for most people is a cheap, broad one: VUG at 0.03% a year, or SCHG and SPYG at 0.04%. Each holds 135 to 189 large US growth companies and returned about 18% a year over the 10 years to 30 September 2026, against 15.29% for the S&P 500. For the Nasdaq-100, QQQM charges 0.15%.
Pick one, not three. They hold mostly the same companies: VUG and SCHG share 82% of their money, and NVIDIA, Apple and Microsoft alone are about a third of each. They also fall harder: in 2022 VUG lost 33.1% and the S&P 500 lost 18.2%.
Six growth ETFs, by what you want
Fees and returns from each fund's issuer, to 30 September 2026. Returns are a year, with dividends reinvested.
The broadest of the cheap three, and the best 10-year record among the broad growth funds here.
SCHG vs VOO, side by sideThe growth half of the S&P 500, so every stock in it is also in any S&P 500 fund you may already own.
SPYG vs VOO, side by sideThe same index as QQQ for less. QQQ's 20.91% a year over 10 years is the best of the growth funds here.
QQQM vs VOO, side by sideThe widest list here, with mid-size growth companies too. iShares' IWF tracks the same index for 0.18%.
VONG vs VOO, side by sideAbout 50 of the largest growth companies. The most concentrated fund here, and the deepest fall in 2022.
MGK vs VOO, side by sideGrowth ETFs compared
Tap a column to sort. Green means the fund beat the S&P 500 (VOO) over that period.
| Index | Fund assets | ||||||||
|---|---|---|---|---|---|---|---|---|---|
VUGVanguard Morningstar Growth ETF |
Morningstar US Large Cap Growth | 0.03% | 135 | $392bn | 13.09% | 26.30% | 13.87% | 17.94% | -33.13% |
SCHGSchwab U.S. Large-Cap Growth ETF |
Dow Jones U.S. Large-Cap Growth Total Stock Market | 0.04% | 189 | $63bn | 13.01% | 26.04% | 14.71% | 18.68% | -31.81% |
SPYGState Street SPDR Portfolio S&P 500 Growth ETF |
S&P 500 Growth | 0.04% | 151 | $55bn | 18.37% | 28.40% | 14.87% | 17.91% | -29.41% |
QQQMInvesco NASDAQ 100 ETF |
Nasdaq-100 | 0.15% | 102 | n/a | 23.79% | 28.11% | 16.40% | n/a | -32.45% |
VONGVanguard Russell 1000 Growth ETF |
Russell 1000 Growth | 0.06% | 371 | $56bn | 7.45% | 24.19% | 13.60% | 18.07% | -29.18% |
MGKVanguard Morningstar Mega Cap Growth ETF |
Morningstar US Mega Cap Growth | 0.05% | 52 | $35bn | 15.51% | 27.41% | 15.11% | 19.00% | -33.56% |
QQQInvesco QQQ ETF |
Nasdaq-100 | 0.18% | 103 | $371bn31 March 2026 | 23.74% | 28.05% | 16.33% | 20.91% | -32.51% |
IWFiShares Russell 1000 Growth ETF |
Russell 1000 Growth | 0.18% | 372 | $122bn | 7.29% | 24.05% | 13.47% | 17.94% | -29.26% |
VGTTech sectorVanguard Information Technology ETF |
MSCI US IMI Information Technology 25/50 | 0.09% | 318 | $178bn | 35.19% | 35.04% | 20.92% | 24.72% | -29.67% |
VOOBenchmarkVanguard S&P 500 ETF |
S&P 500 | 0.03% | 505 | $1.73tn | 15.70% | 22.85% | 13.75% | 15.29% | -18.15% |
Average yearly NAV total returns to 30 September 2026; 2022 is the calendar year. Fund assets cover every share class of the fund. QQQM launched in October 2020, so it has no 10-year figure; QQQ holds the same index.
Growth ETF returns year by year
Pick an amount and a start year. Each fund's calendar-year returns, 2026 to 30 September.
| Fund | 2016 | 2017 | 2018 | 2019 | 2020 | 2021 | 2022 | 2023 | 2024 | 2025 | 2026* |
|---|---|---|---|---|---|---|---|---|---|---|---|
| VUG | 6.1% | 27.8% | -3.3% | 37.3% | 40.2% | 27.3% | -33.1% | 46.8% | 32.7% | 19.4% | 11.1% |
| QQQ | 7.0% | 32.7% | -0.1% | 39.1% | 48.6% | 27.3% | -32.5% | 54.7% | 25.6% | 20.8% | 20.9% |
| MGK | 6.4% | 29.5% | -2.9% | 37.5% | 41.0% | 28.5% | -33.6% | 51.6% | 33.0% | 20.7% | 12.5% |
| IWF | 6.9% | 30.0% | -1.7% | 36.1% | 38.2% | 27.4% | -29.3% | 42.5% | 33.1% | 18.3% | 6.2% |
| VOO | 11.9% | 21.8% | -4.4% | 31.5% | 18.4% | 28.7% | -18.2% | 26.3% | 25.0% | 17.8% | 12.7% |
VOO is the S&P 500. *2026 runs to 30 September. The chart compares VUG, QQQ, MGK and IWF with VOO from 2016; VONG tracks the same index as IWF.
NVIDIA, Apple and Microsoft are a third of most growth ETFs
Share of each fund in its largest holdings, from the funds' holdings lists in early October 2026.
Alphabet's two share classes count as two holdings in the top 10. Holdings lists dated 23 September (VONG) to 22 October 2026 (MGK); funds rebalance, so the weights move a little every day.
How much these growth ETFs overlap
The share of two funds' money that sits in the same companies.
| Fund | VUG | SCHG | SPYG | QQQM | VONG | MGK | VOO |
|---|---|---|---|---|---|---|---|
| VUG | 82% | 77% | 59% | 77% | 85% | 57% | |
| SCHG | 82% | 76% | 59% | 75% | 76% | 58% | |
| SPYG | 77% | 76% | 56% | 75% | 73% | 66% | |
| QQQM | 59% | 59% | 56% | 58% | 63% | 54% | |
| VONG | 77% | 75% | 75% | 58% | 71% | 57% | |
| MGK | 85% | 76% | 73% | 63% | 71% | 50% | |
| VOO | 57% | 58% | 66% | 54% | 57% | 50% |
82% VUG and SCHG
Two different index families, and still 82 cents of every dollar sit in the same companies. VUG and MGK share even more, 85%. Owning two of them adds very little that one doesn't already give you.
50% to 66% with the S&P 500
Every growth ETF here shares at least half its money with VOO. SPYG shares the most, 66%, because it is the growth half of the same index. If you already hold an S&P 500 fund, a growth ETF tilts you further into the same big names.
56% to 63% QQQM with the rest
The Nasdaq-100 is the most different of the group. It only holds companies listed on the Nasdaq, so there's no Visa, Mastercard or Eli Lilly, and it holds Cisco, PepsiCo and T-Mobile, which VUG and SCHG don't. Check any two funds in the free ETF overlap tool.
For every company two funds share, we take the smaller of its two weights and add them up. Same holdings lists as above.
How to choose a growth ETF
Start with the index
"Growth" means something different in each index, and it shows. Over the same 12 months to 30 September 2026:
Then the fee
On $10,000, VUG costs $3 a year, SCHG and SPYG $4, QQQM $15 and QQQ or IWF $18. For two funds on the same index, take the cheaper one: QQQM over QQQ, VONG over IWF.
Check what you already own
An S&P 500 fund already puts about 21% of your money in NVIDIA, Apple and Microsoft. A growth ETF next to it raises that share. You get more of the same companies, not many new ones.
Know how far it can fall
In 2022 VUG, QQQ and MGK each lost about a third, against 18% for the S&P 500. A tech-sector fund like VGT is a narrower bet still: 24.72% a year over 10 years, but only one sector.
Growth ETFs in the UK and Europe
Many UK and EU brokers don't sell US-listed ETFs to private investors. These UCITS funds track the same indexes.
Invesco EQQQ NASDAQ-100 UCITS ETF
- Index
- Nasdaq-100
- Fee
- 0.30% a year
- Tickers
- EQQQ (London, GBX; Xetra, EUR)
- Income
- Distributing, quarterly
- Fund size
- $21.6bn
- ISIN
- IE0032077012
iShares NASDAQ 100 UCITS ETF
- Index
- Nasdaq-100
- Fee
- 0.30% a year
- Tickers
- CNX1 (London, GBP), CNDX (London, USD), SXRV (Xetra, EUR)
- Income
- Accumulating
- Fund size
- $30.5bn
- ISIN
- IE00B53SZB19
Amundi Russell 1000 Growth UCITS ETF Acc

- Index
- Russell 1000 Growth
- Fee
- 0.19% a year
- Tickers
- MWOT (London, GBP), MWOW (Xetra, EUR)
- Income
- Accumulating
- Fund size
- $0.65bn
- ISIN
- IE0005E8B9S4
See what your growth ETFs hold together
How much NVIDIA you own across your funds and shares
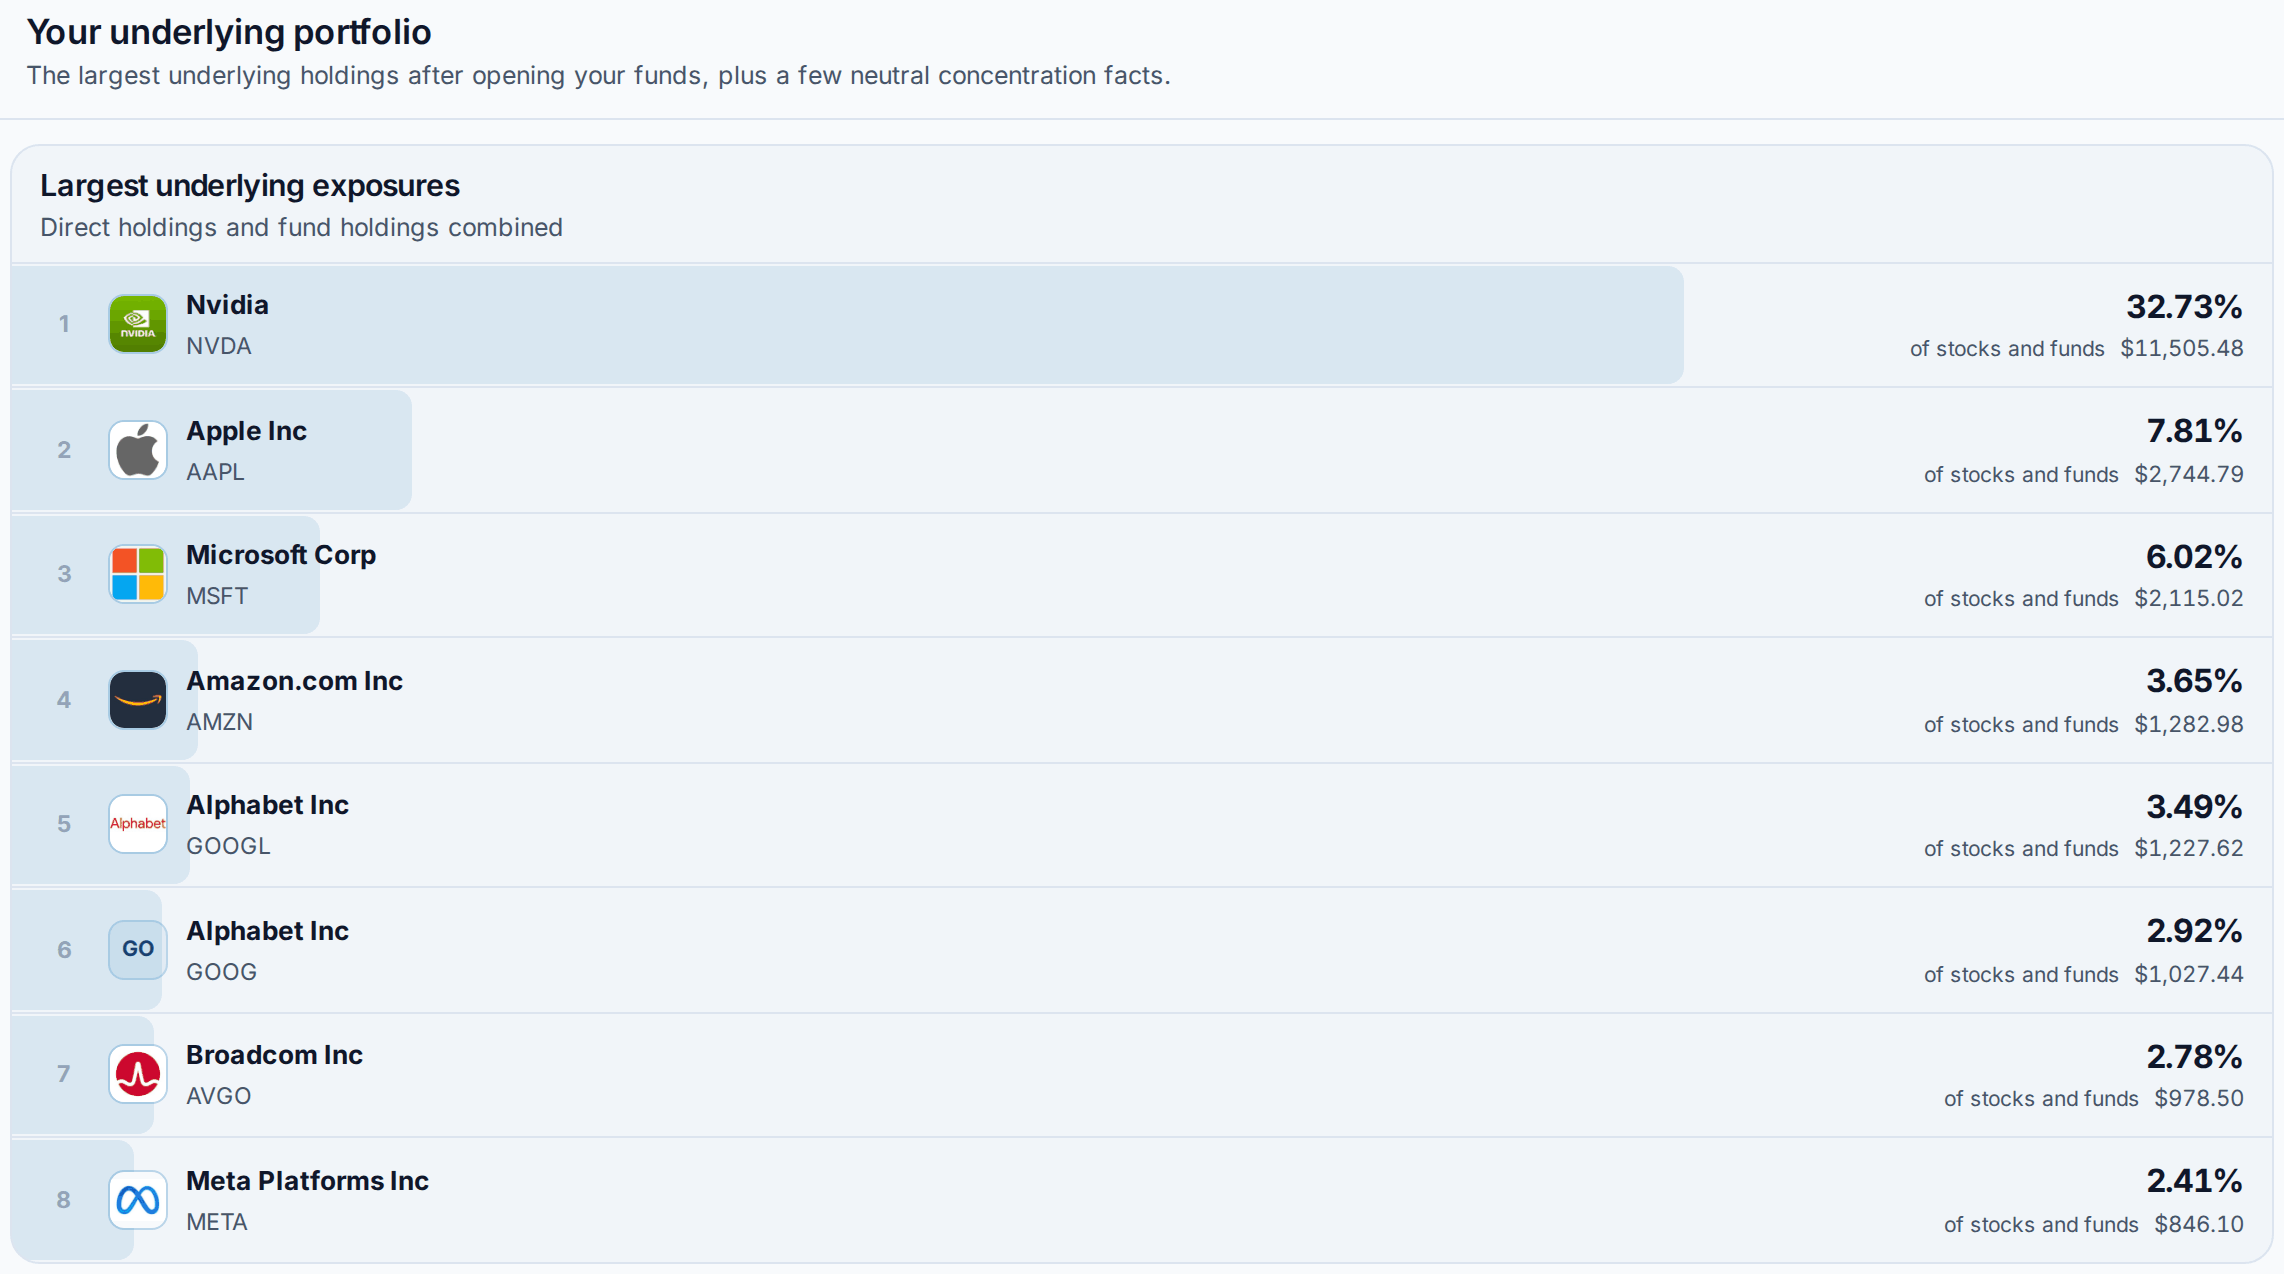
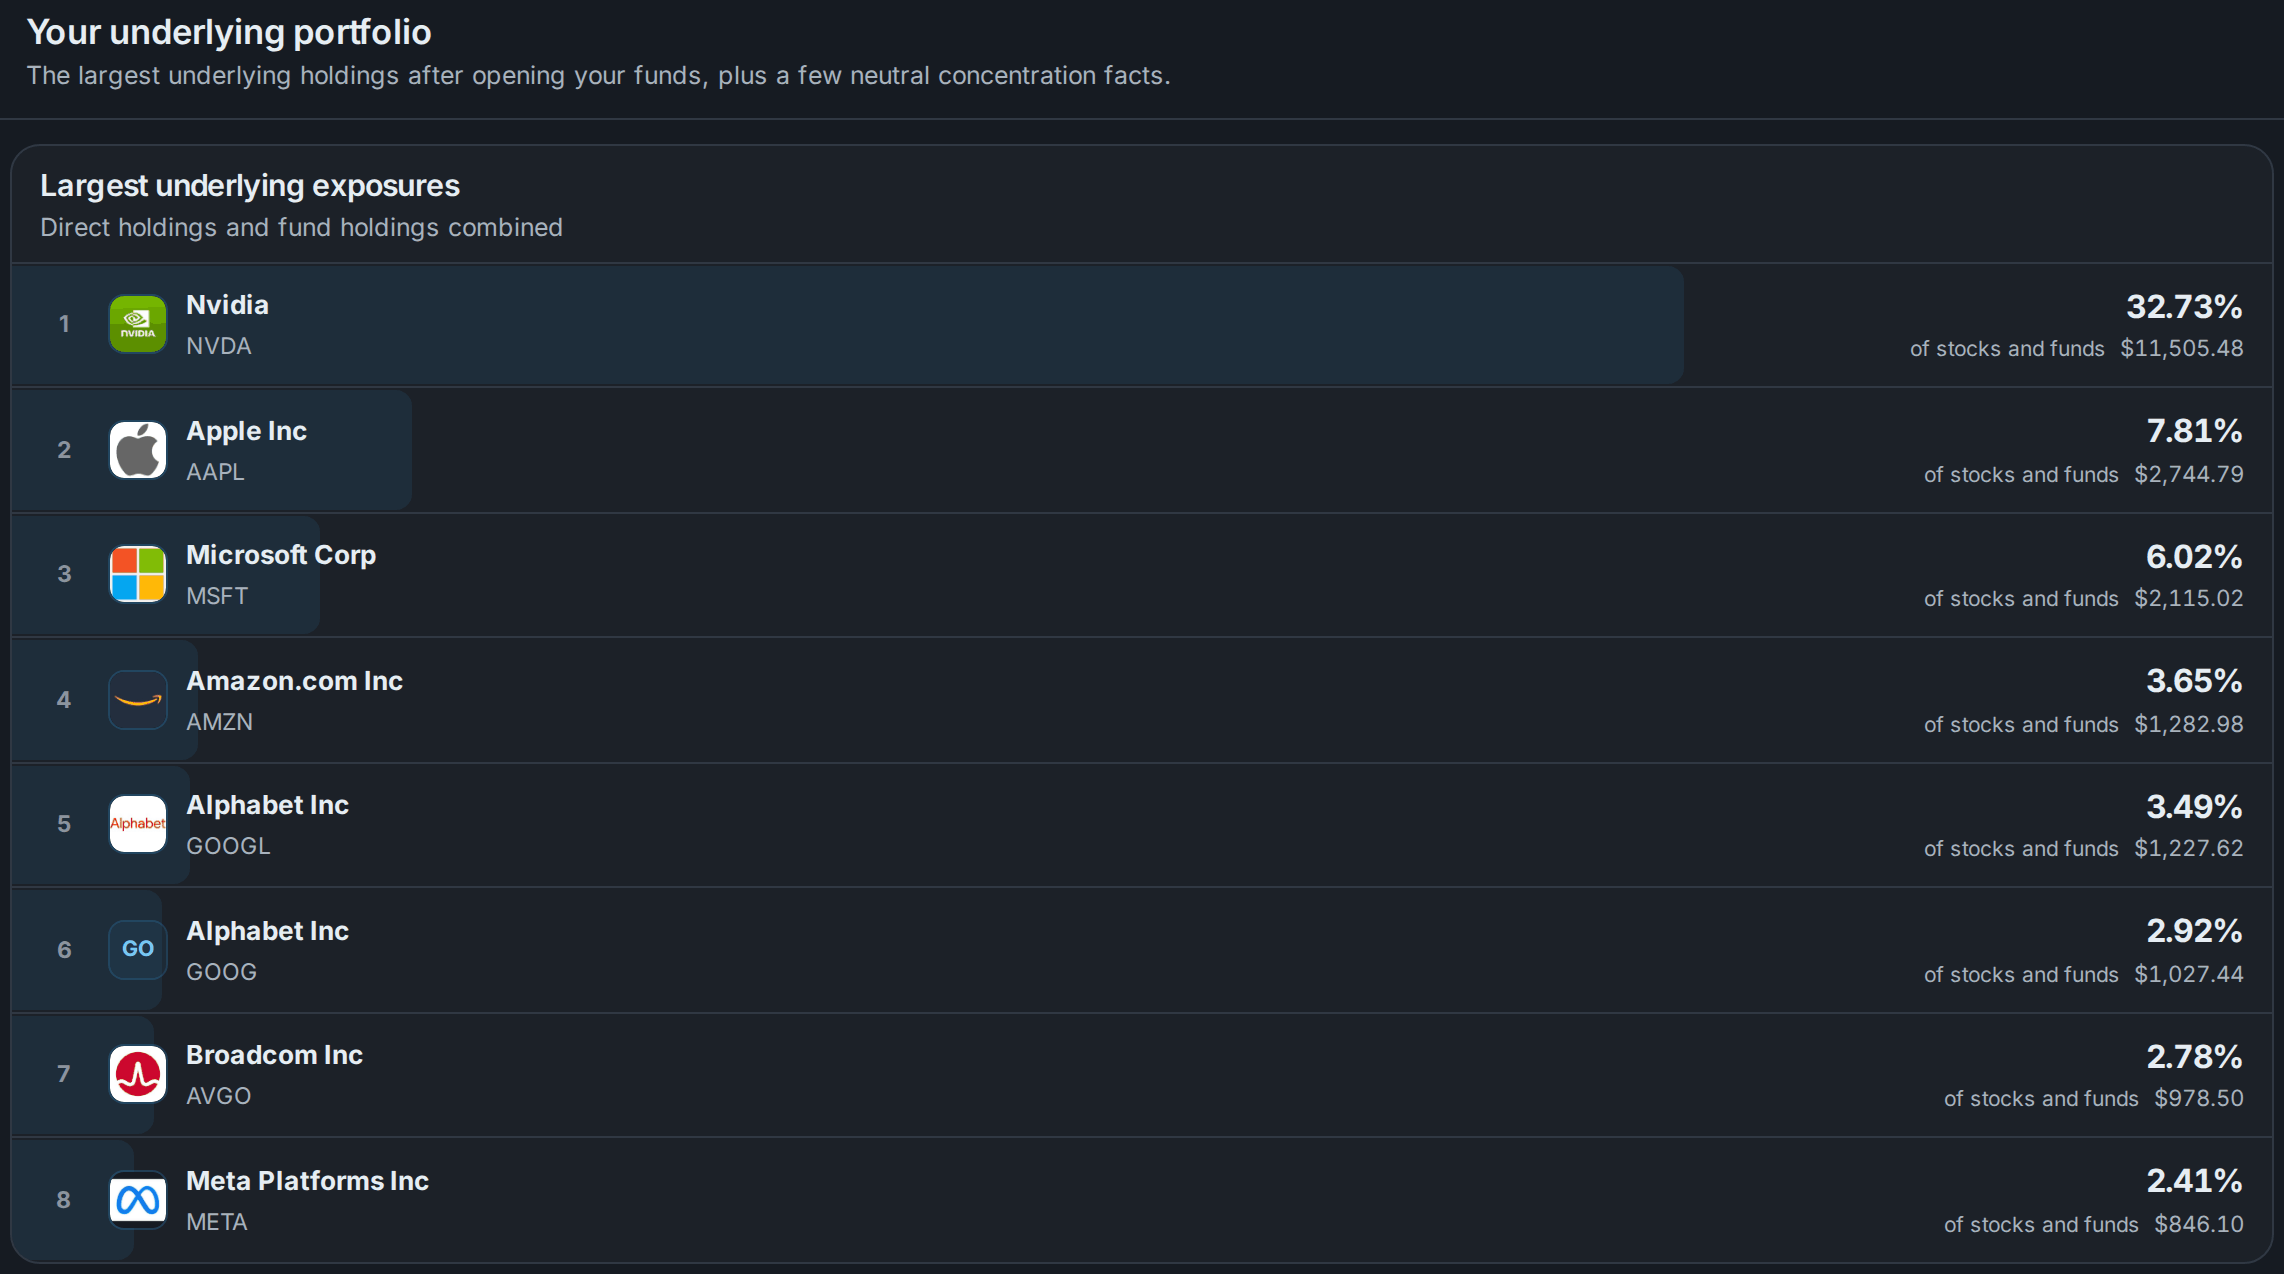
Add your ETFs and shares from every broker you use, and X-Ray opens each fund to show the companies underneath, with direct holdings and fund holdings added together. In this demo, 40 NVIDIA shares next to VUG and QQQM make NVIDIA 32.73% of the portfolio, ahead of Apple at 7.81%. X-Ray is on the Starter plan and up; the ETF overlap tool is free.
Compare two ETFs' holdings for free
AllInvestView
Track your ETFs from every broker in one place
Sync or import your accounts and AllInvestView shows each fund's return with dividends, its fee, and how your whole portfolio compares with the S&P 500.
Questions about growth ETFs
What is the best growth ETF?
For most people, a cheap and broad one: VUG (0.03%), SCHG (0.04%) or SPYG (0.04%). They hold 135 to 189 large US growth companies and returned about 18% a year over the 10 years to 30 September 2026. If you want the Nasdaq-100, QQQM holds it for 0.15%.
Is QQQ or VUG better?
They follow different indexes. QQQ holds the 100 largest non-financial companies on the Nasdaq and returned 20.91% a year over 10 years to 30 September 2026, against 17.94% for VUG, but it costs 0.18% against 0.03%. The two overlap by about 59%, so holding both mostly doubles up on the same companies.
What is the difference between QQQ and QQQM?
Same index, same holdings. QQQM costs 0.15% a year and QQQ 0.18%, so QQQM is the cheaper one to buy and hold. QQQ is far bigger and trades more, which matters mostly to traders and options users.
Are growth ETFs a good long-term investment?
Over the 10 years to 30 September 2026 every growth fund here beat the S&P 500: 17.9% to 20.9% a year against 15.29% for VOO. They also fall harder. In 2022 VUG lost 33.1% and VOO 18.2%, and over 5 years the two finished almost level: 13.87% against 13.75% a year.
Should I own more than one growth ETF?
Usually there is little point. VUG and SCHG share 82% of their money in the same companies, and each overlaps about 57% with an S&P 500 fund. A second growth fund mostly adds more NVIDIA, Apple and Microsoft.
Do growth ETFs pay dividends?
A little, usually four times a year. SCHG paid 0.39% over the 12 months to 30 September 2026 and SPYG 0.49% to 22 October, well under the S&P 500. Growth companies keep most of their profits to reinvest.
Which growth ETFs can I buy in the UK or Europe?
UCITS versions listed in London or on Xetra. Invesco EQQQ and iShares NASDAQ 100 (CNX1, CNDX) track the Nasdaq-100 for 0.30%, and Amundi Russell 1000 Growth (MWOT) tracks the same index as VONG and IWF for 0.19%.
Sources
Checked on 24 October 2026.
- Vanguard Morningstar Growth ETF (VUG) fact sheet, 30 September 2026, and prospectus 28 April 2026 with its supplement
- Schwab U.S. Large-Cap Growth ETF (SCHG), returns to 30 September 2026, holdings and assets 22 October 2026; 2022 return from the summary prospectus of 27 February 2026
- State Street SPDR Portfolio S&P 500 Growth ETF (SPYG), fact sheet 30 September 2026, assets 22 October 2026; 2022 return from the summary prospectus of 31 October 2025
- Invesco NASDAQ 100 ETF (QQQM) fact sheet, 30 September 2026
- Invesco QQQ ETF (QQQ), fee cut to 0.18% in December 2025; returns 30 September 2026, net assets from the 31 March 2026 semiannual report
- Vanguard: CRSP index names change to Morningstar, effective 29 July 2026
- Vanguard Russell 1000 Growth ETF (VONG) fact sheet, 30 September 2026
- Vanguard Morningstar Mega Cap Growth ETF (MGK) fact sheet, 30 September 2026
- iShares Russell 1000 Growth ETF (IWF), returns 30 September 2026, assets 23 October 2026
- Vanguard Information Technology ETF (VGT) fact sheet, 30 September 2026
- Vanguard S&P 500 ETF (VOO) fact sheet, 30 September 2026
- Invesco EQQQ NASDAQ-100 UCITS ETF fact sheet, 30 September 2026
- iShares NASDAQ 100 UCITS ETF, 22 October 2026
- Amundi Russell 1000 Growth UCITS ETF Acc fact sheet, 30 April 2026
Returns are each fund's published NAV total returns. Holdings, concentration and overlap come from the funds' holdings lists. Past returns don't tell you future ones, and none of this is personal investment advice.