- Home
- Portfolio analyzer
- ETF overlap tool
ETF Overlap Tool
Compare up to 5 ETFs, or an ETF and a stock, and see how much of them is the same holdings. Add your weights to see what your mix really owns, and how much of each.
Overlap by weight
53.9%
VOO and QQQ share 86 holdings. They make up 92.6% of QQQ and 54.1% of VOO.
Shared holdings
| Holding | VOO | QQQ | Overlap |
|---|---|---|---|
NV NVIDIA CorpNVDA | 8.09% | 8.43% | 8.09% |
AA Apple IncAAPL | 7.04% | 7.28% | 7.04% |
MS Microsoft CorpMSFT | 5.70% | 5.75% | 5.70% |
AM Amazon.com IncAMZN | 3.85% | 4.06% | 3.85% |
GO Alphabet IncGOOGL | 3.01% | 3.01% | 3.01% |
AV Broadcom IncAVGO | 2.65% | 2.53% | 2.53% |
GO Alphabet IncGOOG | 2.40% | 2.81% | 2.40% |
ME Meta Platforms IncMETA | 1.90% | 3.24% | 1.90% |
MU Micron Technology IncMU | 1.64% | 5.01% | 1.64% |
TS Tesla IncTSLA | 1.57% | 2.91% | 1.57% |
What your mix owns
- 1NV8.26%NVIDIA CorpNVDA
- 2AA7.16%Apple IncAAPL
- 3MS5.72%Microsoft CorpMSFT
- 4AM3.95%Amazon.com IncAMZN
- 5MU3.32%Micron Technology IncMU
VOO holdings as of 5 Oct 2026 (505 holdings); QQQ holdings as of 5 Oct 2026 (101 holdings).
Why overlap matters
Owning three funds feels like owning three different things. Often it is the same handful of companies bought three times. An S&P 500 fund, a Nasdaq-100 fund and a tech fund all put their biggest weights in NVIDIA, Apple and Microsoft, so a mix of them holds more of those names than the S&P 500 itself does.
Overlap is not a problem on its own. A broad index fund with a smaller tilt next to it is a perfectly good plan. What matters is knowing the real weights, so that a tenth of your money in one company is a choice you made and not something you found out later.
Worked example: VOO and QQQ
VOO tracks the S&P 500 with 505 holdings. QQQ tracks the Nasdaq-100 with 101. They have 86 holdings in common. For each one, the overlap counts the smaller of its two weights:
So 53.9% of the money in each fund is in the same holdings at the same weights. Hold them 50/50 and NVIDIA Corp alone is 8.3% of your portfolio, and your ten largest holdings add up to 41.9%.
Questions about ETF overlap
How is ETF overlap calculated?
For every holding two funds share, we take the smaller of its two weights and add them up. If NVIDIA is 7.6% of one fund and 8.8% of the other, it adds 7.6%. The total is the part of the two funds that is the same money in the same companies.
Why are the two shared percentages so different?
Overlap runs one way more than the other when one fund is much broader. Most of the companies in QQQ are also in VOO, and they are its biggest ones, so nearly all of QQQ is shared. Those same companies are only part of VOO, which holds around 500 stocks, so a smaller share of VOO is shared.
What counts as a high overlap?
Above 50%, two funds mostly hold the same companies at similar weights, and the second one adds little diversification. Under 20%, they are doing different jobs. In between, look at what is shared: overlap in the five largest names moves your returns far more than overlap in a long tail of small ones.
Can I compare a stock with an ETF?
Yes. Enter a ticker such as NVDA next to VOO and the overlap is the stock's weight inside the fund. Add weights and the look-through puts the shares you hold directly together with what you hold through the fund.
Does it work for bond ETFs and European ETFs?
Yes, when we have the fund's holdings list. Bond funds are compared bond by bond, by ISIN or CUSIP, so BND and AGG show up as two broad funds that share a large part of the same Treasury bonds. UCITS ETFs work with their listed ticker, such as IWDA.AS or VWCE.DE.
Why are GOOGL and GOOG listed separately?
They are two share classes of Alphabet with different ISINs, and funds hold them as separate lines. We keep them apart the same way, so your Alphabet total is the two rows added together.
How current are the holdings?
Each fund's holdings list carries its own date, shown under the results. Between updates the weights drift with prices, so treat a difference of a few tenths of a percent as noise.
See your true exposure across every account
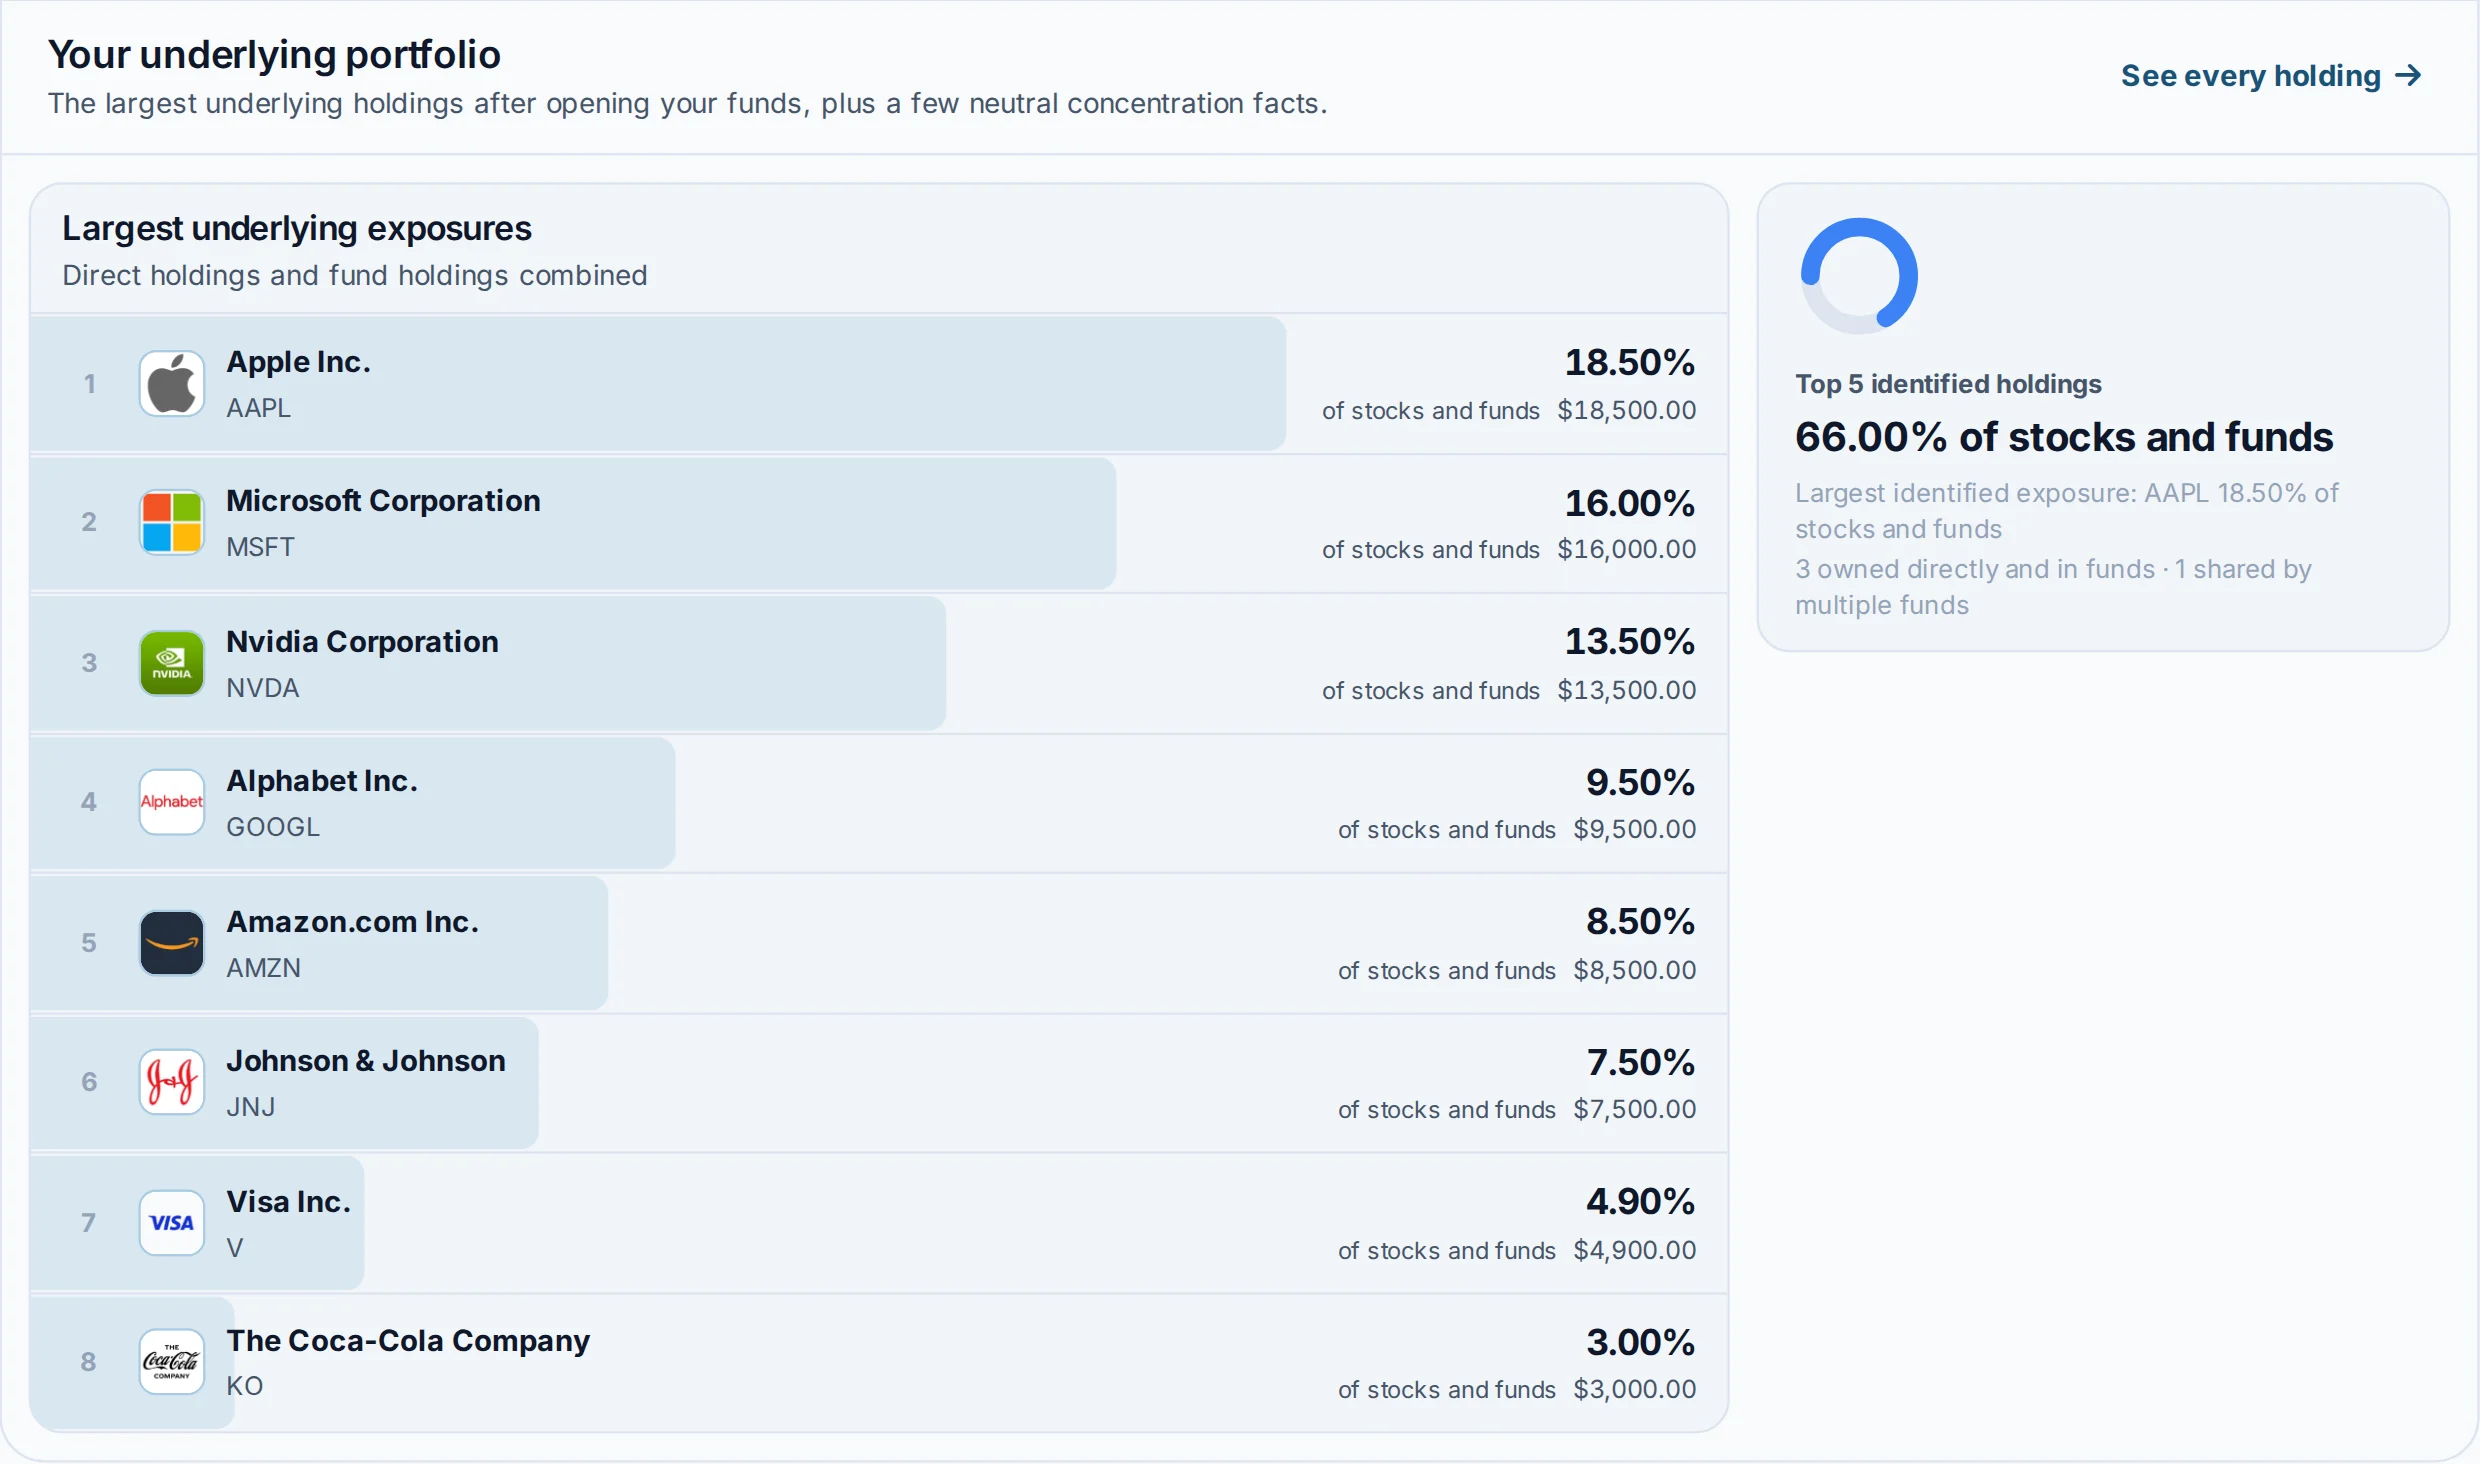
Portfolio X-Ray in AllInvestView does this with the funds and shares you actually hold, at their real values, across every broker you sync or import. A stock you own directly and through three ETFs shows up once, at its full weight.
- Direct shares and fund holdings ranked together, one row per holding
- Where your funds overlap, pair by pair
- One portfolio, a combined group, or all of them at once, with a CSV export
14-day Advanced trial. No card required.
 AllInvestViewPortfolio X-Ray
Keep going
Holdings come from each fund's most recent list we have stored, with its date shown under the results. Overlap describes what the funds hold, not how they will perform, and it is not investment advice.