100 companies picked for high yield, strong balance sheets and a 10-year record of paying. Its payout per share grew the fastest here, 10.7% a year from 2016 to 2025.
SCHD vs VYM, side by sideBest Dividend ETFs for 2026
For income today, SCHD is the best fit for most people: a 3.12% yield for 0.06% a year, from 100 companies with strong finances and a long record of paying. VYM spreads the same idea over about 590 companies for 0.04%. If you want a payout that keeps rising, VIG and DGRO yield less but grew theirs 7.7% and 9.2% a year since 2016.
The highest yield isn't the best result. JEPI yields 7.45%, paid monthly and mostly from selling options, and returned 7.78% a year over 5 years. Over 10 years no dividend ETF here beat the S&P 500: DGRO came closest at 13.16% a year, against 15.29%.
Six dividend ETFs, by what you want
Yields are each fund's 30-day SEC yield. Returns are yearly averages with dividends reinvested, to 30 September 2026.
About 590 US companies with high expected dividend yields, REITs left out, weighted by size. Broadcom is the biggest holding at about 7%.
VYM vs HDV, side by sideCompanies that raised their dividend for at least 10 years in a row, minus the highest yielders. Low income today, more of it later: the payout per share nearly doubled from 2016 to 2025.
VIG vs DGRO, side by sideCompanies with at least five years of dividend growth and a payout ratio under a cap. The best 10-year return of the dividend ETFs here, and a payout up 9.2% a year.
DGRO vs SCHD, side by sideAbout 75 high payers screened for financial health. Exxon, Chevron and AbbVie are almost a quarter of it, and energy and consumer staples half.
HDV vs SCHD, side by sideThe high payout comes mostly from selling call options on the S&P 500, not from dividends. You give up part of the upside in a rising market in exchange.
JEPI vs SCHD, side by sideDividend ETFs compared
Tap a column to sort. Green returns beat the S&P 500 (VOO) over that period.
| Index | Pays | Fund assets | ||||||||
|---|---|---|---|---|---|---|---|---|---|---|
SCHDSchwab U.S. Dividend Equity ETF |
Dow Jones U.S. Dividend 100 | 3.12% | 0.06% | Quarterly | 102 | $119bn | 23.36% | 15.44% | 9.48% | 12.44% |
VYMVanguard High Dividend Yield ETF |
FTSE High Dividend Yield | 2.35% | 0.04% | Quarterly | 593 | $96bn | 12.72% | 17.67% | 11.63% | 11.28% |
VIGVanguard Dividend Appreciation ETF |
S&P U.S. Dividend Growers | 1.51% | 0.04% | Quarterly | 333 | $128bn | 9.77% | 16.51% | 10.72% | 12.86% |
DGROiShares Core Dividend Growth ETF |
Morningstar US Dividend Growth | 2.07% | 0.08% | Quarterly | 389 | $42bn | 12.95% | 17.57% | 10.96% | 13.16% |
HDViShares Core High Dividend ETF |
Morningstar Dividend Yield Focus | 3.51% | 0.08% | Monthly | 74 | $15bn | 17.86% | 16.06% | 12.10% | 9.43% |
JEPIJPMorgan Equity Premium Income ETF |
Actively managed | 7.45% | 0.35% | Monthly | 140 | $45bn | 6.62% | 10.05% | 7.78% | n/a |
SPYDState Street SPDR Portfolio S&P 500 High Dividend ETF |
S&P 500 High Dividend | 4.71% | 0.07% | Quarterly | 78 | $7.6bn | 7.83% | 13.99% | 7.70% | 7.79% |
DVYiShares Select Dividend ETF |
Dow Jones U.S. Select Dividend | 3.66% | 0.38% | Quarterly | 98 | $22bn | 10.80% | 16.35% | 9.68% | 9.76% |
SDYState Street SPDR S&P Dividend ETF |
S&P High Yield Dividend Aristocrats | 2.60% | 0.35% | Quarterly | 155 | $22bn | 7.23% | 11.26% | 7.28% | 8.89% |
NOBLProShares S&P 500 Dividend Aristocrats ETF |
S&P 500 Dividend Aristocrats | 2.28% | 0.35% | Quarterly | 71 | $11.7bn | 7.27% | 9.22% | 6.30% | 9.45% |
VYMIOutside USVanguard International High Dividend Yield ETF |
FTSE All-World ex US High Dividend Yield | n/a | 0.07% | Quarterly | 1502 | $22bn | 23.99% | 22.99% | 13.92% | 10.57% |
VOOBenchmarkVanguard S&P 500 ETF |
S&P 500 | 1.00% | 0.03% | Quarterly | 505 | $1.73tn | 15.70% | 22.85% | 13.75% | 15.29% |
Yield is the 30-day SEC yield: the last month's income after the fee, as a yearly rate. Returns are average yearly NAV total returns to 30 September 2026. Fund assets cover every share class. JEPI launched in May 2020, so it has no 10-year figure. Vanguard doesn't publish an SEC yield for VYMI.
How much income each dividend ETF pays
Type an amount to see what each fund would pay you in a year at today's yield.
Income at each fund's 30-day SEC yield, before tax. The fee line is what the expense ratio costs you a year on the same amount; the yield is already net of it. Payouts move with the companies' dividends, and JEPI's with option prices.
Payout growth and total return
A high yield today and a payout that grows are different things, and neither guarantees the best return.
$100 of yearly income in 2016 became
Distributions per share in 2025 against 2016, by ex-dividend date. SCHD is adjusted for its 3-for-1 split in October 2024.
Yield against 10-year return
Each fund's SEC yield and its average yearly return over 10 years (5 for JEPI). The highest yields sit at the bottom.
Returns year by year, 2016 to 2025
| Fund | 2016 | 2017 | 2018 | 2019 | 2020 | 2021 | 2022 | 2023 | 2024 | 2025 |
|---|---|---|---|---|---|---|---|---|---|---|
| VYM | 16.9% | 16.4% | -5.9% | 24.2% | 1.1% | 26.1% | -0.4% | 6.5% | 17.6% | 15.4% |
| VIG | 11.8% | 22.2% | -2.0% | 29.7% | 15.5% | 23.6% | -9.8% | 14.5% | 17.0% | 14.2% |
| DGRO | 15.3% | 22.8% | -2.2% | 30.0% | 9.5% | 26.6% | -7.9% | 10.4% | 16.6% | 15.7% |
| HDV | 15.8% | 13.4% | -2.9% | 20.4% | -6.5% | 19.4% | 7.1% | 1.8% | 14.2% | 11.9% |
| DVY | 21.5% | 15.0% | -6.3% | 22.7% | -4.9% | 31.6% | 1.9% | 1.1% | 16.2% | 11.6% |
| NOBL | 11.4% | 21.2% | -3.2% | 27.5% | 8.3% | 25.5% | -6.5% | 8.1% | 6.7% | 6.9% |
| VOO | 11.9% | 21.8% | -4.4% | 31.5% | 18.4% | 28.7% | -18.2% | 26.3% | 25.0% | 17.8% |
Calendar-year NAV total returns from each fund's prospectus, for the funds whose issuers publish every year as figures. VOO is the S&P 500. In 2022 the dividend funds lost far less, or gained; in 2023 and 2024 they lagged well behind.
What each dividend ETF holds
The five largest holdings of each fund, from its holdings list in early October 2026.
SCHD41.6% in the top 10
Texas Instruments4.92%
Qualcomm4.52%
Procter & Gamble4.20%
Coca-Cola4.16%
Chevron4.14%
VYM25.8% in the top 10
Broadcom6.94%
JPMorgan Chase3.83%
Exxon Mobil2.70%
Johnson & Johnson2.58%
AbbVie1.83%
VIG33.7% in the top 10
Microsoft4.69%
Apple4.52%
Broadcom4.36%
JPMorgan Chase4.08%
Eli Lilly3.92%
DGRO27.2% in the top 10
Microsoft3.26%
Apple3.13%
Exxon Mobil3.10%
AbbVie2.93%
Broadcom2.84%
HDV55.5% in the top 10
Exxon Mobil9.25%
Chevron7.01%
AbbVie6.73%
Verizon5.71%
Procter & Gamble5.44%
JEPI18.6% in the top 10
Microsoft2.05%
NVIDIA1.98%
Apple1.93%
Meta1.89%
Amazon1.87%
| Fund | SCHD | VYM | VIG | DGRO | HDV | JEPI | VOO |
|---|---|---|---|---|---|---|---|
| SCHD | 22% | 15% | 20% | 42% | 8% | 8% | |
| VYM | 22% | 61% | 63% | 25% | 25% | 35% | |
| VIG | 15% | 61% | 70% | 18% | 30% | 41% | |
| DGRO | 20% | 63% | 70% | 29% | 33% | 43% | |
| HDV | 42% | 25% | 18% | 29% | 13% | 9% | |
| JEPI | 8% | 25% | 30% | 33% | 13% | 39% | |
| VOO | 8% | 35% | 41% | 43% | 9% | 39% |
22% SCHD and VYM
99% of SCHD's money is in companies VYM also owns. But VYM holds about 590 and spreads its money thinly, so only 22% of the two funds' money sits in the same places.
70% VIG and DGRO
The two dividend growth funds are close to the same fund. Pick one. Either also shares more than 40% with an S&P 500 fund, because both hold Microsoft, Apple and Broadcom near the top.
8% SCHD with the S&P 500
SCHD leaves out the biggest tech names, so it adds a lot that an S&P 500 fund doesn't. HDV, at 9%, is just as different. Check any two funds in the free ETF overlap tool.
Overlap: for every company two funds share, we take the smaller of its two weights and add them up. Holdings lists dated 5 to 10 October 2026.
How to choose a dividend ETF
Income now or income later
SCHD and HDV pay over 3% today. VIG pays 1.51%, but its payout per share nearly doubled from 2016 to 2025. If you won't spend the income for years, the growing payout usually ends up larger.
Look past the yield
The highest yields come with a catch. SPYD's 4.71% came with 7.79% a year over 10 years, and its payout barely grew. JEPI's 7.45% comes from options that give up gains in strong markets.
Then the fee
On $100,000, VYM and VIG cost $40 a year, SCHD $60, DGRO and HDV $80, and JEPI, SDY and NOBL $350. Vanguard cut VYM's and VIG's fees in February 2026.
Check what you already own
VIG and DGRO share 70% of their money, and both overlap heavily with an S&P 500 fund. SCHD and HDV are the most different from what most portfolios already hold.
Dividend ETFs in the UK and Europe
Many UK and EU brokers don't sell US-listed ETFs to private investors. These UCITS funds pay out their dividends four times a year.
Vanguard FTSE All-World High Dividend Yield UCITS ETF
- Index
- FTSE All-World High Dividend Yield
- Fee
- 0.29% a year
- Tickers
- VHYL (London, GBP; Amsterdam and Milan, EUR), VGWD (Xetra, EUR)
- Income
- Distributing, quarterly
- Fund size
- $14.6bn
- ISIN
- IE00B8GKDB10
State Street SPDR S&P Global Dividend Aristocrats UCITS ETF
- Index
- S&P Global Dividend Aristocrats Quality Income
- Fee
- 0.45% a year
- Tickers
- GLDV (London, USD), GBDV (London, GBP), ZPRG (Xetra, EUR)
- Income
- Distributing, quarterly
- Fund size
- $1.7bn
- ISIN
- IE00B9CQXS71
iShares UK Dividend UCITS ETF
- Index
- FTSE UK Dividend+
- Fee
- 0.40% a year
- Tickers
- IUKD (London, GBP), IQQD (Xetra, EUR)
- Income
- Distributing, quarterly
- Fund size
- £1.2bn
- ISIN
- IE00B0M63060
See every dividend you're paid, from every broker
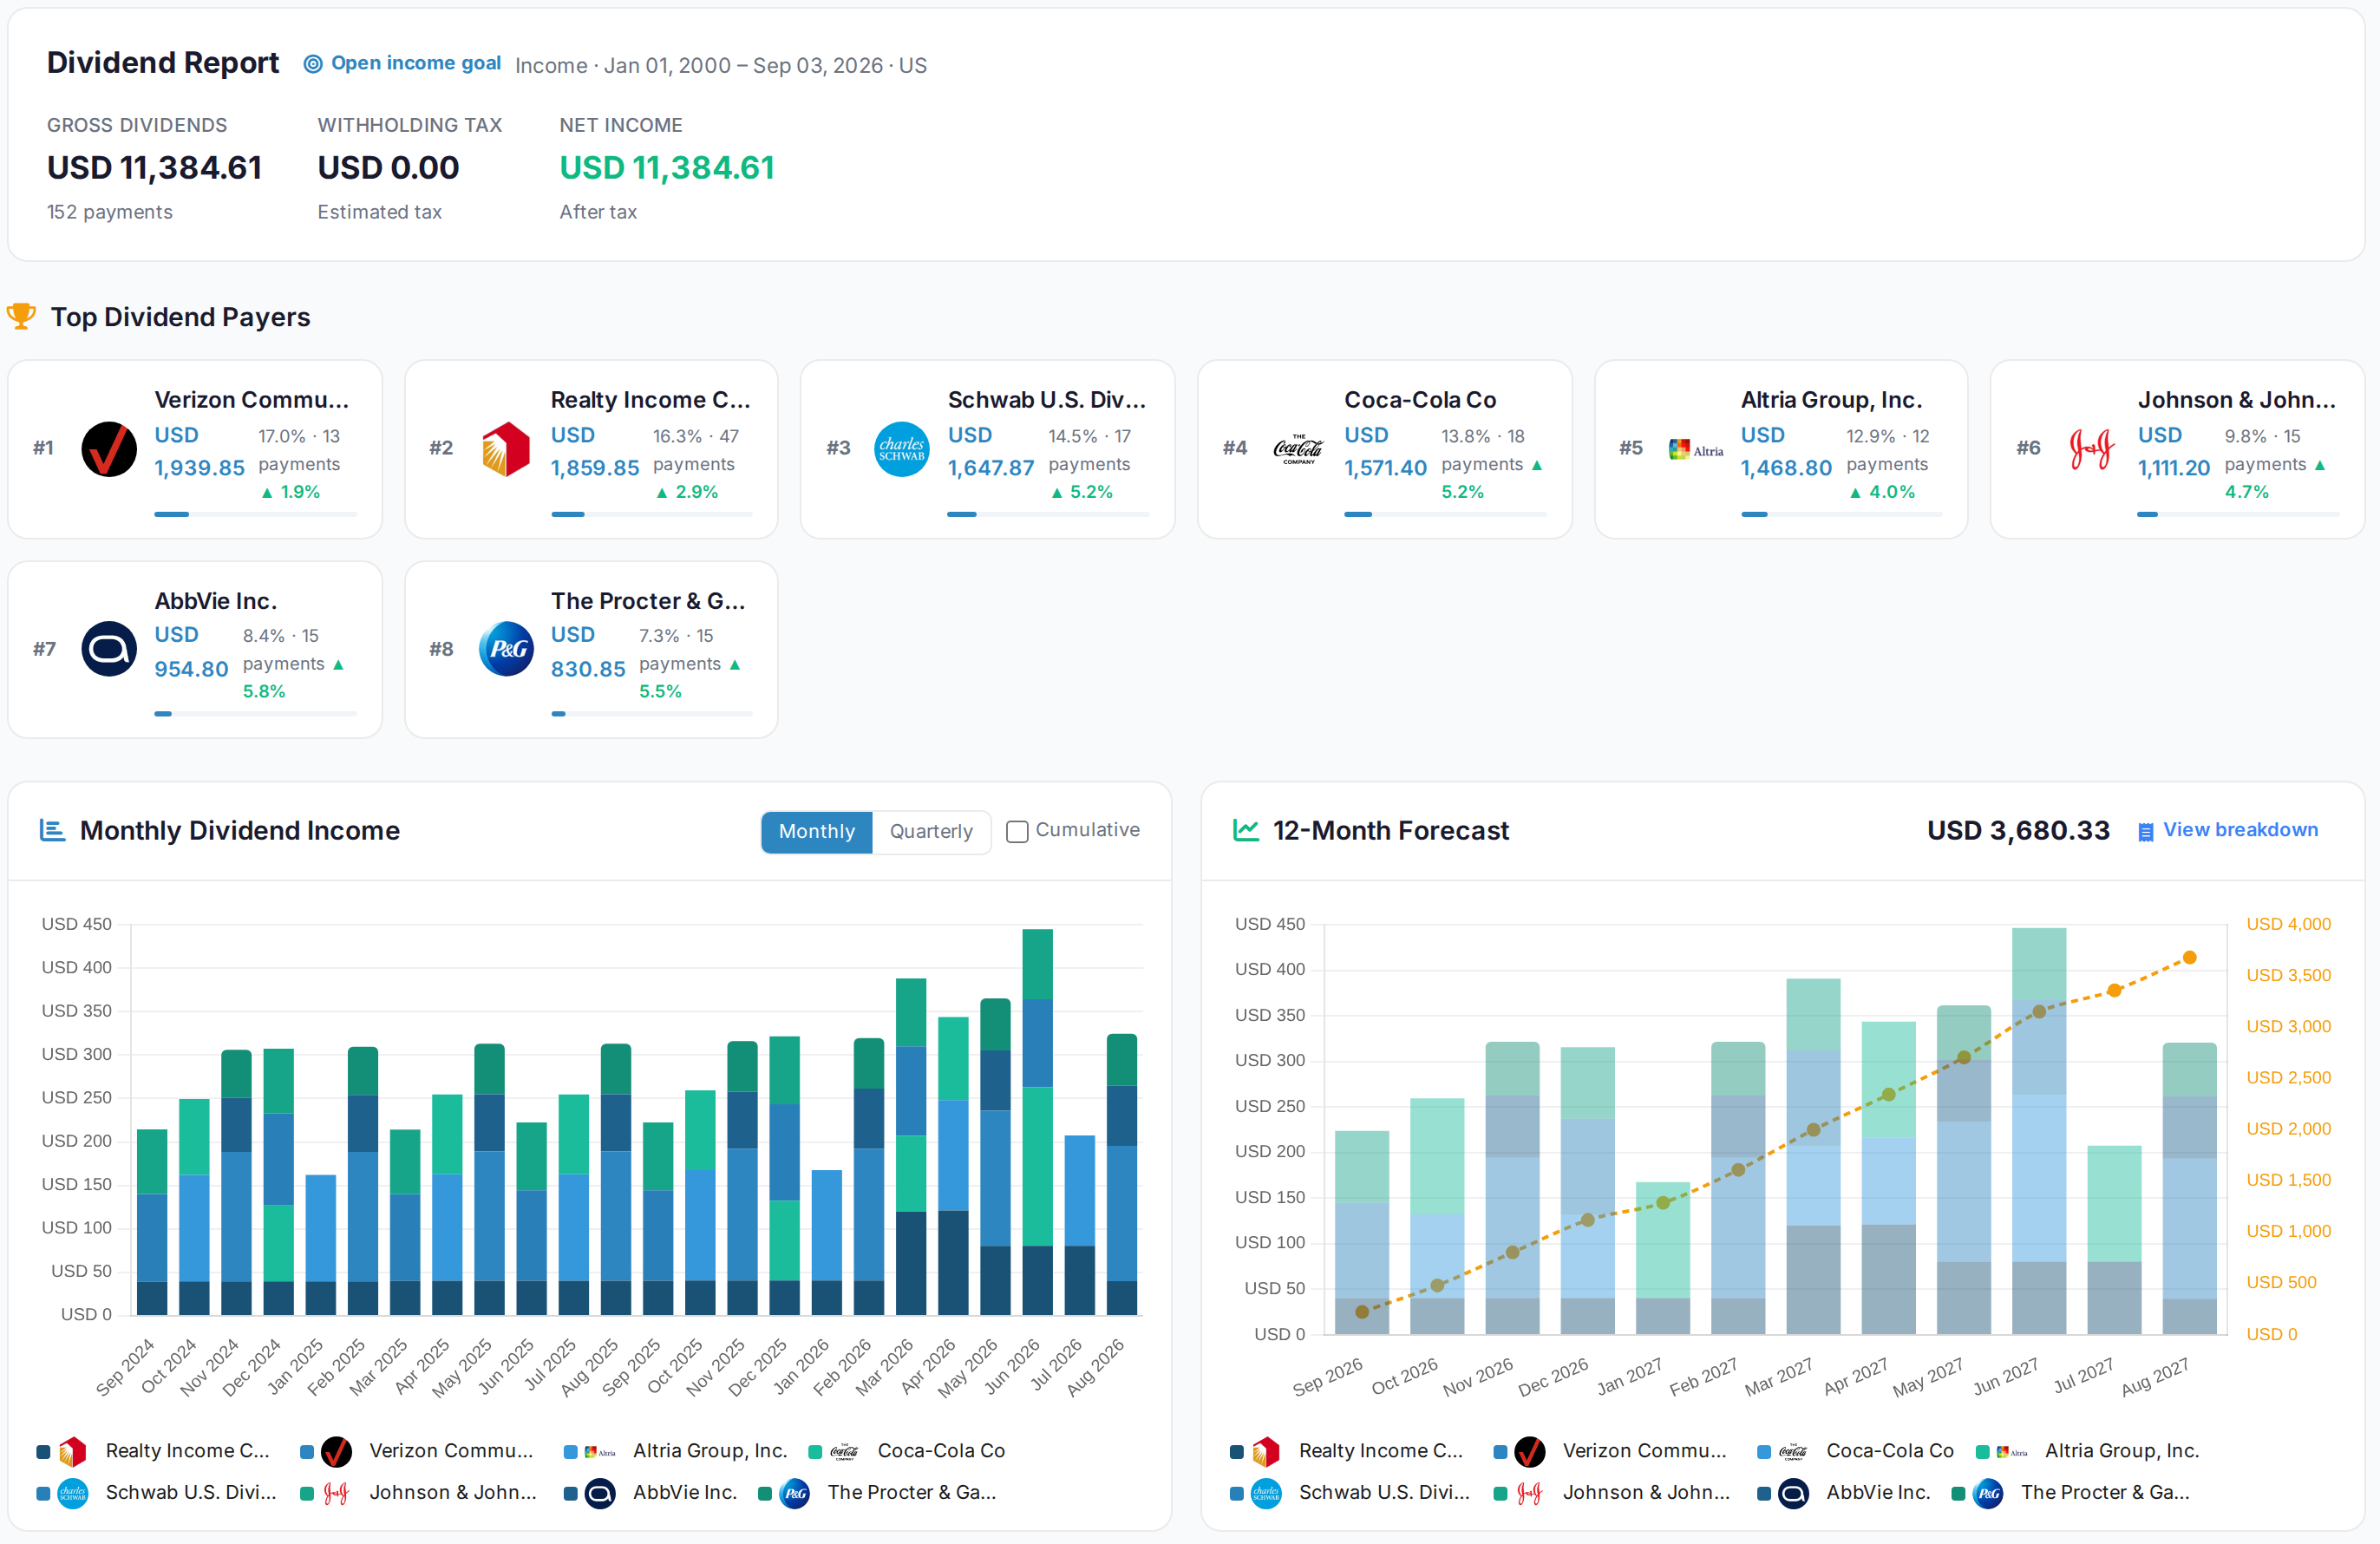
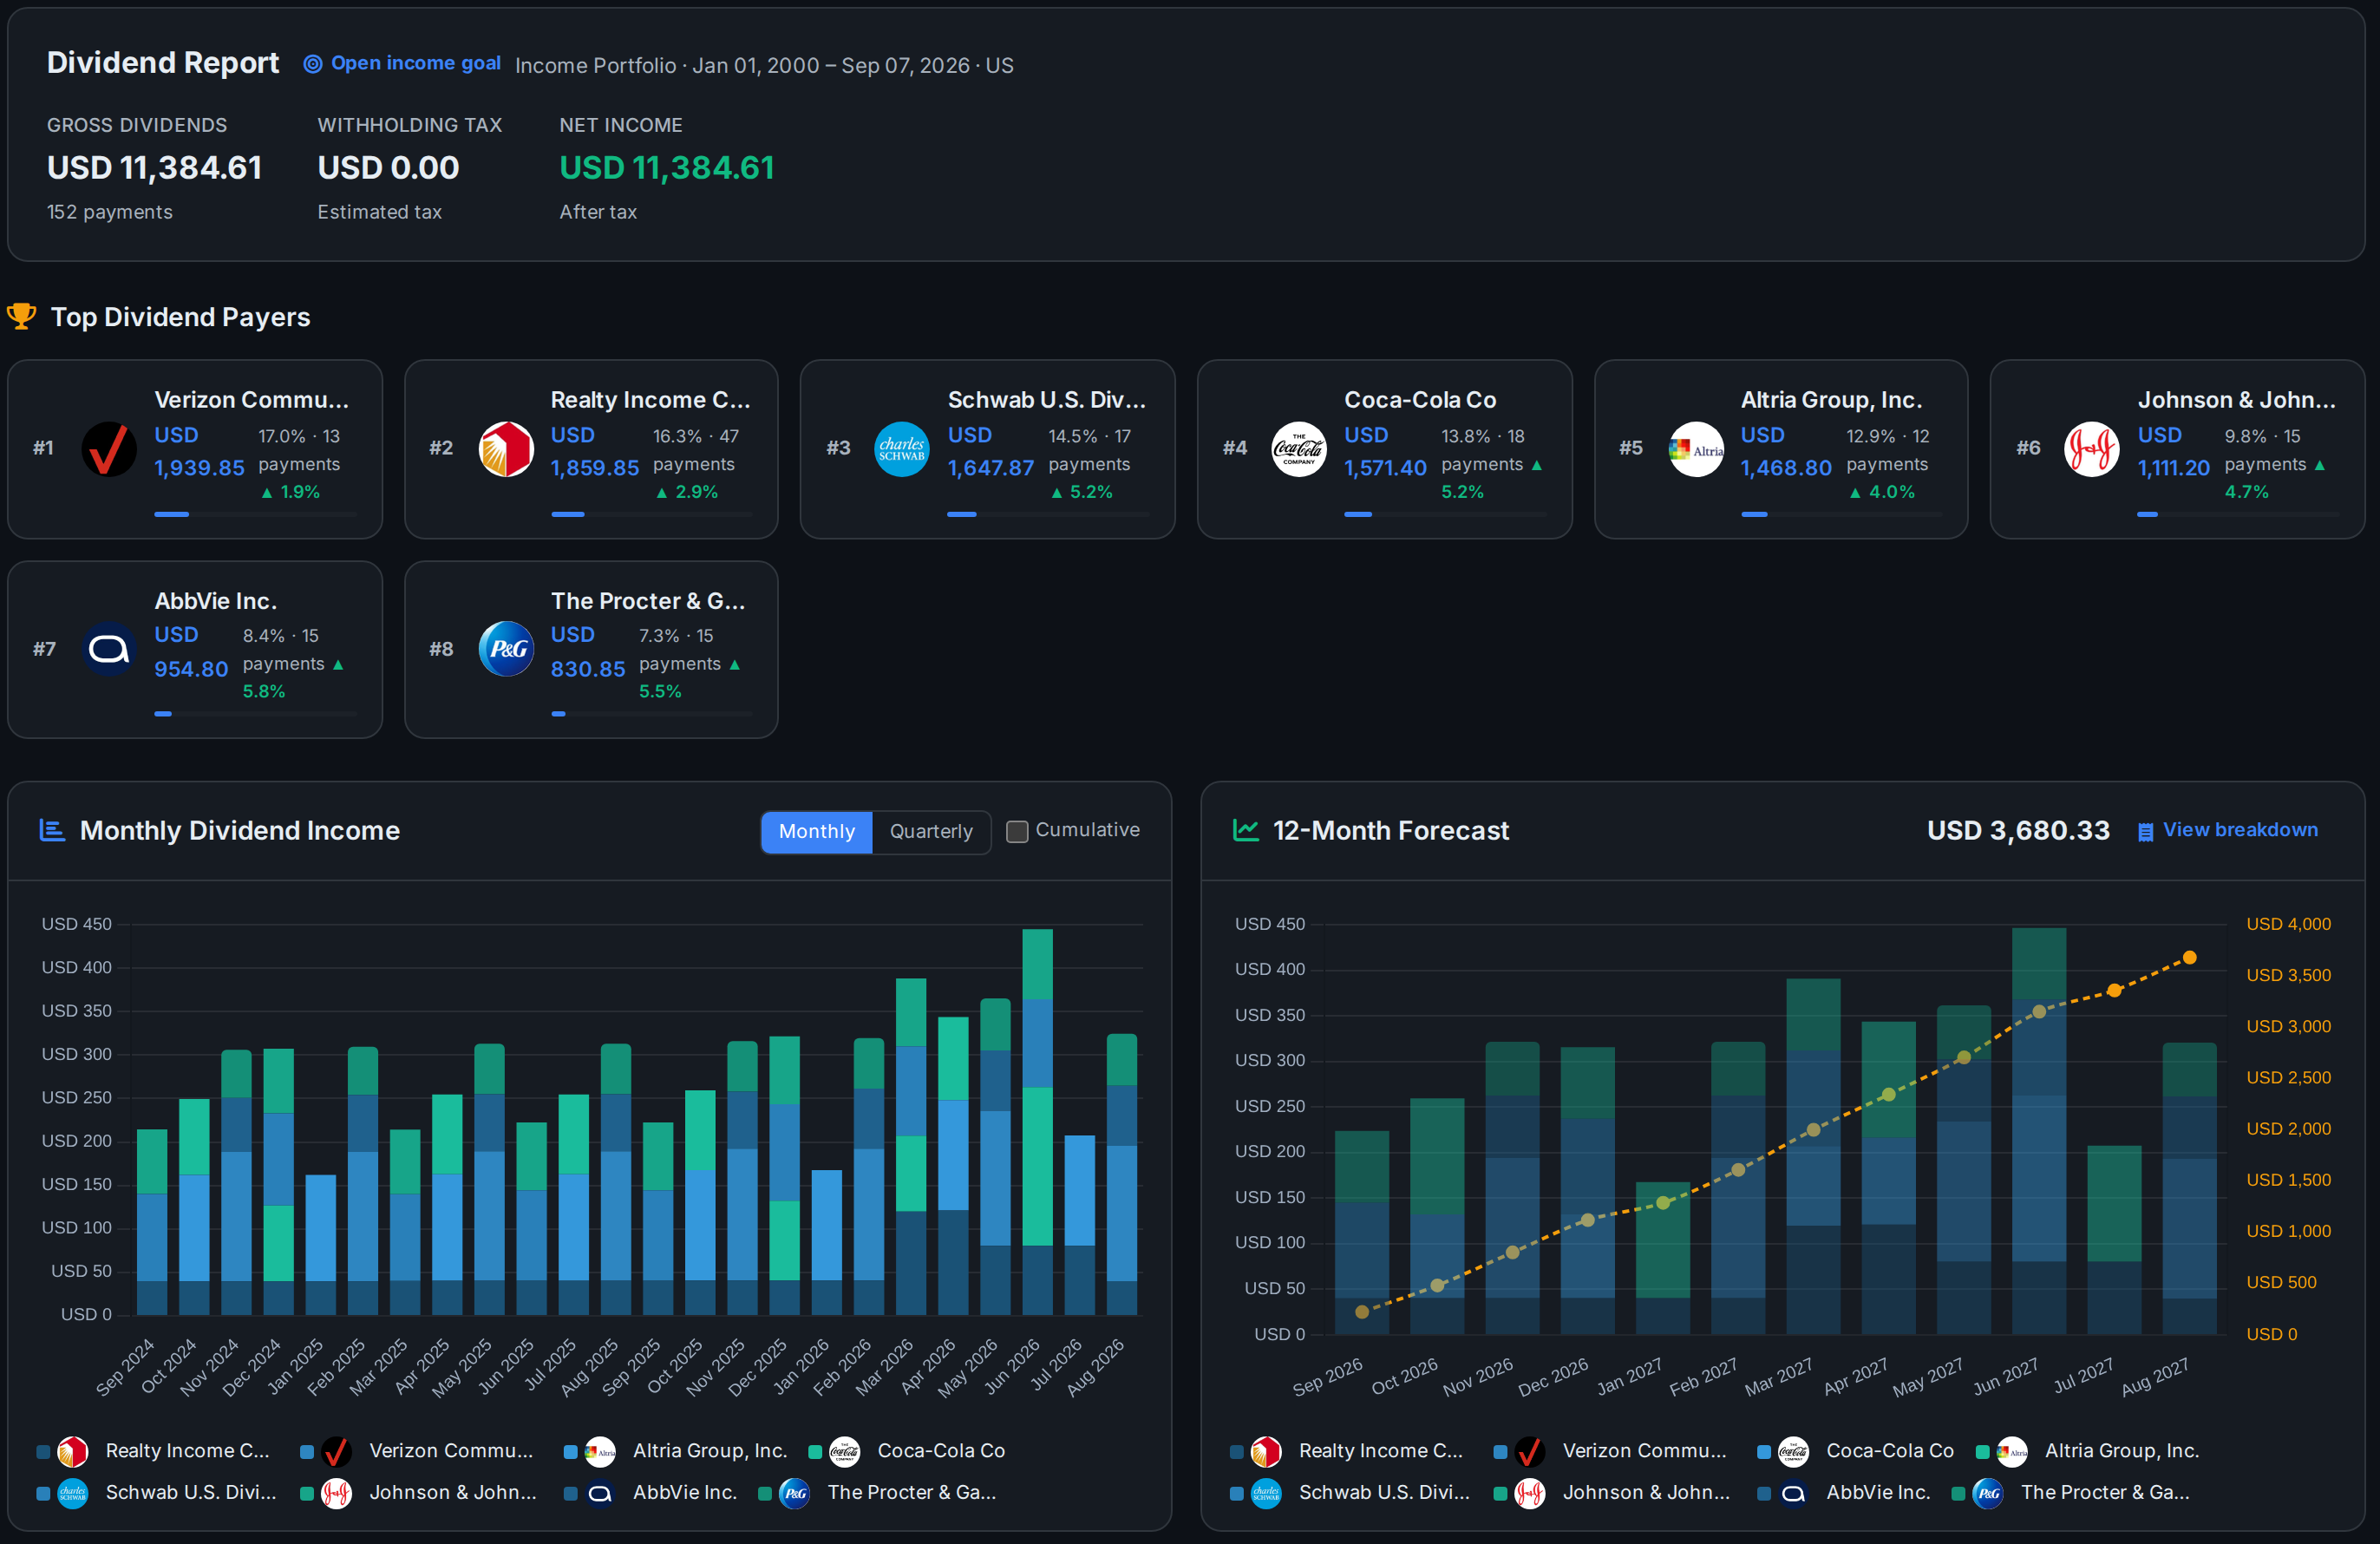
Your dividend income in one place, with the next 12 months forecast
Sync or import your accounts and AllInvestView collects every dividend and fund distribution: gross, withholding tax and net, for each holding and in total. Each payer shows how fast its dividend grew, and the forecast adds up what your holdings should pay over the next 12 months.
See the dividend tracker
AllInvestView
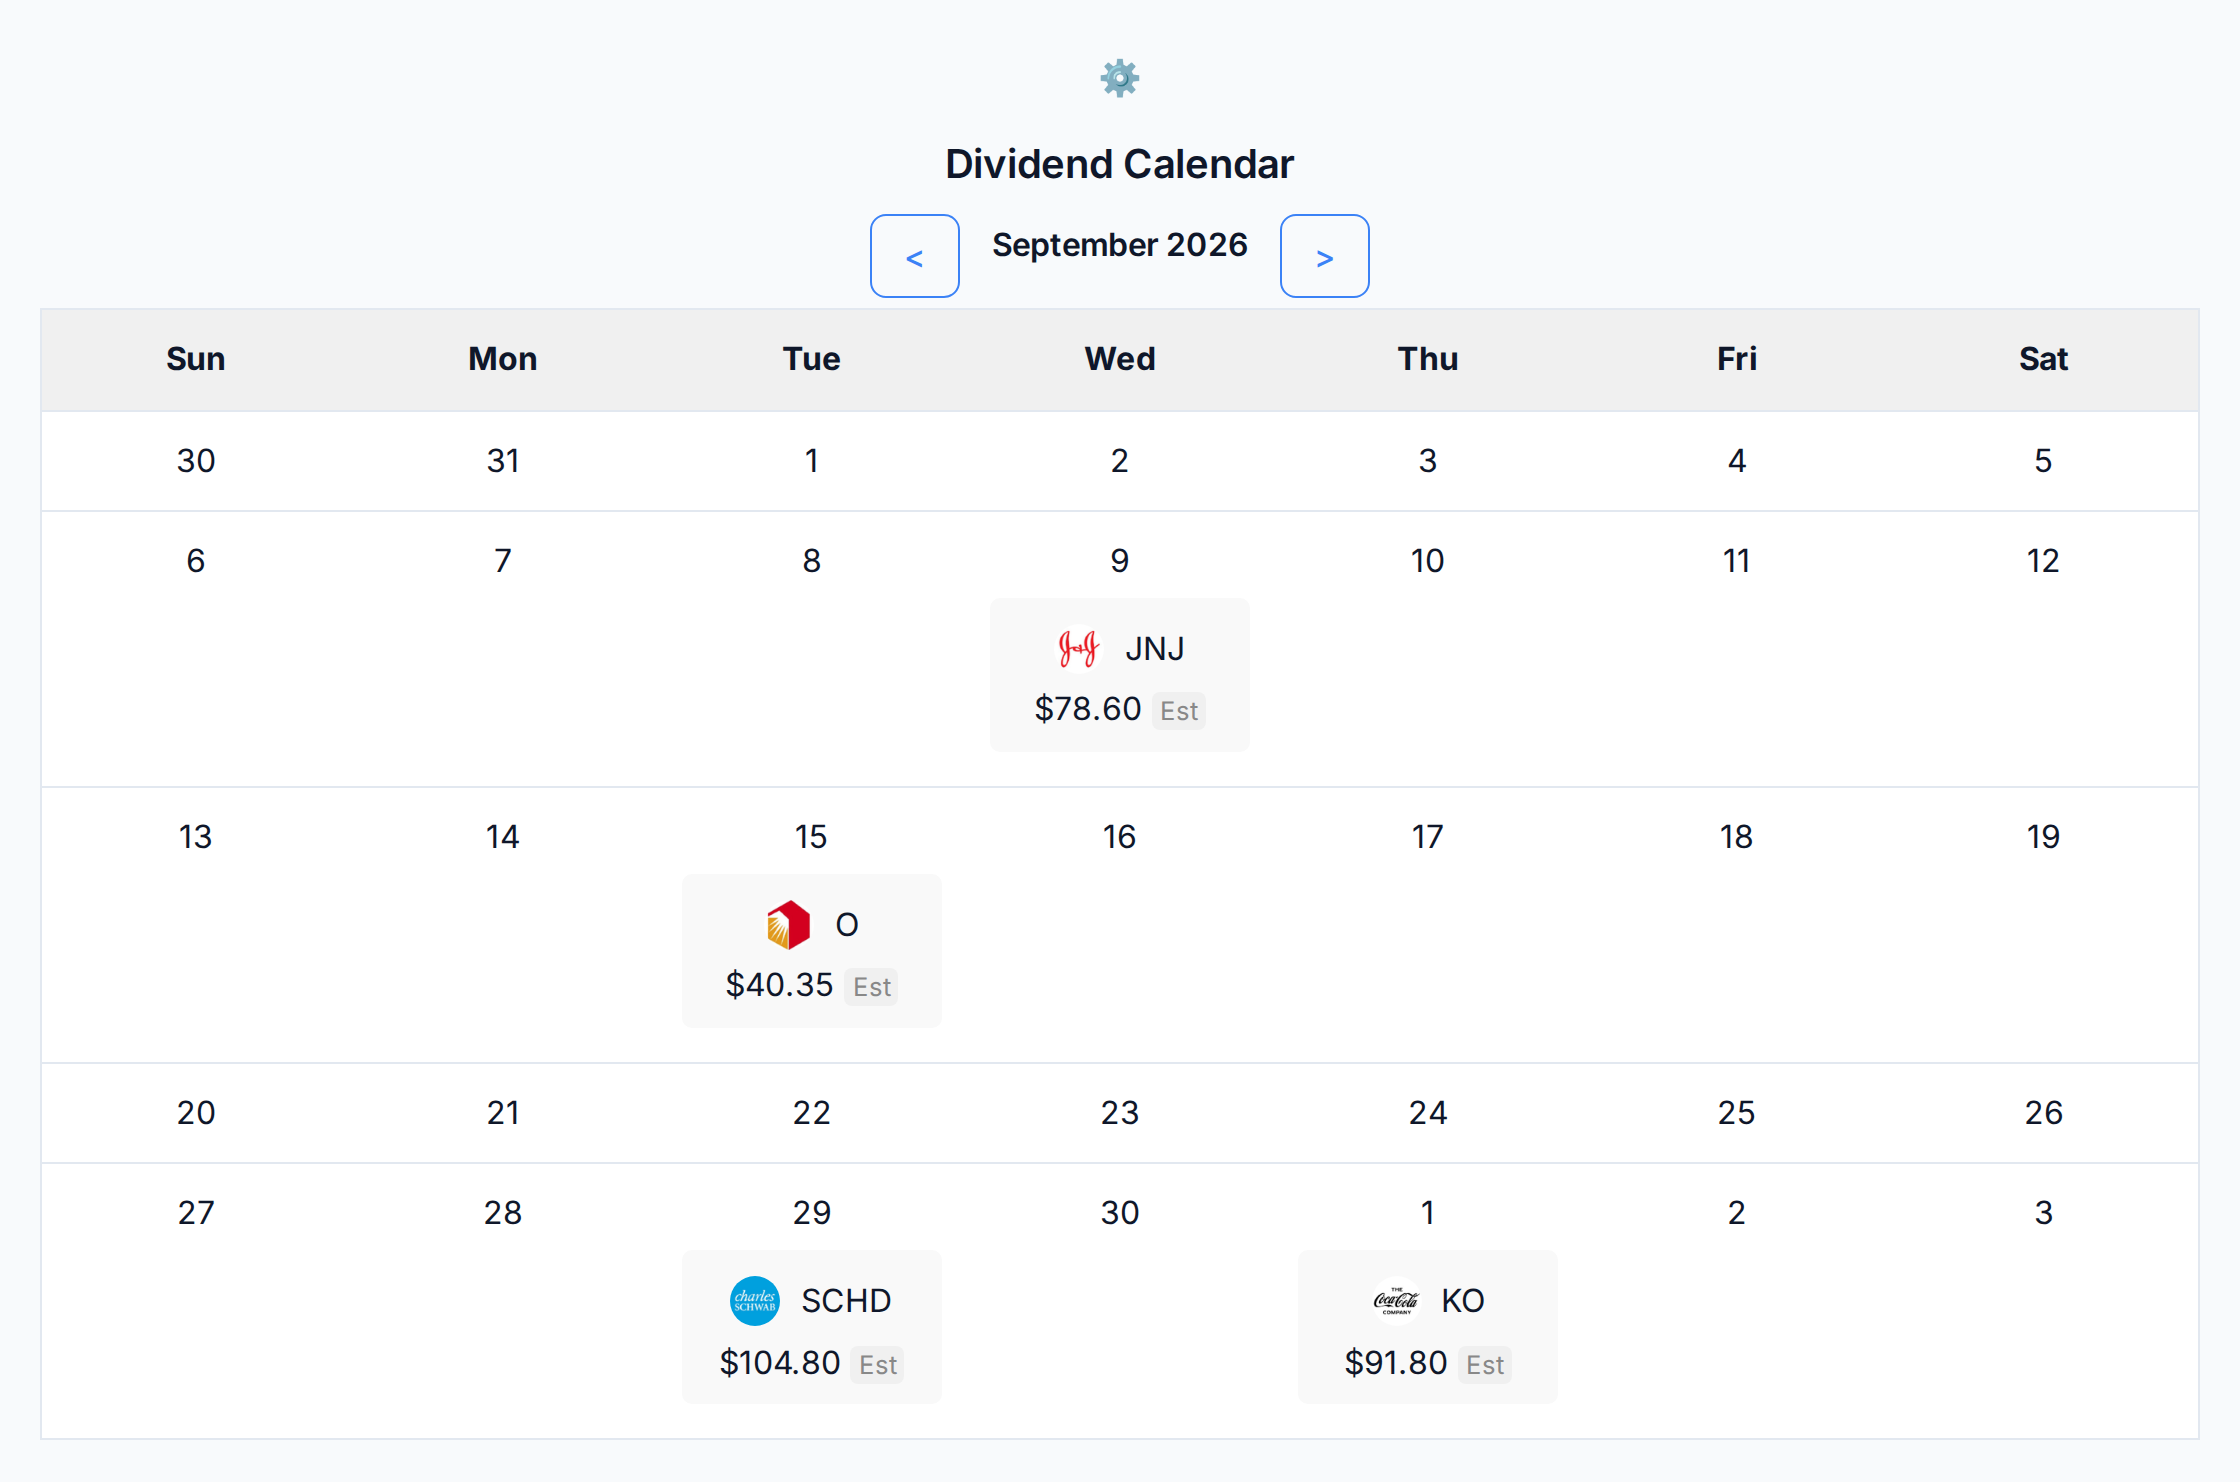
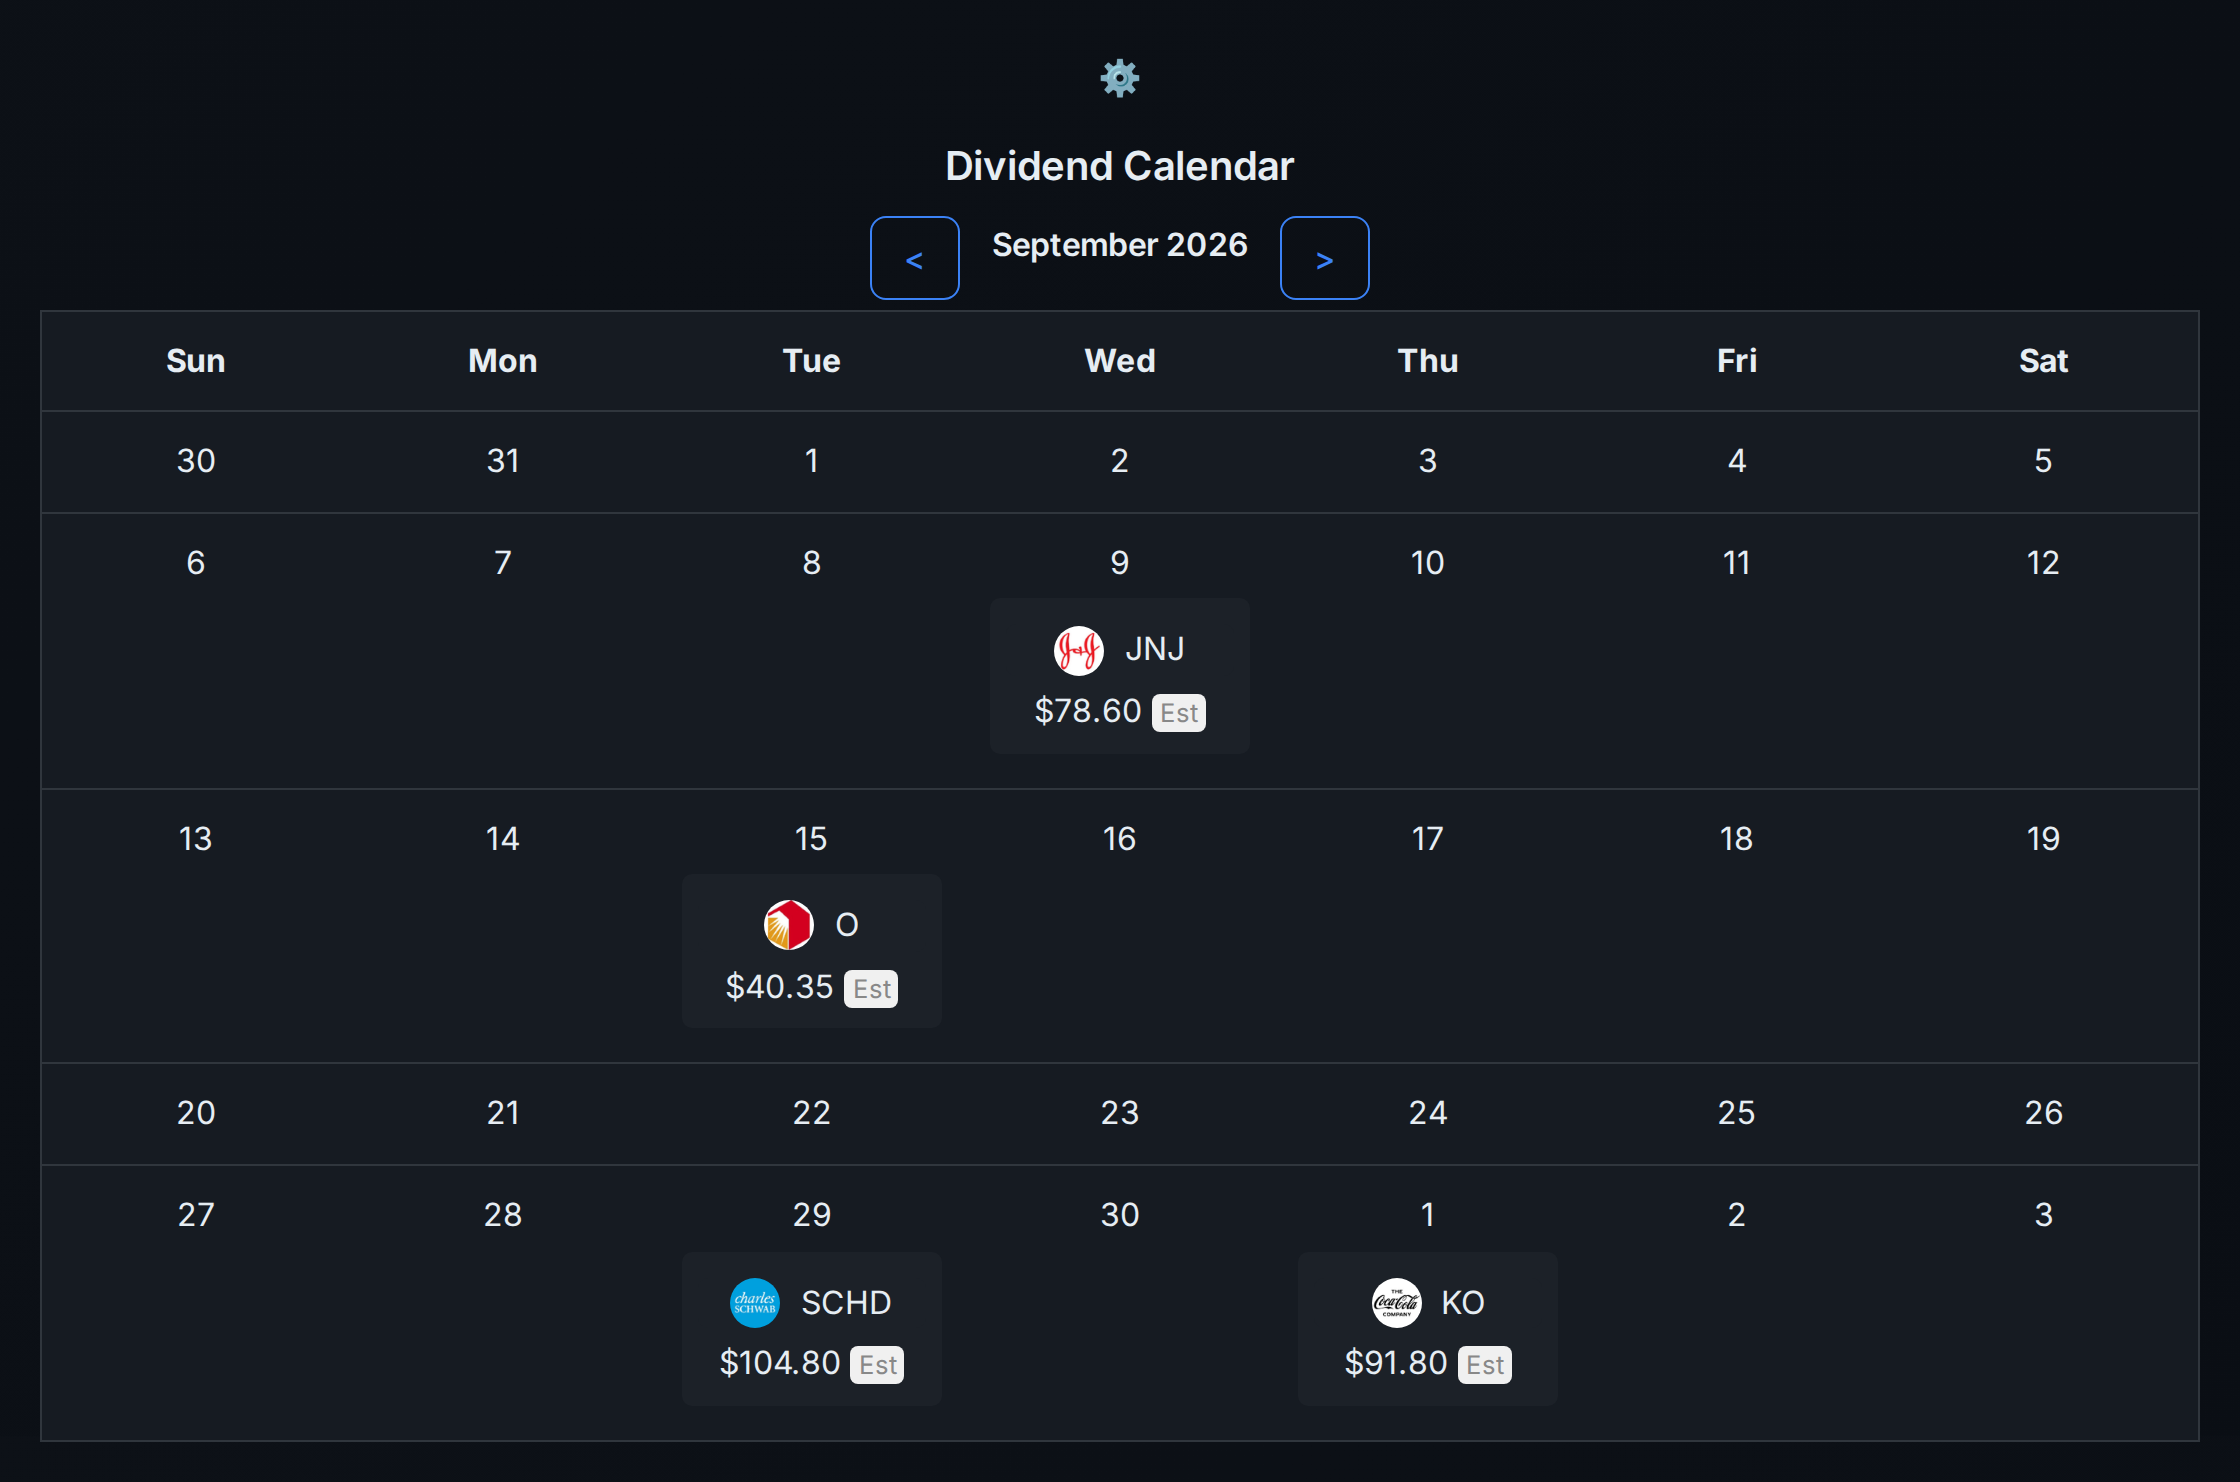
When each payment lands
The calendar places your coming payments on their pay dates, SCHD next to the shares you hold directly, so you can see which months pay the most.
Track your dividends for free
AllInvestView
Track your dividend ETFs from every broker in one place
Sync or import your accounts and AllInvestView shows what each fund paid you, what it will pay next, and its total return with dividends against the S&P 500.
Questions about dividend ETFs
What is the best dividend ETF?
For income now, SCHD: a 3.12% SEC yield for 0.06% a year, from 100 companies screened for quality. For a payout that grows, VIG or DGRO. For the broadest spread, VYM with about 590 companies for 0.04%. JEPI pays the most, 7.45%, but most of that comes from selling options.
Is SCHD or VYM better?
SCHD yields more (3.12% against 2.35%) and its payout grew faster, 10.7% a year from 2016 to 2025 against 5.3%. VYM is cheaper at 0.04% and far broader, with about 590 companies against 100. Over 10 years to 30 September 2026 they returned 12.44% and 11.28% a year.
Which dividend ETFs pay monthly?
Of the funds here, JEPI and HDV. SCHD, VYM, VIG, DGRO and VOO pay four times a year, usually in March, June, September and December. Monthly or quarterly makes no difference to the total you receive.
How much do I need to invest to make $1,000 a month in dividends?
At SCHD's 3.12% SEC yield, about $385,000. At VYM's 2.35%, about $510,000. At JEPI's 7.45%, about $161,000, though part of JEPI's payout comes from option income that moves with the market. Yields change, so treat these as rough sizes.
Do dividend ETFs beat the S&P 500?
Not over the last 10 years. To 30 September 2026 the best dividend ETF here, DGRO, returned 13.16% a year, against 15.29% for an S&P 500 fund. They held up much better in 2022, when VYM lost 0.42%, HDV gained 7.06% and the S&P 500 lost 18.15%.
Is JEPI a dividend ETF?
Partly. It owns about 140 large US stocks, but most of its 7.45% yield comes from selling call options on the S&P 500. That income is high when markets are jumpy and lower when they are calm, and the options cap part of the gain when stocks rise fast. Over the 5 years to 30 September 2026 it returned 7.78% a year, against 13.75% for the S&P 500.
Which dividend ETFs can I buy in the UK or Europe?
UCITS funds listed in London or on Xetra. Vanguard FTSE All-World High Dividend Yield (VHYL) holds high-yield companies worldwide for 0.29%. SPDR S&P Global Dividend Aristocrats (GLDV) and iShares UK Dividend (IUKD) are the other well-known choices.
Sources
Checked on 24 October 2026.
- Schwab U.S. Dividend Equity ETF (SCHD), returns to 30 September 2026, yield, holdings and assets 22 October 2026
- Vanguard High Dividend Yield ETF (VYM) fact sheet, 30 September 2026; calendar-year returns from the prospectus
- Vanguard Dividend Appreciation ETF (VIG) fact sheet, 30 September 2026; calendar-year returns from the prospectus
- iShares Core Dividend Growth ETF (DGRO), fact sheet and product page, 30 September 2026
- iShares Core High Dividend ETF (HDV), fact sheet and product page, 30 September 2026
- JPMorgan Equity Premium Income ETF (JEPI) fact sheet, 30 September 2026
- State Street SPDR Portfolio S&P 500 High Dividend ETF (SPYD), fact sheet 30 September 2026, assets 22 October 2026
- iShares Select Dividend ETF (DVY), 30 September 2026
- State Street SPDR S&P Dividend ETF (SDY), fact sheet 30 September 2026, assets 22 October 2026
- ProShares S&P 500 Dividend Aristocrats ETF (NOBL), 30 September 2026; calendar-year returns from the summary prospectus
- Vanguard International High Dividend Yield ETF (VYMI) fact sheet, 30 September 2026
- Vanguard S&P 500 ETF (VOO) fact sheet, 30 September 2026
- Vanguard FTSE All-World High Dividend Yield UCITS ETF fact sheet, 30 September 2026
- State Street SPDR S&P Global Dividend Aristocrats UCITS ETF fact sheet, 30 September 2026
- iShares UK Dividend UCITS ETF, 22 October 2026
Yields, fees and returns are each fund's own published figures. Payout growth, holdings and overlap come from our dividend records and the funds' holdings lists. Past returns and payouts don't tell you future ones, and none of this is personal investment advice.