Growth companies and the index
Apple and Microsoft pay a dividend, but most of what they earn goes into the business and buybacks. A fund that tracks the whole S&P 500 sits near 1%.
Dividend yield is a year of dividends divided by the share price. A $100 share that pays $4 a year yields 4%. The price sits underneath, so the yield goes up when the price falls and down when it rises, even if the dividend doesn't change.
You'll see it quoted two ways: trailing, from the dividends paid in the last 12 months, and forward, from the latest dividend times the payments in a year. Yield on cost divides by what you paid instead of today's price, which is why shares you've held for years can pay you far more than their quoted yield.
Coca-Cola paid $2.10 a share in the 12 months to 22 October 2026 and closed that day at $95.34: a yield of 2.20%.
Enter the share price and the dividend, and how often it's paid. Add your shares and what you paid for them to see your yearly income and your yield on cost. It starts with Coca-Cola.
The same dividend gives a higher yield on a cheaper share. Nothing about the payment has changed.
This is the yield before tax. Yield on cost uses the price you paid and today's dividend. Funds that pay uneven amounts are better entered as a yearly total of what they paid in the last 12 months.
Thirteen stocks and funds people often hold for income, from the S&P 500 itself to a fund built to pay out monthly.









Dividends with an ex-dividend date from 23 October 2025 to 22 October 2026, divided by the closing price on 22 October 2026, from AllInvestView's market data. Yields move every trading day.
Apple and Microsoft pay a dividend, but most of what they earn goes into the business and buybacks. A fund that tracks the whole S&P 500 sits near 1%.
Coca-Cola, Johnson & Johnson and Procter & Gamble, and broad dividend funds like SCHD and VYM. Lower yields here usually come with a dividend that grows.
Real estate trusts, utilities and some consumer staples like PepsiCo. Realty Income pays monthly, and as a REIT it has to pay out most of its taxable income.
Sometimes a mature business that grows slowly, like Verizon, and sometimes a dividend about to be cut. JEPI's payout includes option premium, so it changes from month to month.
A good dividend yield is one the company can keep paying and ideally raise. For most dividend investors that lands somewhere between 2% and 5%. Compare a stock with its own history and its sector rather than with a number on its own: 3% is high for a software company and low for a REIT.
One holding: 100 Coca-Cola shares bought in October 2016 at $42, a round price close to that month's.
$2.10 ÷ $95.34What the stock paid over the last 12 months: $0.51 in December 2025, then $0.53 three times after the 2026 raise. Quote pages show either this or the forward yield, so check which one you're reading.
$0.53 × 4 = $2.12 ÷ $95.34The latest dividend for a full year. It picks up a raise or a cut straight away, so it's the better guide to the next 12 months.
$2.12 ÷ $42 paidThe same dividend against the price you paid. Your 100 shares cost $4,200 and now pay $212 a year.
When you bought, the yield was 3.3%. Coca-Cola has raised the dividend every year since, so the same shares now pay 5.0% on your money, while anyone buying today gets 2.2%. Yield on cost tells you how your own money is doing. Use the current yield when you compare a stock with anything you could buy today.
Round numbers, one company, 100 shares.
An ordinary yield for a steady payer.
The dividend hasn't changed yet, so screens now show the stock as a high yielder.
The yield looks ordinary again. Your income halved and your shares are worth half what they were.
The dividend as a share of earnings. Above 100% for long, a company is paying out more than it earns, so check its free cash flow too. REITs are measured against funds from operations (FFO) instead. More in payout ratio.
Look at the price chart before the yield. A yield that rose because the price dropped can mean the market doubts the dividend, or just a bad month for every stock. Find out which.
Covered-call funds pay out option premium, and some funds hand back part of your own money as return of capital. Both count in the yield, and neither is the same as a company's profits.
Quoted yields are before tax. On $10,000 at a 4% yield, that's $400 a year in dividends.
Qualified dividends are taxed at 0%, 15% or 20%, depending on your income. At 15% the $400 becomes $340, a 3.4% yield after tax. Dividends held for too short a time are taxed as ordinary income.
The US withholds 30% of dividends paid to non-US investors, or 15% in most treaty countries once your broker has a W-8BEN. Your own country may tax the dividend again, usually with a credit for what was withheld. See the withholding tax guide.
The dividend tax calculator gives the tax on a year of dividends, and the dividend calculator projects your income with reinvestment and dividend growth.
Every holding from every broker you add, with its current yield next to its yield on cost.
The dividend report works out a year of income for each holding from its own dividend history, then divides it by today's value and by what you paid. The whole portfolio gets the same two numbers at the top of the report. Sort by either yield to see which holdings carry your income.
See the dividend tracker AllInvestView
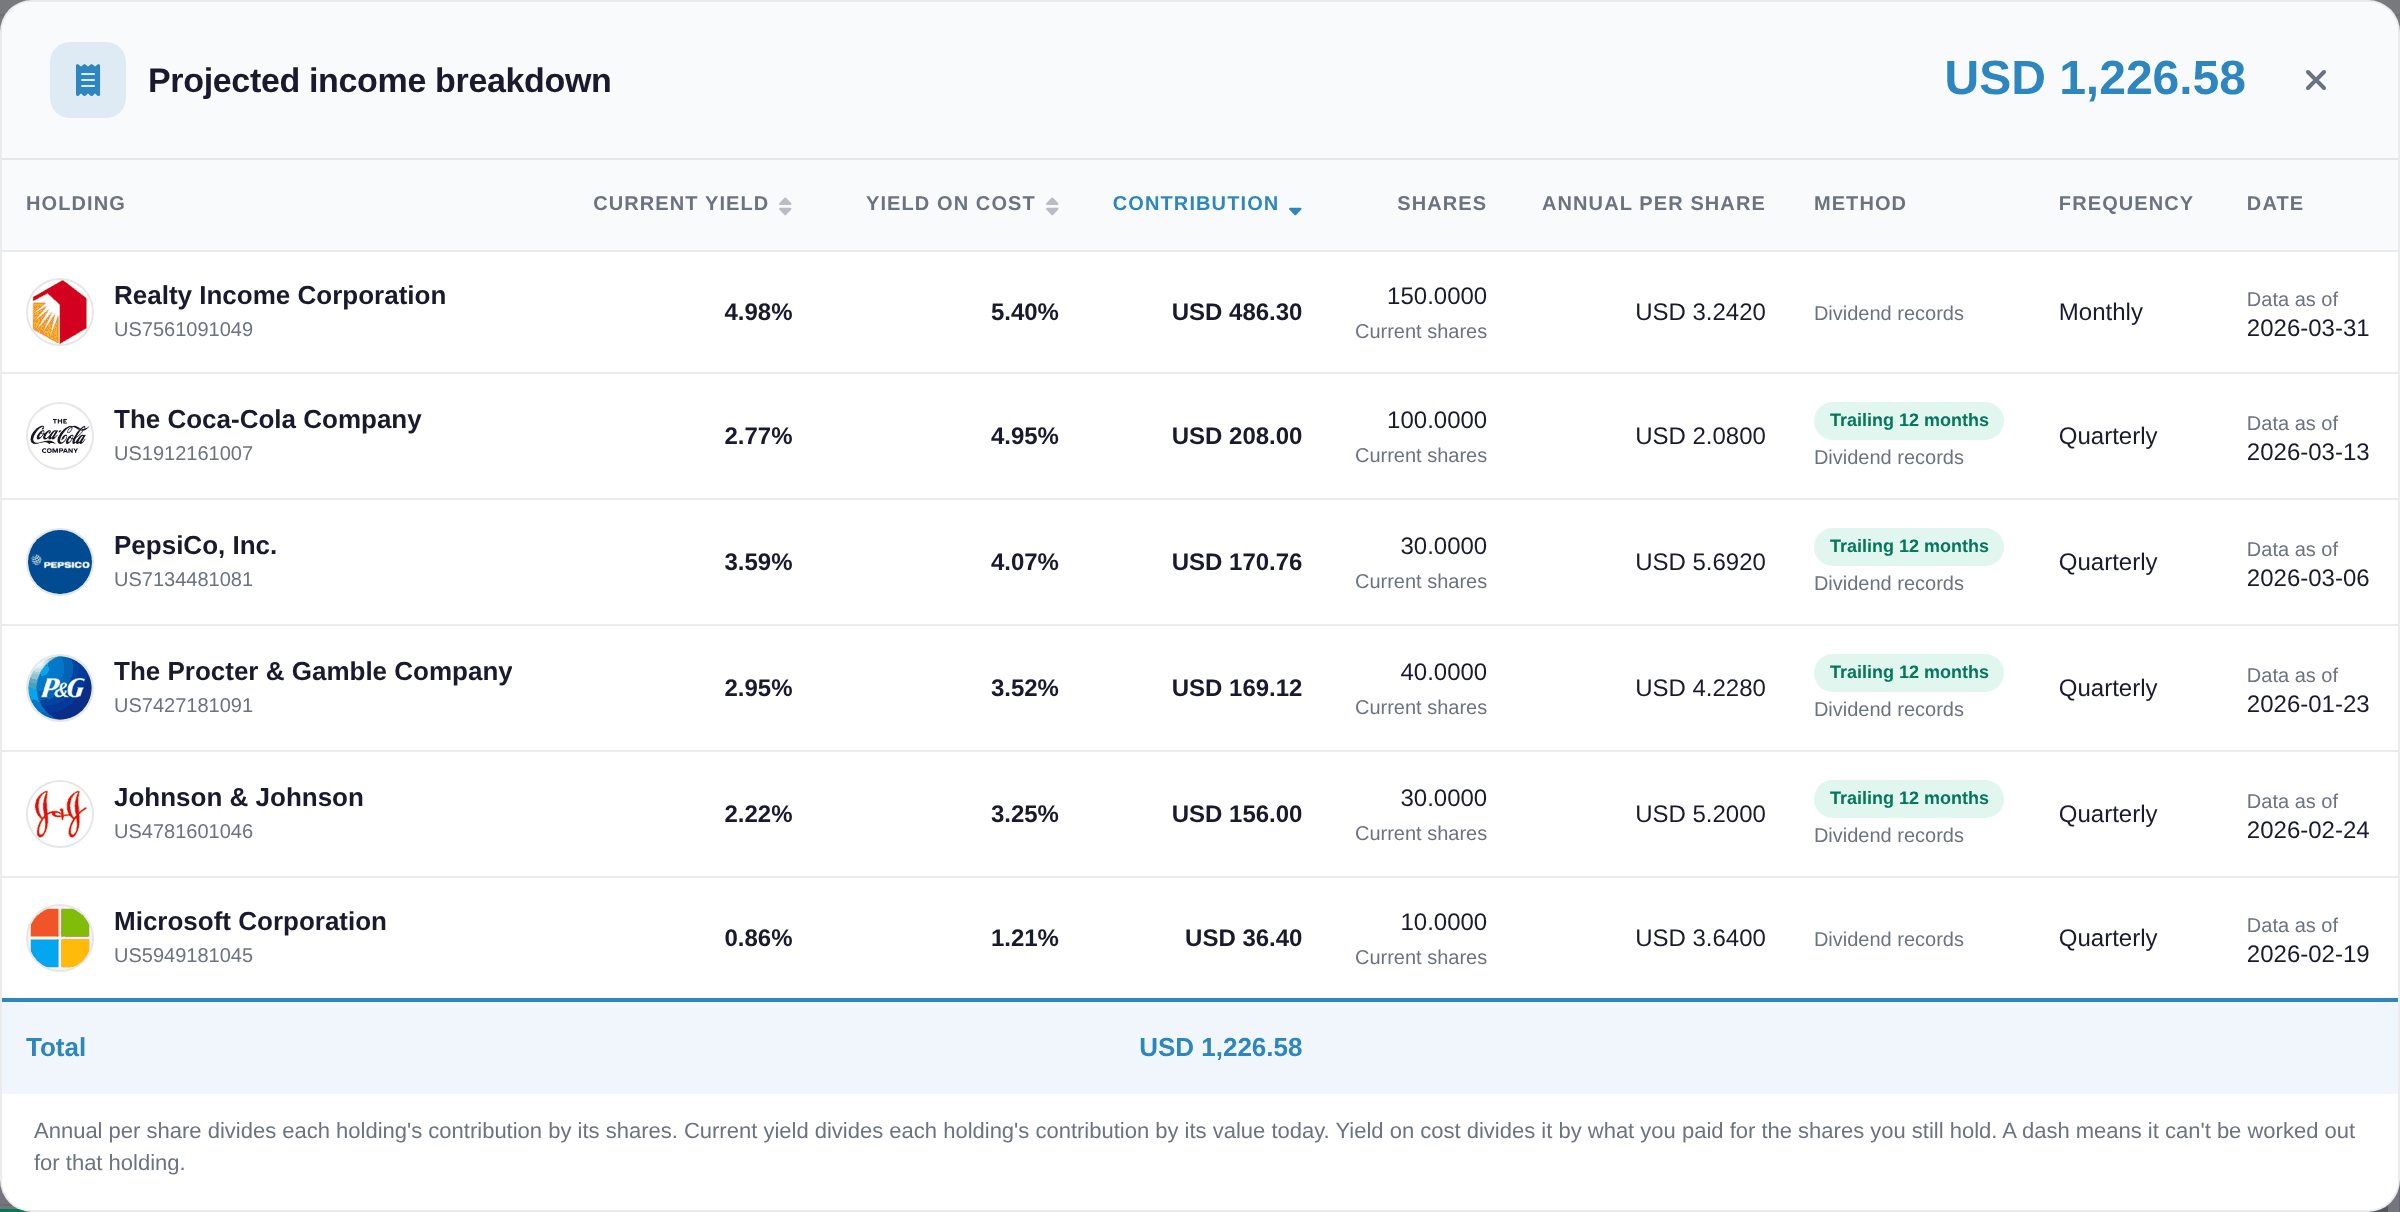
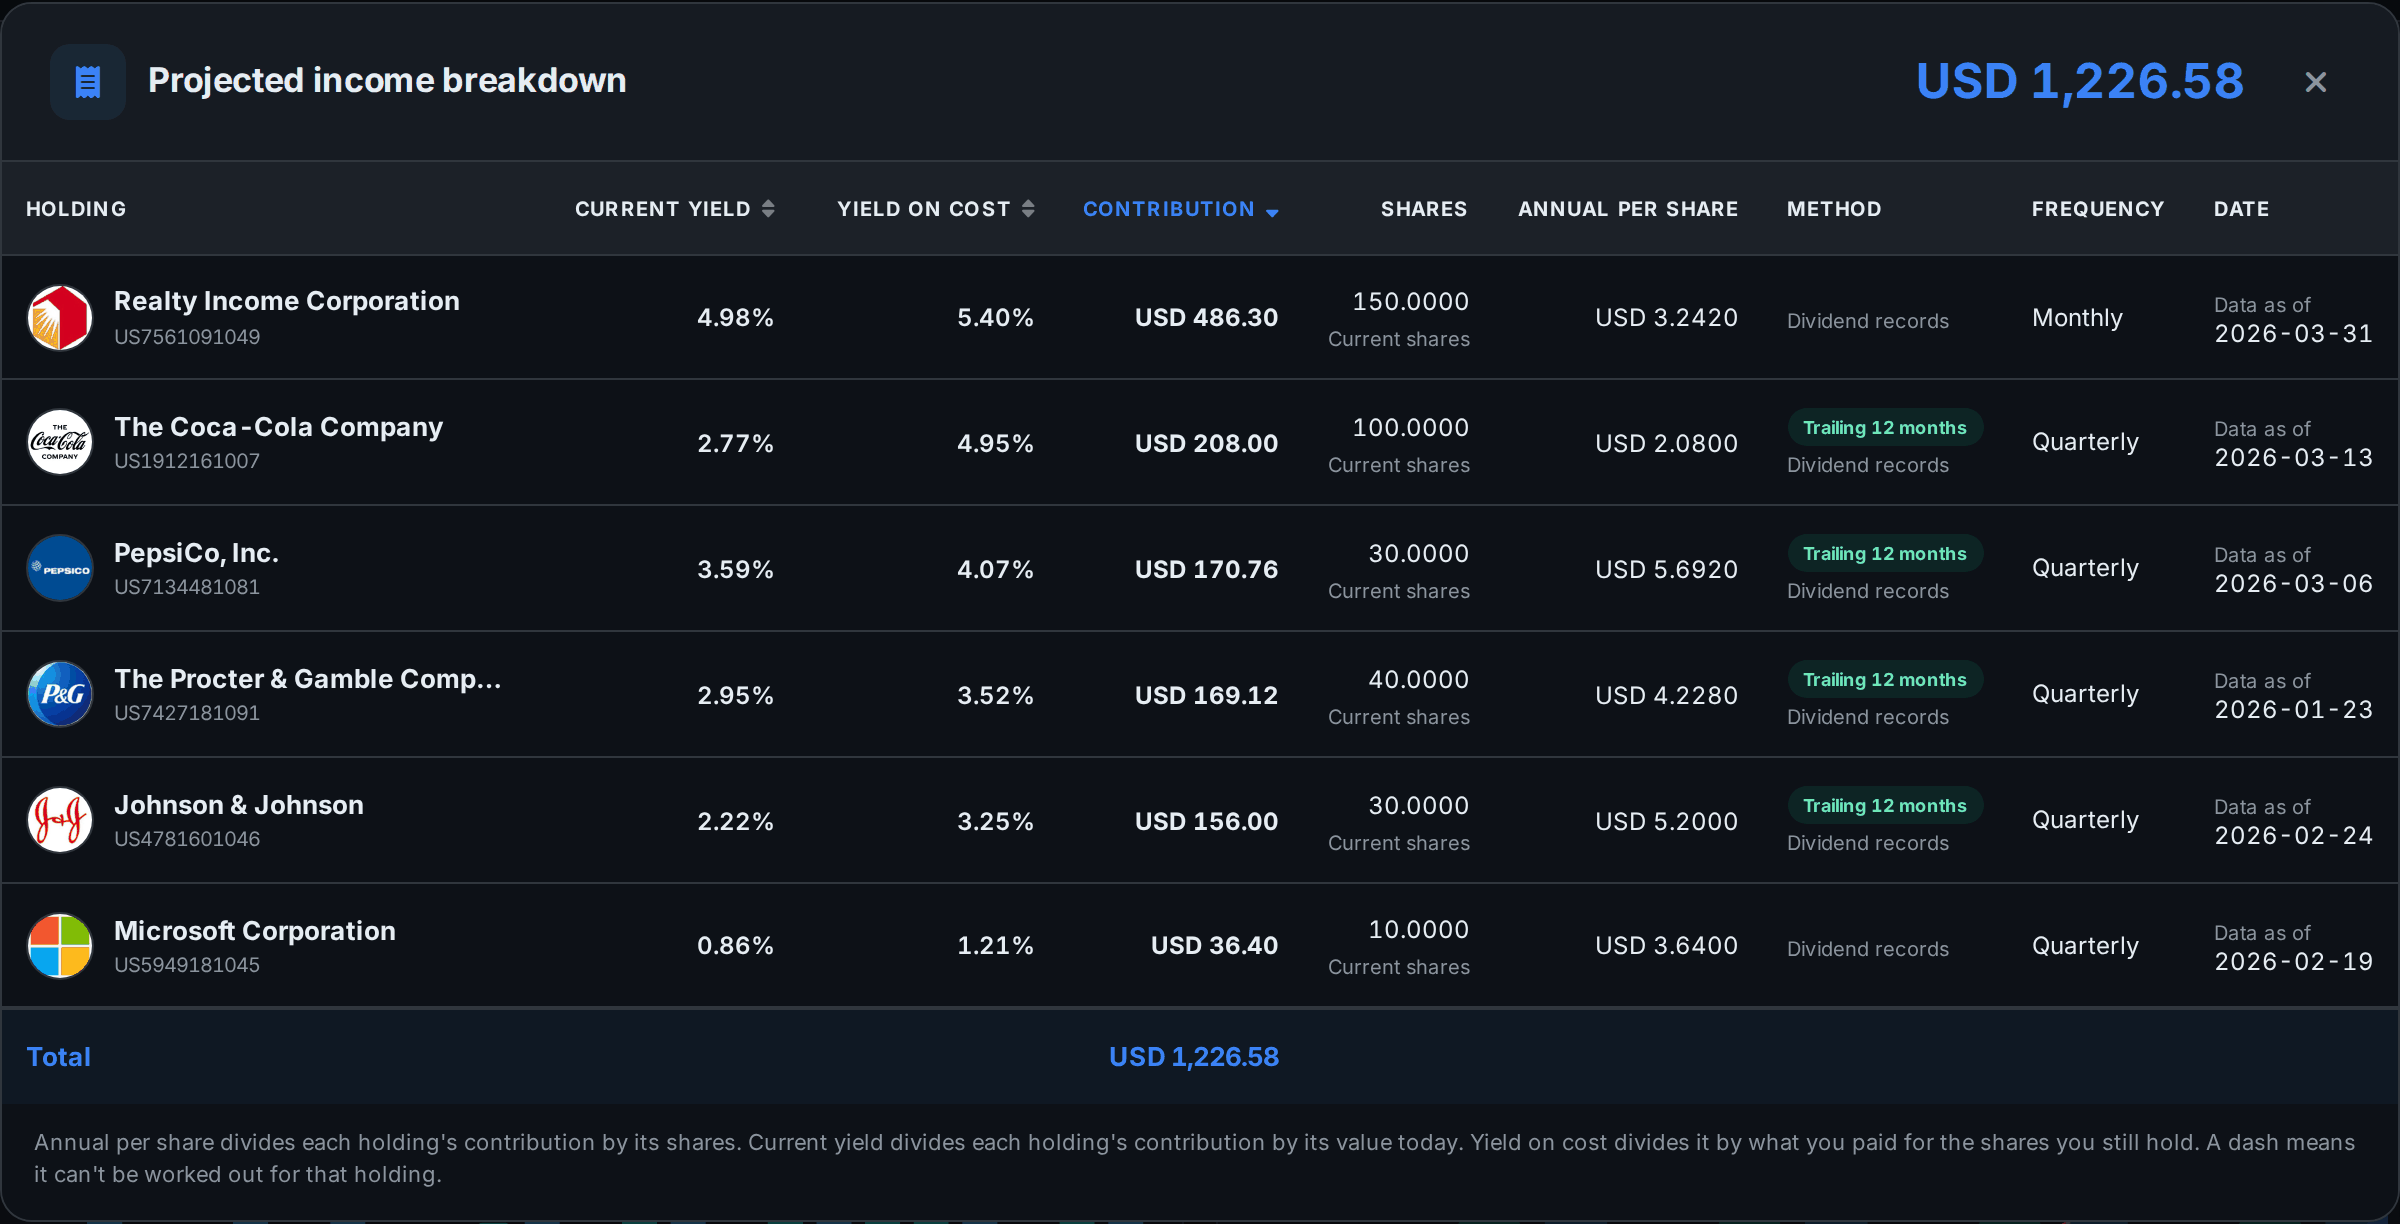
Every payment is booked against the shares you held on the ex-dividend date, with the tax withheld at source. Your top payers, income month by month and what the next 12 months should bring. A calendar shows each payment on its pay date.
See the dividend trackerAllInvestView
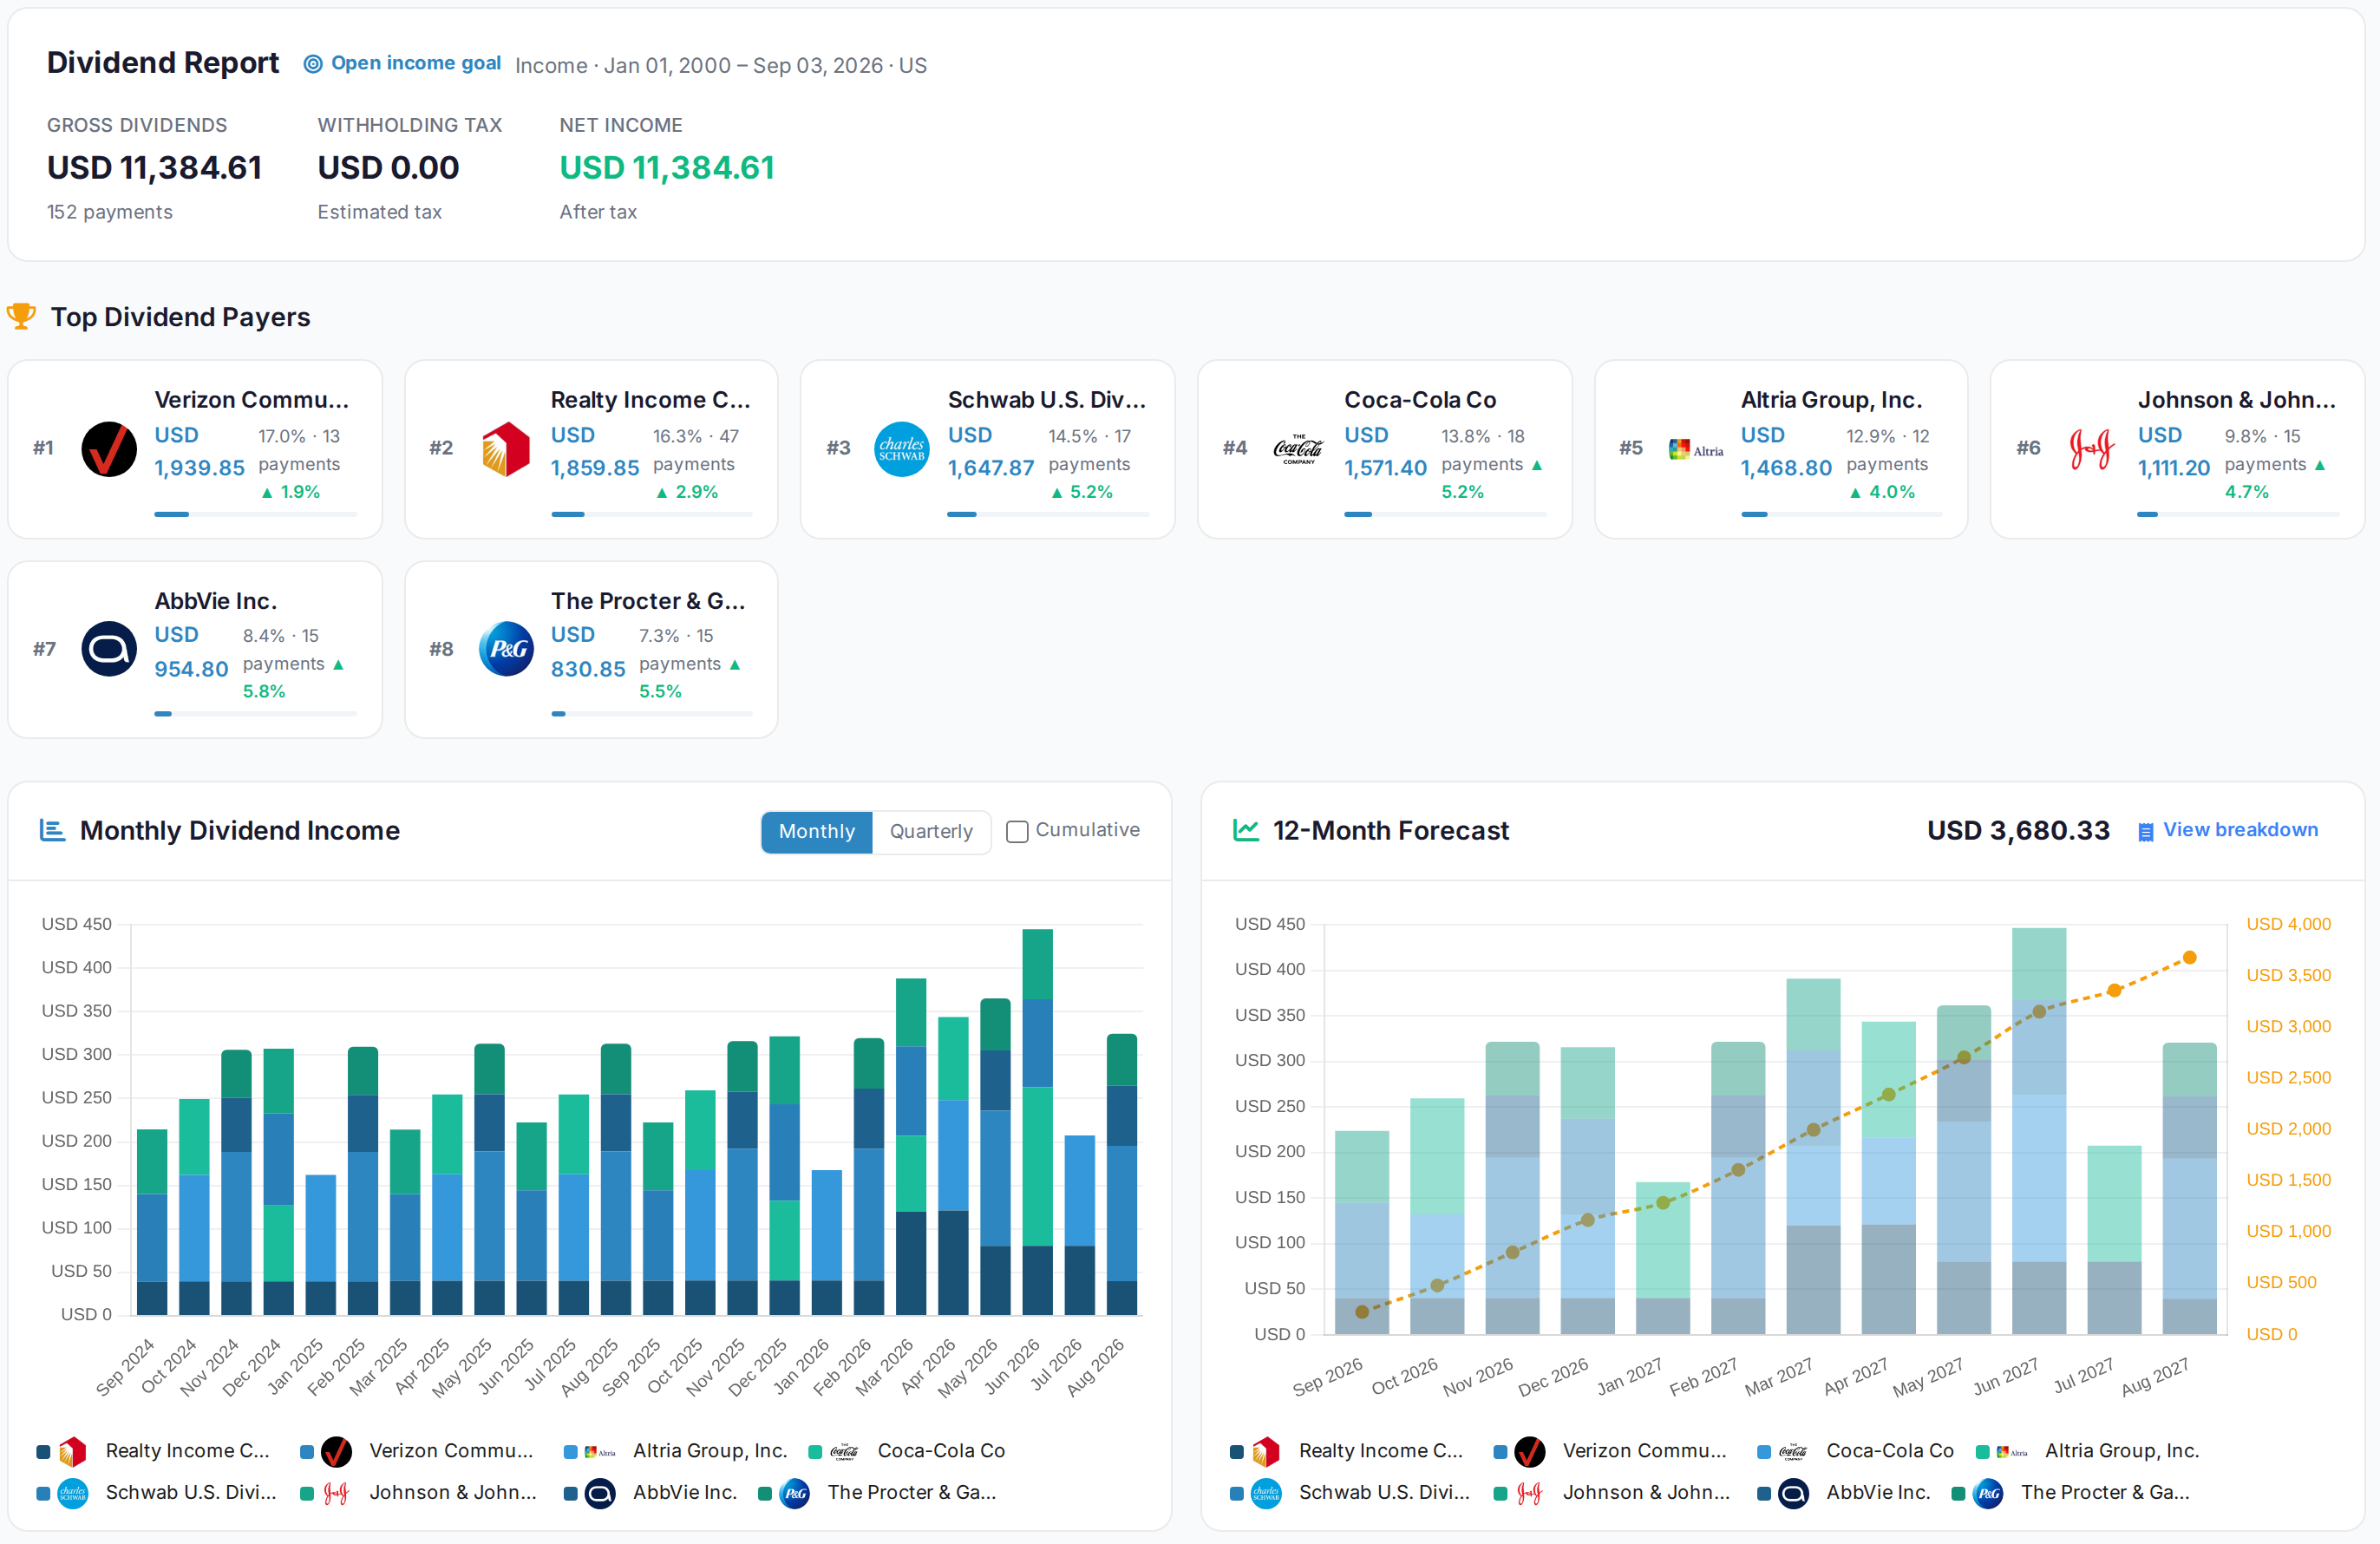
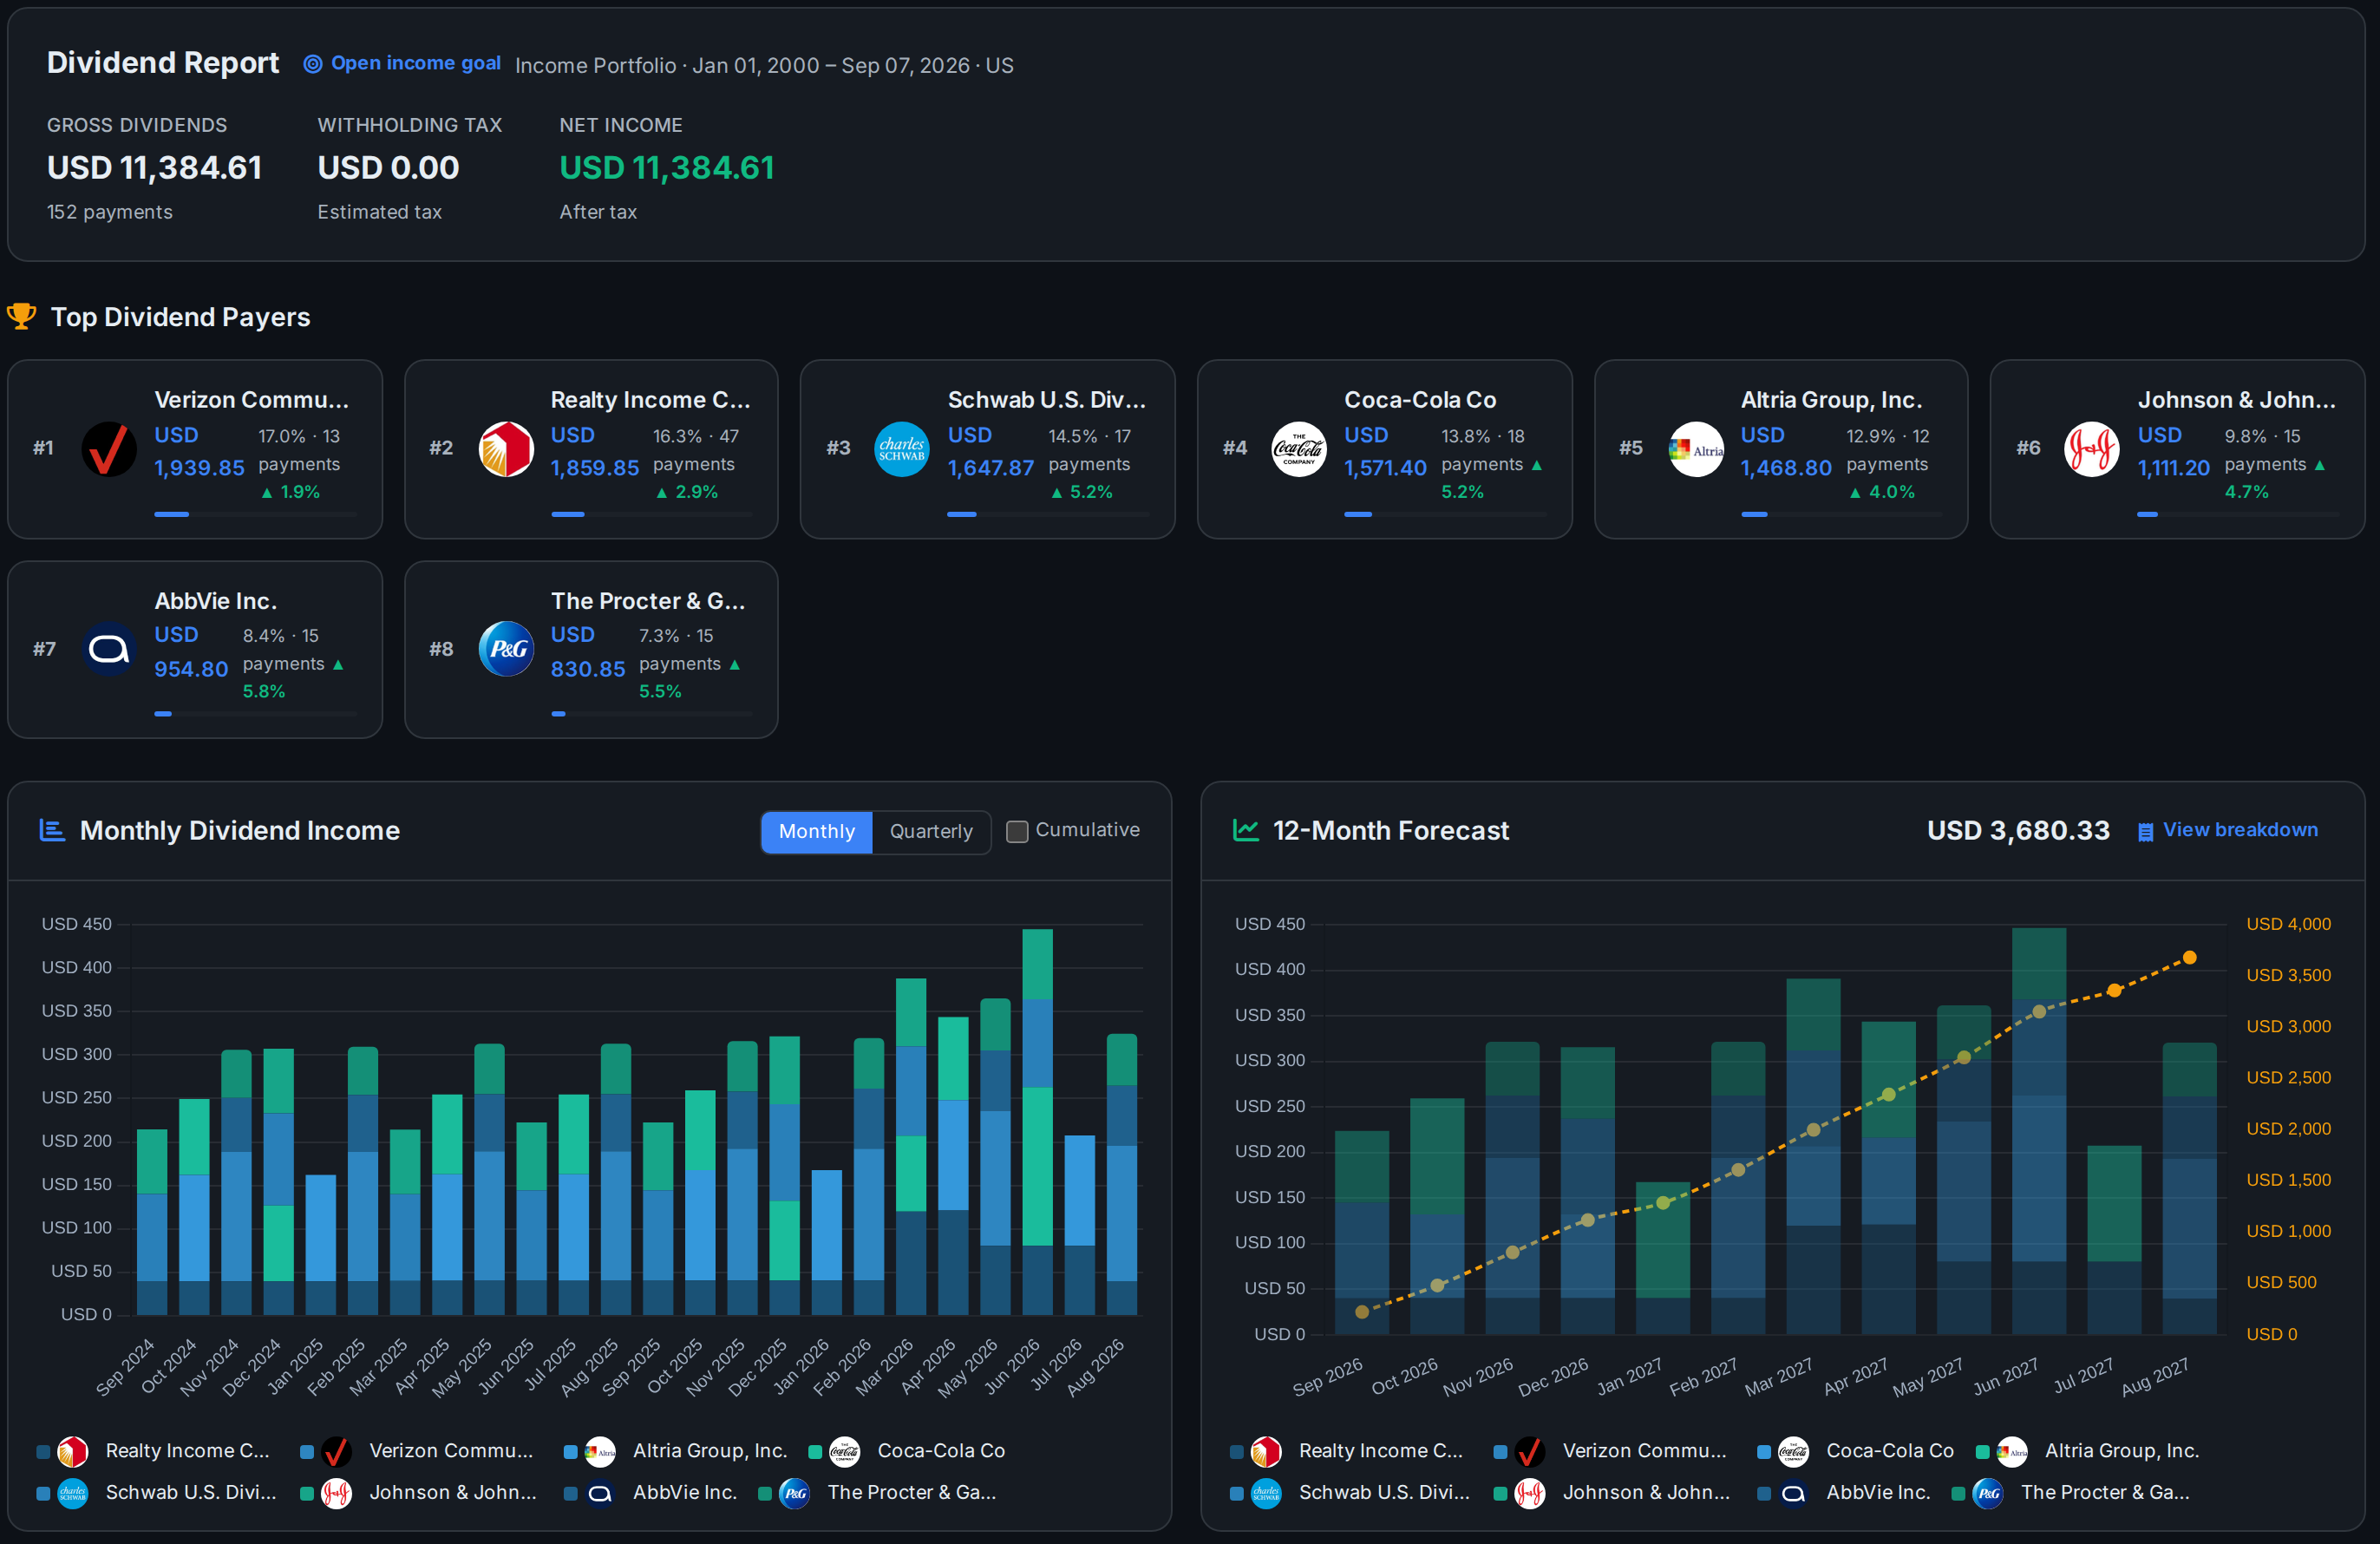
Every account side by side, each holding's yield and yield on cost, a calendar of what's coming and a forecast of the next 12 months. Gross and net of withholding, with returns that count the dividends.
Add up the dividends per share for a year and divide by the share price, then multiply by 100. A stock at $50 paying $0.50 a quarter pays $2 a year, so it yields 4%.
One the company can keep paying. On 22 October 2026 the S&P 500 fund SPY yielded about 1%, broad dividend funds like SCHD and VYM 2% to 3%, and real estate trusts and telecoms 4% to 6%. Most dividend investors aim for 2% to 5%. Above 8%, check the payout ratio and why the price fell.
Not by itself. A yield often looks high because the share price has fallen, and a company in trouble may cut the dividend next. Look at the payout ratio, the dividend history and the business before the yield.
Yes. It's always a yearly figure, even when the dividend is paid quarterly or monthly. A $0.53 quarterly dividend counts as $2.12 a year.
Trailing yield uses the dividends paid in the last 12 months. Forward yield takes the latest dividend and multiplies it by the number of payments in a year. After a raise the forward yield is higher, and after a cut it's lower, before the trailing figure catches up.
A year of dividends divided by the price you paid per share. If you bought at $42 and the dividend is now $2.12 a year, your yield on cost is 5.05%, whatever the share price is today.
No. Yield is only the income part. Your total return adds the change in the share price, so a 6% yield on a share that falls 10% in a year still leaves you behind.
Checked on 23 October 2026.
Yields on this page are from AllInvestView's market data for the dates shown. Tax rules are US federal rules for individuals. None of it is personal investment or tax advice.