The 60/40 peaked on 27 December 2021 and fell 20.9% by October 2022. It was back above that high on 29 January 2024, seven weeks after the S&P 500.
Model portfolio, tested on real prices
60/40 Portfolio: Returns Since 1987, ETFs and Rebalancing
A 60/40 portfolio keeps 60% of your money in stocks and 40% in bonds, and you put it back to that split about once a year. The stocks do the growing. The bonds soften the falls.
With two Vanguard index funds, $10,000 at the end of 1986 grew to $311,030 by 23 October 2026, 9.0% a year. The S&P 500 on its own made 11.2% a year but fell 55.3% at its worst. The 60/40 never fell more than 34.2%.
$10,000 became$311,030end of 1986 to 23 Oct 2026, dividends reinvested
A year9.0%S&P 500: 11.2%. Bonds: 5.0%
Worst fall34.2%Oct 2007 to Mar 2009. S&P 500: 55.3%
In 2022−16.1%Stocks and bonds fell together
60/40 portfolio returns since 1987
60% Vanguard 500 Index and 40% Vanguard Total Bond Market Index, rebalanced every January, against each fund on its own.
- 60/40
- S&P 500
- US bonds
Month-end values on a log scale, so the same percentage gain takes the same height in 1990 as in 2020. Move along the chart to read any month.
| Dec 1986 to Oct 2026 | $10,000 became | A year | Worst fall | Worst year | Years with a loss | Worst 10 years |
|---|---|---|---|---|---|---|
| 60/40 | $311,030 | 9.0% | −34.2% | −20.4% (2008) | 7 of 39 | +0.6% a year |
| S&P 500 | $689,657 | 11.2% | −55.3% | −37.0% (2008) | 7 of 39 | −3.5% a year |
| US bonds | $68,540 | 5.0% | −18.8% | −13.2% (2022) | 6 of 39 | +0.6% a year |
60/40 vs 70/30, 80/20 and 50/50
The same test for every split from all bonds to all stocks. Move the slider to see what each one did from 1987 to 2026.
60/40stocks / bonds
$10,000 became$311,030
A year9.0%
Worst fall−34.2%
Worst year−20.4%2008
2022−16.1%
Years with a loss7of 39
Each dot is one split. Up means more return a year, right means a deeper worst fall. Below about 40% in stocks the worst fall barely shrinks, because bonds had their own fall in 2022.
Year by year
Calendar-year returns with dividends reinvested. 2026 runs to 23 October. Years in red are the 60/40's losses.
- 60/40
- S&P 500
2000 to 2002: bonds carried it
The S&P 500 fell three years running, 9.1%, 12.0% and 22.2%. Bonds gained 11.4%, 8.4% and 8.4%, so the 60/40 lost 0.9%, 3.8% and 9.9%.
2008: the worst year
Stocks lost 37.0% and bonds gained 5.1%. The 60/40 lost 20.4%, and its stock half shrank to 44% of the total before the January rebalance bought back in.
2022: both fell
Rates jumped, stocks lost 18.2% and bonds 13.2%. The 60/40 lost 16.1%, its second-worst year. The only other year since 1987 when both fell was 2018, when bonds lost 0.1%.
Is the 60/40 portfolio dead?
The case against it rests on 2022. Here is what happened next.
Three strong years and a good start to 2026. The bond fund on its own is still 4.3% below its August 2020 high.
The 10-year Treasury yield. Bonds went into 2022 paying almost nothing, which left no cushion when rates rose. Today that yield is more than three times higher.
60/40 ETFs: two funds or one
Two funds cost the least and let you choose each half. One fund rebalances itself. Fees checked 24 October 2026.
Two funds: S&P 500 and US bonds
The same two halves as the test above.
Blended fee 0.03% a year
Two funds: the whole US market
Adds mid and small companies to the stock half.
- VTIVanguard Morningstar Total Stock Market ETF60%0.03% a year
- AGGiShares Core U.S. Aggregate Bond ETF40%0.03% a year
Blended fee 0.03% a year
Two funds: the whole world
Stocks and bonds from every major market.
Blended fee 0.06% a year
One fund that keeps the 60/40 for you
| Fund | What it holds | Fee | Good to know |
|---|---|---|---|
 VBIAXVanguard Balanced Index Fund Admiral Shares | 60% US stocks, 40% US bonds | 0.07% a year | A mutual fund, not an ETF, with a $3,000 minimum. |
VSMGXVanguard LifeStrategy 60/40 Fund | 36% US and 24% international stocks, 28% US and 12% international bonds | 0.10% a year | A mutual fund that holds four Vanguard index funds. |
 AORiShares Core 60/40 Balanced Allocation ETF | 60% stock funds, 40% bond funds | 0.15% a year | An ETF. The fee is 0.20% before a waiver that runs to 30 November 2026. |
If you buy in Europe
| UCITS fund | ISIN | Fee | Good to know |
|---|---|---|---|
V60A or V60DVanguard LifeStrategy 60% Equity UCITS ETF, Acc or Dist | IE00BMVB5P51 / IE00BMVB5Q68 | 0.25% a year | One fund, global stocks and bonds, rebalanced for you. |
VWCE + VAGFVanguard FTSE All-World UCITS ETF (Acc) and Vanguard Global Aggregate Bond UCITS ETF EUR Hedged (Acc) | IE00BK5BQT80 / IE00BG47KH54 | 0.12% a year | 0.14% and 0.08%, about 0.12% blended at 60/40. You rebalance. |
What your money buys
Whole shares of VOO and BND at the 23 October 2026 close. With fractional shares you can split any amount exactly.
| ETF | Price | Shares | Cost |
|---|---|---|---|
| Total | |||
| Cash left over | |||
The cash left over is what whole shares can't use up.
How to rebalance a 60/40 portfolio
Bring the stock half back to 60%, by selling the half that grew or by sending new money to the half that fell behind.
$10,000 split 60/40 in VOO and BND on 2 January 2026 was worth $10,694 by 23 October, with stocks at 62.9%. Type in your own amounts.
$
$
$
%
| Half | Now | Target | Trade |
|---|---|---|---|
| Total |
What rebalancing did since 1987
Left alone from 1987, the same $10,000 would have grown to $441,210, but stocks would have drifted to 94% of it and the fall in 2008 and 2009 would have been 42.1%, not 34.2%. Rebalancing is what keeps a 60/40 a 60/40.
Where to hold the bonds
In the US, bond fund interest is taxed as ordinary income each year. If you hold the 60/40 across an IRA and a taxable account, keeping the bonds in the IRA and more of the stocks in the taxable account usually costs less tax. Rebalancing inside the IRA also avoids selling in the taxable account.
Tracking it across accounts
Your 60/40 against its targets, with the trades to fix it
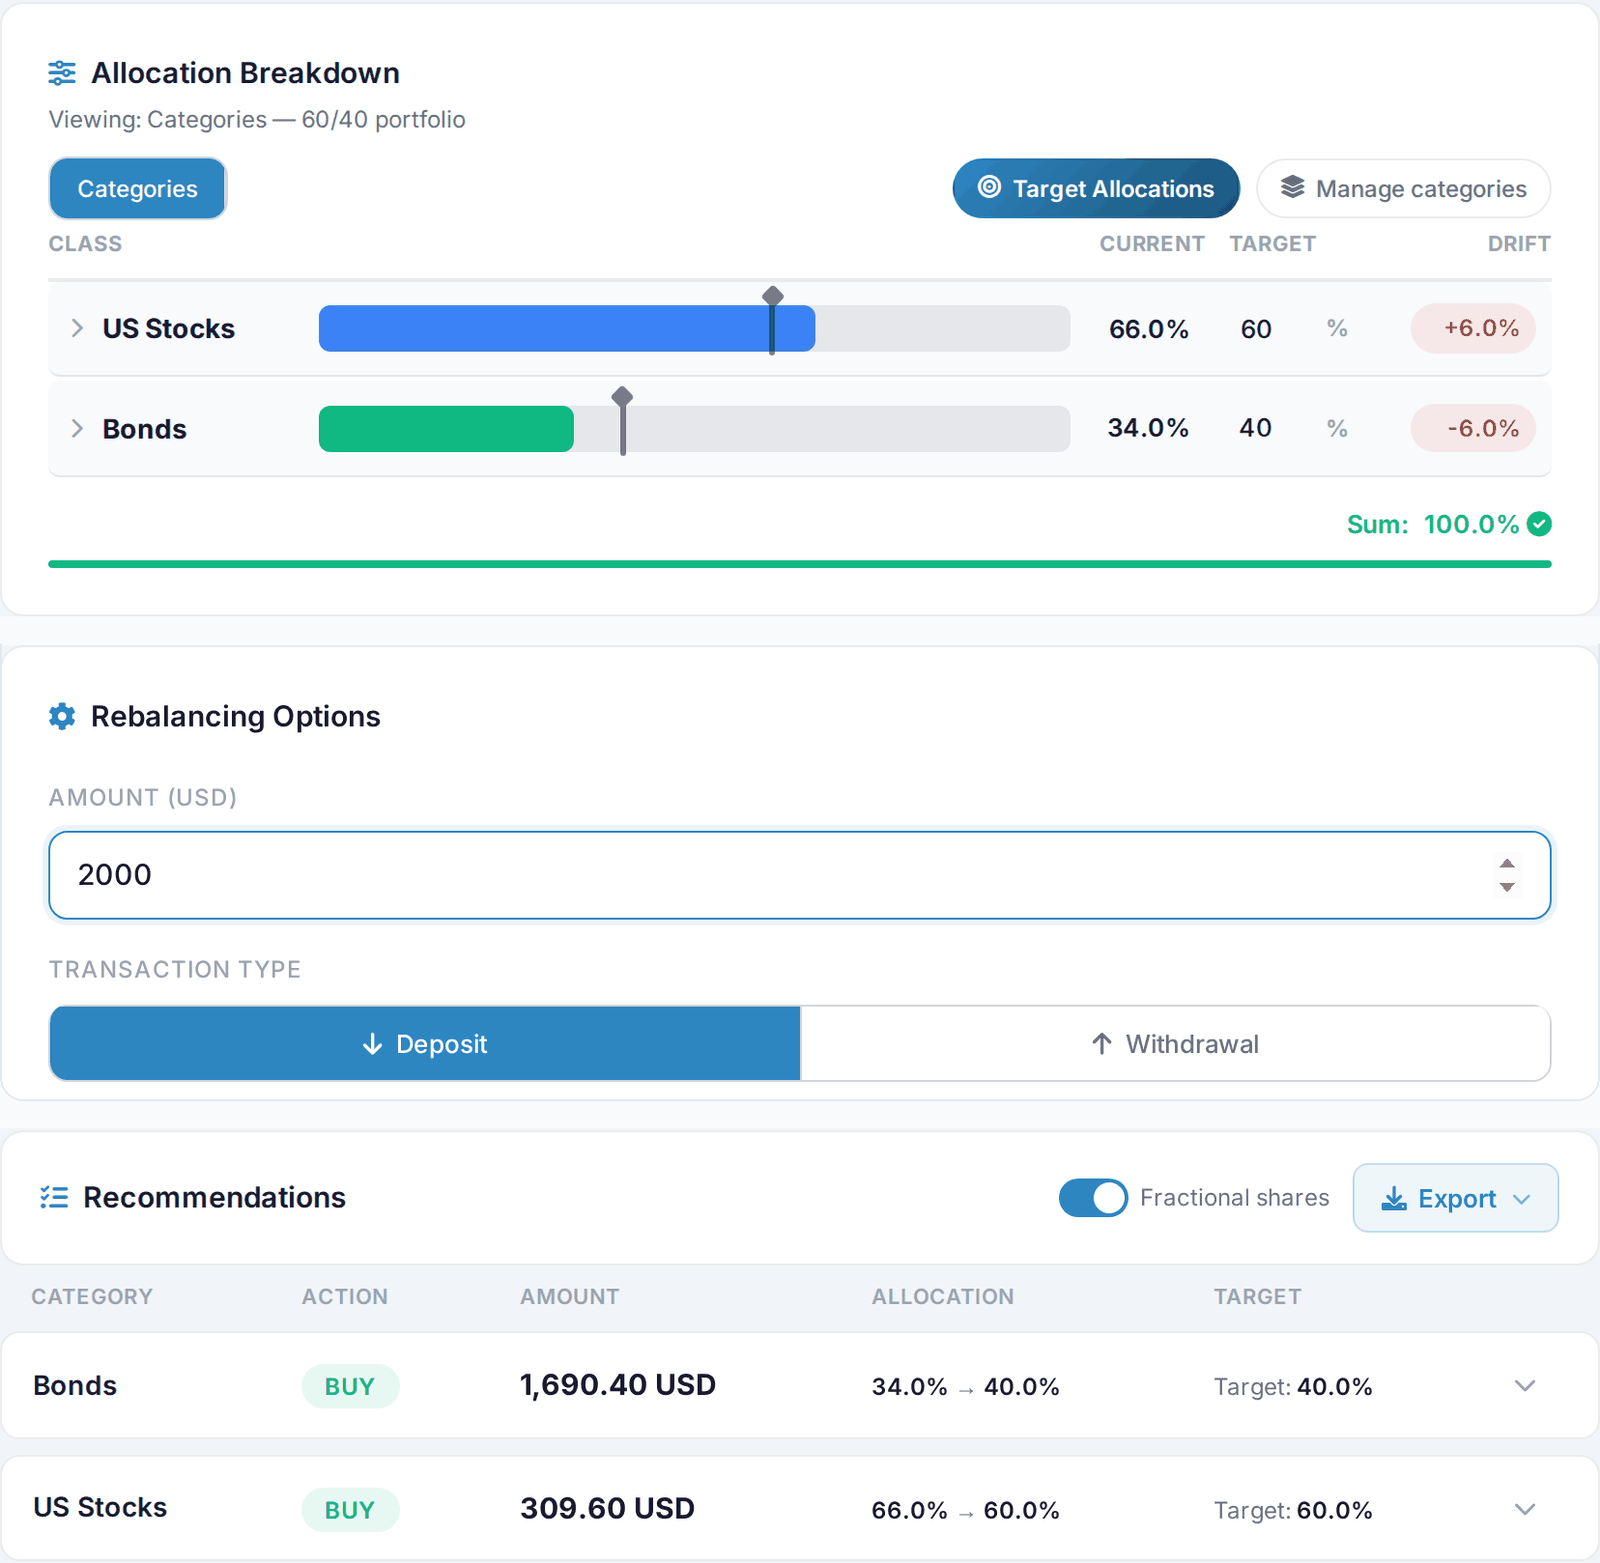
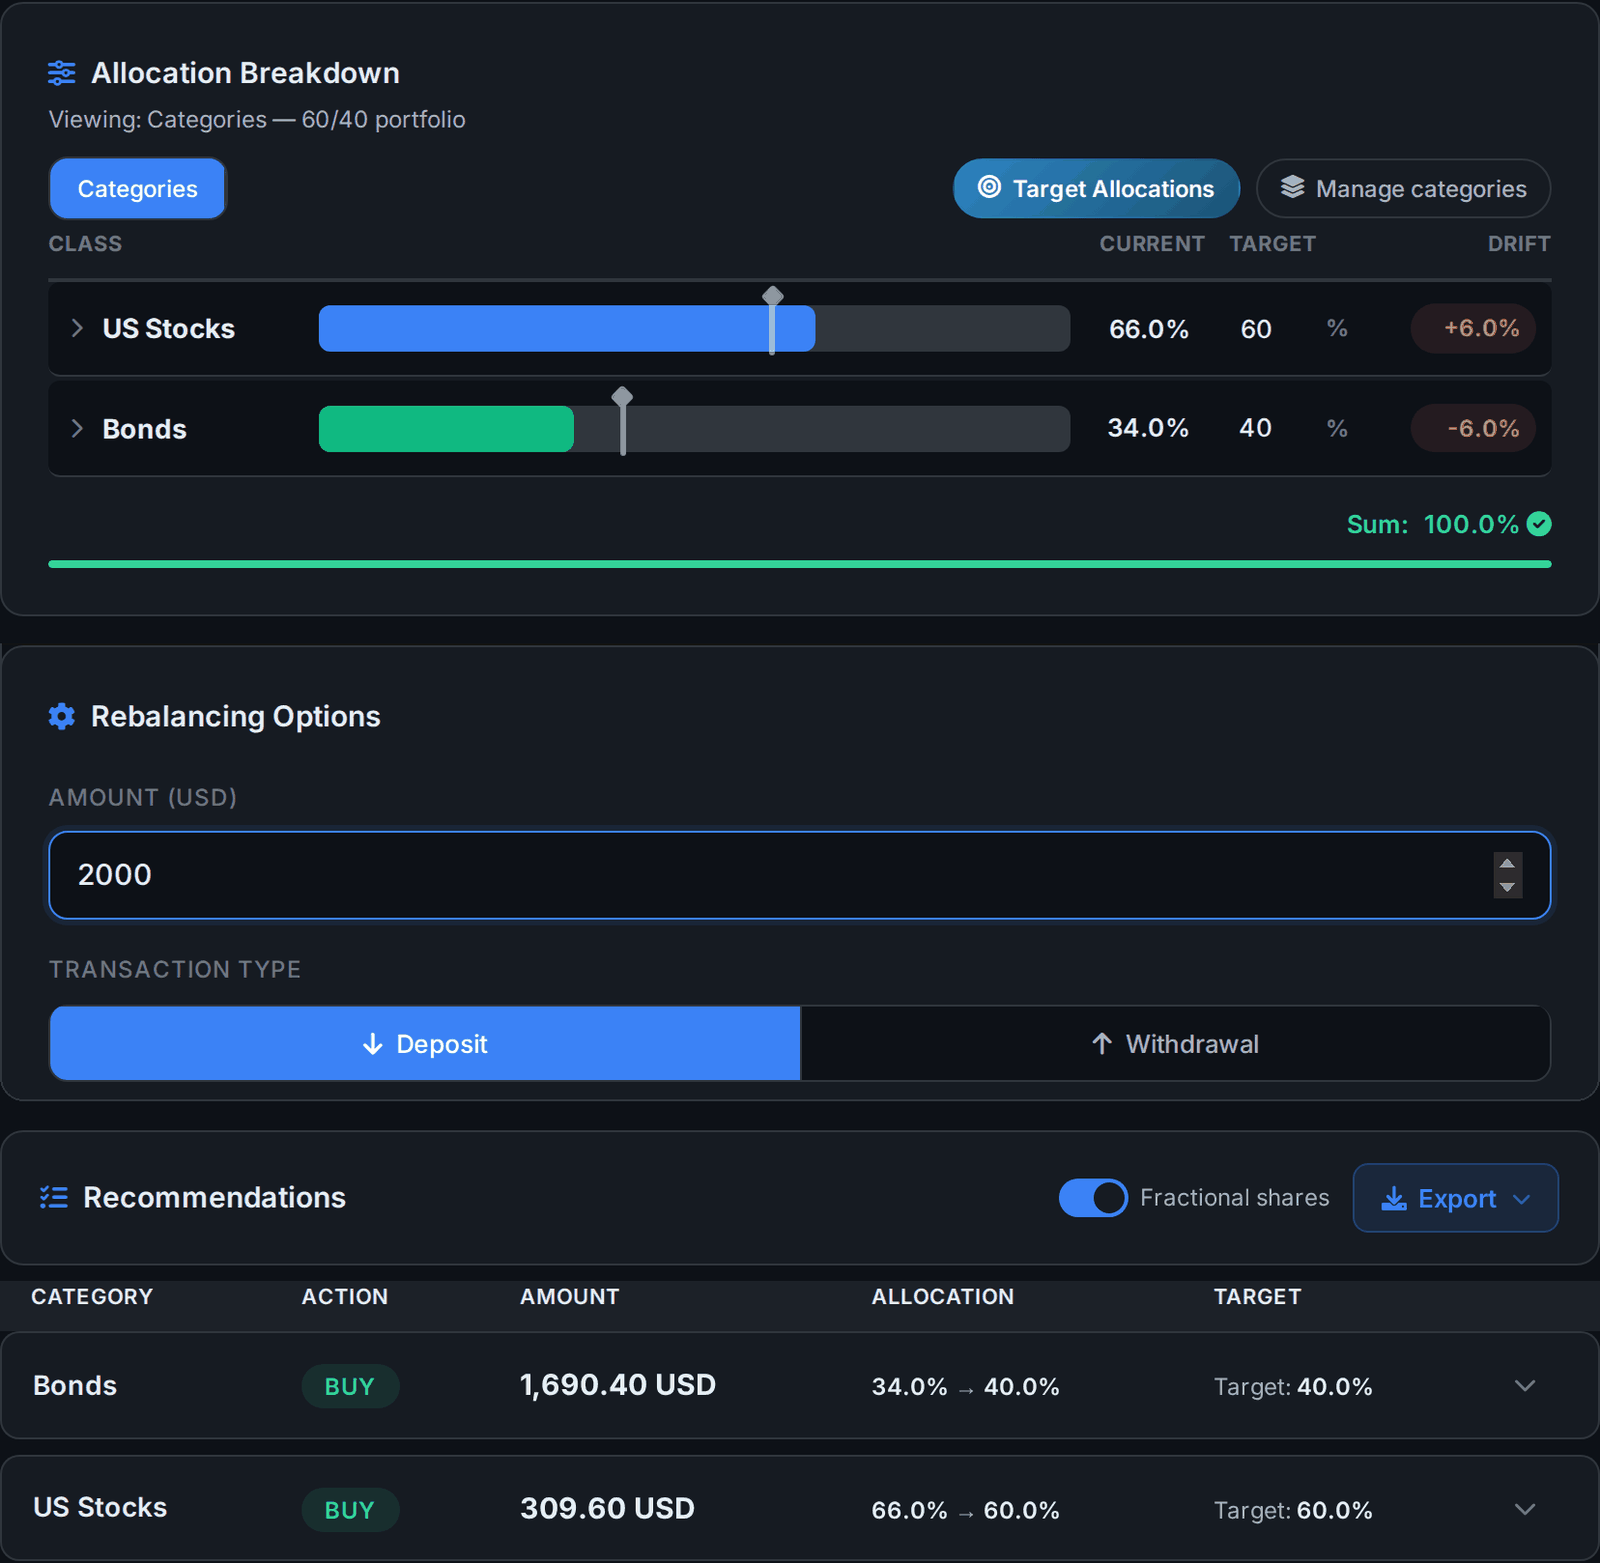
AllInvestView adds up your stocks and bonds from every broker and account and shows each half against its 60% and 40% target from live prices. Enter what you're adding and it splits the money between the halves, or lists the sells and buys if you allow selling, with the estimated tax on each sell from your own capital gains rules. A two-fund 60/40 fits easily in the free plan's ten holdings.
Read the rebalancing guide AllInvestView
60/40 vs the three-fund portfolio, Golden Butterfly and All Weather
The same test for all four: $10,000 on 2 January 2019 to 22 October 2026, rebalanced every January.
60/40
60% S&P 500 and 40% US bonds.
$10,000 became$22,629
A year11.0%
Worst fall−20.9%
In 2022−16.0%
Three-fund
60% US stocks, 20% international stocks, 20% US bonds.
$10,000 became$25,079
A year12.5%
Worst fall−28.0%
In 2022−17.5%
Golden Butterfly
20% each in two stock funds, long and short Treasuries, and gold.
$10,000 became$20,003
A year9.3%
Worst fall−18.8%
In 2022−12.9%
All Weather
30% stocks, 55% Treasuries, 7.5% gold and 7.5% commodities.
$10,000 became$16,736
A year6.8%
Worst fall−23.7%
In 2022−19.2%
What the 60/40 gives up
Four costs worth knowing before you settle on it.
Since 1987 the S&P 500 on its own ended with $689,657 against $311,030. The 60/40 came out ahead over only 61 of the 359 ten-year stretches in the test, all of them ending between 2007 and 2012, after two crashes.
When inflation and rates jump, bonds and stocks can drop together. In 2022 they did, and the 60/40 lost 16.1%. A Golden Butterfly or All Weather portfolio adds gold for that kind of year.
40% in bonds softens a crash, it doesn't stop one. From October 2007 to March 2009 the 60/40 fell 34.2% and took until November 2010 to get back to its high.
Both halves in the test are US funds. For companies and bonds from the rest of the world, use VT and BNDW, a LifeStrategy fund, or a three-fund portfolio.
After you buy it
Track your 60/40 in one place
Sync or import your brokers and AllInvestView shows your stocks and bonds against their 60% and 40% targets, the return of the whole portfolio, the dividends and interest, and the tax when you sell.
Targets and drift for each half
Every broker in one view
Free for up to 10 holdings
Questions about the 60/40 portfolio
What is a 60/40 portfolio?
A portfolio with 60% in stocks and 40% in bonds, usually through two index funds, put back to that split once a year. The stocks do most of the growing and the bonds soften the falls. Pension funds and advisers have used it as the standard balanced mix for decades.
What is the 60/40 rule in investing?
It's shorthand for the 60/40 portfolio: keep about 60% of your investments in stocks and 40% in bonds, and rebalance when the split drifts. It's a starting point, not a law. Someone decades from retirement often holds more in stocks, and someone already living off the money often holds less.
What has a 60/40 portfolio returned?
With Vanguard's S&P 500 and total bond market index funds, $10,000 at the end of 1986 grew to $311,030 by 23 October 2026, 9.0% a year with dividends reinvested and a rebalance every January. It lost money in 7 of the 39 full years. The worst was 2008, down 20.4%, and the deepest fall from a high was 34.2%, from October 2007 to March 2009.
Is the 60/40 portfolio dead?
2022 was the case against it: stocks fell 18.2% and bonds 13.2% in the same year, and the 60/40 lost 16.1%. It was back at its old high by January 2024, and made 18.0% in 2023, 15.4% in 2024 and 13.4% in 2025. Bonds also pay far more now: the 10-year Treasury yielded 1.52% at the end of 2021 and 4.96% on 22 October 2026.
Which ETFs make a 60/40 portfolio?
Two funds do it: VOO and BND, or VTI and AGG, each at 0.03% a year. VT and BNDW make it global for about 0.06%. If you'd rather hold one fund, VBIAX, Vanguard LifeStrategy 60/40 (VSMGX) and iShares AOR keep the split for you. In Europe, Vanguard's LifeStrategy 60% Equity UCITS ETF does the same.
How often should you rebalance a 60/40 portfolio?
Once a year is enough for most people, and it is what the test here does. The stock half rarely ends a year more than 6 points away from 60%: 2021 ended at 66.6%. Crashes are the exception. In 2008 it ended at 47.8%, and the January rebalance put money back into stocks after the fall.
Is 70/30 or 80/20 better than 60/40?
They grew more and fell further. From 1987 to 2026, 80/20 made 10.2% a year against 9.0%, and its worst fall was 45.3% against 34.2%. 50/50 made 8.4% and fell 28.1%. Above 40% in stocks, each 10 more points added about half a point a year and 5 to 6 points to the worst fall.
Other portfolios and tools
Sources and how the numbers were worked out
- Vanguard, Vanguard 500 Index Fund Investor Shares (VFINX) fact sheet and the Total Bond Market Index Fund Investor Shares (VBMFX), the two funds in the test.
- Fund fees from the issuers, checked 24 October 2026: Vanguard (VOO, BND, VTI, VT, BNDW, VBIAX, VSMGX, LifeStrategy 60% Equity, VWCE, VAGF) and iShares (AGG, AOR).
- iShares, prospectus of the iShares Core 60/40 Balanced Allocation ETF (AOR), for its fee waiver and target split.
- Federal Reserve Bank of St. Louis, FRED, 10-year Treasury constant maturity rate (DGS10), for the 1.52% and 4.96% yields.
- IRS, Topic 403, Interest received, for how bond interest is taxed.
The test uses daily closing prices in US dollars with dividends and interest reinvested, before tax and with no trading costs; fund fees are already in the prices. Stocks are the Vanguard 500 Index Fund Investor Shares (VFINX) and bonds the Vanguard Total Bond Market Index Fund Investor Shares (VBMFX), which began in December 1986; its August 2025 distribution, missing from the daily price data, is added back so its 2025 return matches Vanguard's published 7.03%. $10,000 goes in at the close on 31 December 1986 and each split is rebalanced to its weights on the first trading day of every year, to the close on 23 October 2026. Worst fall is the largest drop from a previous high in daily values; the worst 10 years is the lowest yearly return over any ten years ending at a month end. The 2026 rebalancing example and the buy list use VOO and BND. The comparison with the three-fund portfolio, Golden Butterfly and All Weather uses the shorter 2019 to 2026 test from the portfolio examples page, where the 60/40 is SPY and AGG. Past returns don't tell you future ones, and none of this is a recommendation to buy a particular fund.