Model portfolio, tested on real prices

Ray Dalio's All Weather Portfolio: ETFs and Returns

The All Weather portfolio is the version of Ray Dalio's idea that he gave Tony Robbins in 2014: 30% stocks, 40% long-term Treasuries, 15% intermediate Treasuries, 7.5% gold and 7.5% commodities. Most of the money sits in bonds because stocks swing so much harder. That way each kind of economy has something in the mix that does well.

Built with five ETFs, $10,000 at the end of 2006 grew to $35,351 by 23 October 2026, 6.6% a year. In 2008, when the S&P 500 lost 36.8%, it made 3.0%. Its worst fall was 23.7%, in 2022, when stocks and bonds dropped together.

$10,000 became$35,351end of 2006 to 23 Oct 2026, dividends reinvested
A year6.6%60/40: 8.0%. S&P 500: 10.8%
Worst fall23.7%60/40: 34.0%. S&P 500: 55.2%
In 2008+3.0%S&P 500: −36.8%. Long Treasuries rose 34.0%

All Weather portfolio returns since 2007

Five ETFs at 30 / 40 / 15 / 7.5 / 7.5, rebalanced every January, against a 60/40 of S&P 500 and US bonds and the S&P 500 on its own.

  • All Weather
  • 60/40
  • S&P 500

Month-end values. Move along the chart to read any month.

Dec 2006 to Oct 2026$10,000 becameA yearWorst fallWorst yearYears with a lossLongest below its high
All Weather$35,3516.6%−23.7%−19.2% (2022)3 of 193 yrs 9 mos (2021 to 2025)
60/40$46,2048.0%−34.0%−19.1% (2008)3 of 193 yrs 1 mo (2007 to 2010)
S&P 500$76,92110.8%−55.2%−36.8% (2008)3 of 194 yrs 10 mos (2007 to 2012)

Year by year

Calendar-year returns with dividends reinvested. 2026 runs to 23 October.

  • All Weather
  • S&P 500

The four seasons behind the mix

Dalio sorts every economy by two questions: is growth beating expectations or falling short, and is inflation? Each slice is there for one or two of the four answers.

Growth beats expectationsProfits rise, money is easy
StocksCommodities

2009: stocks +28.9%, commodities +16.2%

Growth falls shortA recession or a scare
Long TreasuriesIntermediate Treasuries

2008: long Treasuries +34.0%, intermediate +17.9%

Inflation beats expectationsPrices rise faster than planned
GoldCommodities

Commodities +41.4% in 2021 and +19.3% in 2022

Inflation falls shortPrices calm, rates come down
StocksLong TreasuriesIntermediate Treasuries

2014: long Treasuries +27.3%, stocks +12.5%

Bridgewater's own All Weather fund, started in 1996 with Dalio's family trust, gives each season the same share of risk. Stocks swing about three times as hard as intermediate Treasuries, so an equal share of risk means a much bigger share of money in bonds.

The fund borrows to get there, so its bonds can carry as much risk as its stocks without the whole thing earning bond returns. The 30 / 40 / 15 / 7.5 / 7.5 mix does it without borrowing. That makes it easier to hold and to explain, but it earned less than a 60/40 in 13 of the 19 years tested.

Gold and commodities are the inflation slices. They are only 15% of the money, but they swing nearly as hard as stocks, so they carry 12% of the risk.

Why it falls less: the slices take turns

Each slice's own return, year by year. When stocks had a bad year, Treasuries or gold usually had a good one. 2022 is the year that rule broke.

Returns in %, rounded. *2026 to 23 October.

2008: Treasuries paid for the crash

US stocks lost 37.0% and commodities 31.8%. Long Treasuries gained 34.0% and intermediate ones 17.9%, so the whole portfolio made 3.0%. At its worst that year it was 14.6% below its high.

2014 and 2015: commodities kept falling

Commodities lost 28.1% and then 27.6% as oil collapsed. Long Treasuries carried 2014 to a 13.6% gain, but in 2015 the portfolio lost 3.2%.

2022: stocks and bonds fell together

Rates rose fast. Long Treasuries lost 31.2%, stocks 19.5% and intermediate Treasuries 15.2%. Commodities gained 19.3%, but at 7.5% of the money they could only soften it. The portfolio lost 19.2%.

The All Weather ETF (ALLW) or five ETFs

Since March 2025 you can buy Bridgewater's approach in one fund. Here is how it differs from the five-fund version and how both did over the same months.

Five ETFs, Robbins's mixVTI, TLT, IEF, GLD and DBC, the test on this page

  • US stocks 30%
  • Long-term Treasuries 40%
  • Intermediate Treasuries 15%
  • Gold 7.5%
  • Commodities 7.5%
Since ALLW began
+16.8%6 Mar 2025 to 23 Oct 2026
Worst fall
−6.2%
Borrowing
None$1 invested is $1 of funds
Fee
0.18% a year$18 on $10,000; 0.05% with the swaps below
Rebalancing
You do itOnce a year is enough

State Street Bridgewater All Weather ETFALLW, run with Bridgewater, trading since March 2025

  • Government bonds 70.7%
  • Inflation-linked bonds 36.5%
  • Stocks 43.6%
  • Commodities 23.1%
  • Gold 9.6%

What it held on 30 Sep 2026, adding up to 183.5% of the fund.

Since it began
+21.7%6 Mar 2025 to 23 Oct 2026
Worst fall
−8.8%
Borrowing
Yes, about 1.8 times$1 invested held $1.84 of bonds, stocks and commodities on 30 Sep 2026
Fee
0.85% a year$85 on $10,000
Rebalancing
Done for youBridgewater sends a daily model; State Street trades it

ALLW is the closer copy of Bridgewater's own fund. It holds bonds and stocks from around the world, inflation-linked bonds, commodities and gold, and uses futures and swaps to hold more than it has in cash, so its bonds can carry as much risk as its stocks. Its first 19 months beat the five ETFs, 21.7% against 16.8%, with a deeper worst fall, 8.8% against 6.2%. The S&P 500 made 35.3% over the same months.

The five ETFs cost about a fifth as much and you can see every holding. ALLW is one fund that does the borrowing and the trading for you. Nineteen months is far too short to say which is better.

All Weather portfolio ETFs for each slice

The funds used in the test, a lower-cost swap for each, and a European version if you buy in Europe. Fees checked 25 October 2026.

SliceETF used hereLower-cost swapIf you buy in Europe
US stocks 30%For growth that beats expectations
VTIVanguard Morningstar Total Stock Market ETF0.03% a year
VTI is already one of the cheapest funds there is.
CSPXiShares Core S&P 500 UCITS ETF (Acc), IE00B5BMR0870.07% a year
Long-term Treasuries 40%For growth and inflation that fall short
TLTiShares 20+ Year Treasury Bond ETF0.15% a year
VGLTVanguard Long-Term Treasury ETF, 10+ years0.03% a year
IDTL or DTLAiShares $ Treasury Bond 20+yr UCITS ETF, Dist or Acc0.07% a year
Intermediate Treasuries 15%The same job as long bonds, with smaller swings
IEFiShares 7-10 Year Treasury Bond ETF0.15% a year
VGITVanguard Intermediate-Term Treasury ETF, 3 to 10 years0.03% a year
IBTMiShares $ Treasury Bond 7-10yr UCITS ETF (Dist), IE00B1FZS7980.07% a year
Gold 7.5%For inflation that beats expectations
GLDSPDR Gold Shares0.40% a year
GLDMSPDR Gold MiniShares0.10% a year
SGLNiShares Physical Gold ETC, IE00B4ND36020.12% a year
Commodities 7.5%For inflation, and for growth that runs hot
DBCInvesco DB Commodity Index Tracking Fund0.82% a year
BCIabrdn Bloomberg All Commodity Strategy K-1 Free ETF0.26% a year
ICOMiShares Diversified Commodity Swap UCITS ETF (Acc), IE00BDFL4P120.19% a year
Weighted fee of the five used here: 0.18% a year, or $18 on $10,000.With the swaps: 0.05%.

US stocks, 30%

Used here
VTI, 0.03%Vanguard Morningstar Total Stock Market ETF
Swap
VTI is already one of the cheapest funds there is.
In Europe
CSPX, 0.07%iShares Core S&P 500 UCITS ETF (Acc), IE00B5BMR087

Long-term Treasuries, 40%

Used here
TLT, 0.15%iShares 20+ Year Treasury Bond ETF
Swap
VGLT, 0.03%Vanguard Long-Term Treasury ETF, 10+ years
In Europe
IDTL or DTLA, 0.07%iShares $ Treasury Bond 20+yr UCITS ETF, Dist or Acc

Intermediate Treasuries, 15%

Used here
IEF, 0.15%iShares 7-10 Year Treasury Bond ETF
Swap
VGIT, 0.03%Vanguard Intermediate-Term Treasury ETF, 3 to 10 years
In Europe
IBTM, 0.07%iShares $ Treasury Bond 7-10yr UCITS ETF (Dist), IE00B1FZS798

Gold, 7.5%

Used here
GLD, 0.40%SPDR Gold Shares
Swap
GLDM, 0.10%SPDR Gold MiniShares
In Europe
SGLN, 0.12%iShares Physical Gold ETC, IE00B4ND3602

Commodities, 7.5%

Used here
DBC, 0.82%Invesco DB Commodity Index Tracking Fund
Swap
BCI, 0.26%abrdn Bloomberg All Commodity Strategy K-1 Free ETF
In Europe
ICOM, 0.19%iShares Diversified Commodity Swap UCITS ETF (Acc), IE00BDFL4P12

Weighted fee of the five used here: 0.18% a year, $18 on $10,000. With the swaps: 0.05%.

Robbins named 7 to 10 year Treasuries for the 15% slice, which is what IEF holds. VGIT reaches down to 3 years, so it swings a little less. DBC sends US holders a Schedule K-1 at tax time; BCI and PDBC (0.59%) are built to send a 1099 instead.

In Europe, the Treasury funds are in US dollars, so a euro or pound investor also takes the exchange rate. SGLN is an exchange-traded commodity rather than a UCITS fund, and CSPX holds the S&P 500 rather than the whole US market.

What your money buys

Whole shares of each ETF at the 23 October 2026 close. With fractional shares you can split any amount exactly.

Each slice gets its share of the amount. Gold and commodities are only 7.5% each, so below about $5,000 a whole GLD share takes more than its slice; GLDM or fractional shares fix that.

ETFPriceSharesCost
Total
Cash left over

How often to rebalance the All Weather portfolio

Robbins's advice was at least once a year. Here is what yearly, quarterly and never did with the same five funds and the same $10,000 from the end of 2006.

Every January
Became$35,351
A year6.6%
Worst fall−23.7%
Stocks now31.9%

One rebalance a year puts all five back on target.

Every quarter
Became$36,478
A year6.7%
Worst fall−24.3%
Stocks now29.2%

Four times the rebalancing for about 0.2 points a year more, and every rebalance means selling something.

Never
Became$37,952
A year7.0%
Worst fall−25.5%
Stocks now59.9%

Made the most because stocks were left to grow, but it's 60% stocks now. That isn't an All Weather portfolio any more.

$10,000 split on 2 January 2026 was worth $10,522 by 23 October. Commodities jumped 52.3% and grew from 7.5% to 10.9% of the portfolio, while gold slipped to 6.6%. Type in what you hold today.

SliceNowTargetTrade
Total

New money can fill the slices below target without selling anything. In a taxable account that saves you realising a gain.

Tracking it across accounts

Five slices, five targets, and where new money should go

AllInvestView holds each slice against its target from current prices, even when the ETFs sit at different brokers or in an IRA and a taxable account. When you add money it splits the deposit so the slices furthest below target get the most, or lists the sells if you would rather trade back to target now, with the estimated tax on each sell from your own capital gains rules. Five ETFs fit easily in the free plan's ten holdings.

Read the rebalancing guide
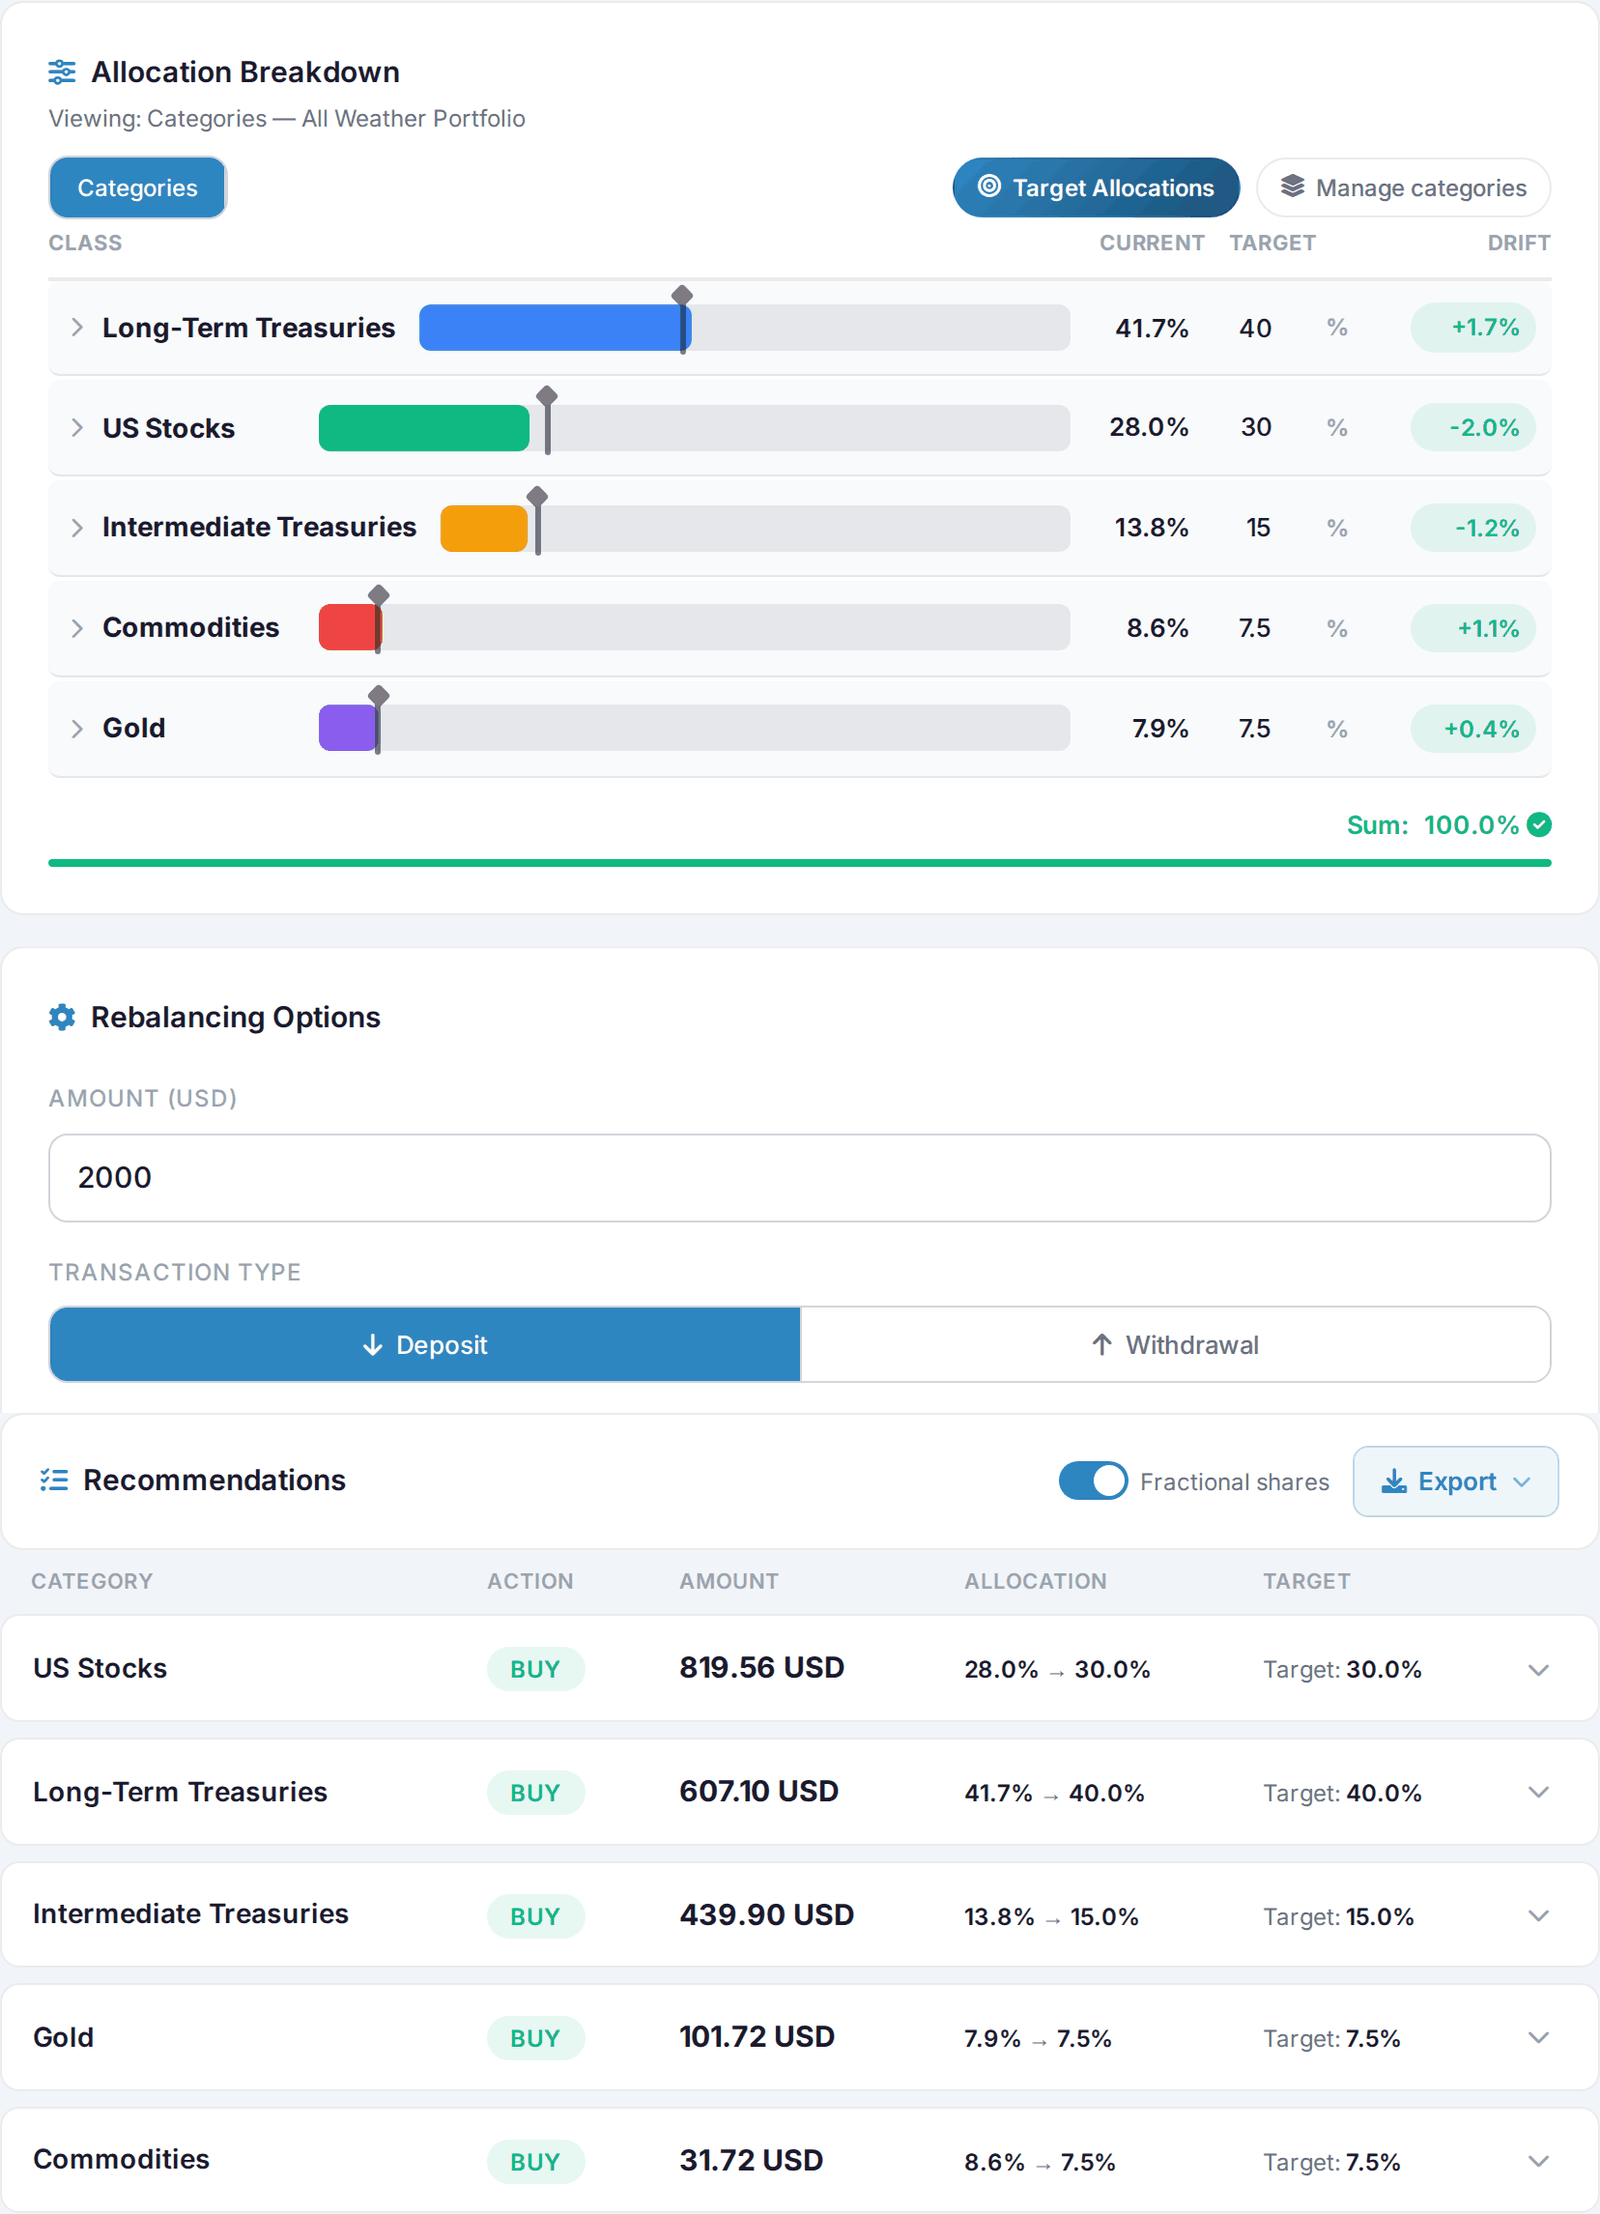
AllInvestView AllInvestView rebalancing an All Weather portfolio with targets of 40, 30, 15, 7.5 and 7.5: long-term treasuries at 41.7%, US stocks 28.0%, intermediate treasuries 13.8%, commodities 8.6% and gold 7.9%. A 2,000 USD deposit is split into buys of 819.56 USD of US stocks, 607.10 USD of long-term treasuries, 439.90 USD of intermediate treasuries, 101.72 USD of gold and 31.72 USD of commodities, bringing each slice to its target AllInvestView rebalancing an All Weather portfolio with targets of 40, 30, 15, 7.5 and 7.5: long-term treasuries at 41.7%, US stocks 28.0%, intermediate treasuries 13.8%, commodities 8.6% and gold 7.9%. A 2,000 USD deposit is split into buys of 819.56 USD of US stocks, 607.10 USD of long-term treasuries, 439.90 USD of intermediate treasuries, 101.72 USD of gold and 31.72 USD of commodities, bringing each slice to its target
The rebalancing page on a demo All Weather portfolio of five ETFs with 30 / 40 / 15 / 7.5 / 7.5 targets: the drift on each slice, then a 2,000 USD deposit split so every slice lands on its target without selling anything. Demo portfolio on sample prices; three cards of the same page stacked into one image.View full-size View full-size

All Weather vs Permanent Portfolio, Golden Butterfly and 60/40

The same test for all four: $10,000 on 2 January 2019 to 22 October 2026, rebalanced every January.

Since 2019 the All Weather made the least of the four and had the deepest fall, because 2022 hit long bonds hardest. It also lost the least from 19 February to 23 March 2020.

What the All Weather portfolio gives up

What you trade for the calmer ride.

It lags when stocks boom

With 30% in stocks, it trailed the S&P 500 in 14 of the 19 full years since 2007 and beat a 60/40 in only 6. Over the whole run: $35,351 against $46,204 for the 60/40 and $76,921 for the S&P 500.

It leans on falling interest rates

Long Treasuries are 40% of the money and 43% of the risk. They did well while rates fell from 2007 to 2020, then lost 31.2% in 2022. The portfolio took 3 years and 9 months to get back to its November 2021 high, longer than the 60/40 needed after 2008.

Commodities are a rough ride

DBC lost 76% from its July 2008 peak to April 2020, then gained 41.4% in 2021 and 52.5% so far in 2026. It is also the most expensive fund here and sends a K-1. Gold held in GLD in a US taxable account is taxed as a collectible, at up to 28% after a year.

It isn't Bridgewater's fund

Bridgewater's All Weather borrows so its bonds carry as much risk as its stocks. This version doesn't borrow. That keeps it simple and free of margin calls, and it's why so much of the money has to sit in bonds.

After you buy it

Track your All Weather portfolio in one place

Sync or import your brokers and AllInvestView shows the five slices against their targets, the return of the whole portfolio, the dividends and interest, and the tax when you sell.

Targets and drift for each slice Every broker in one view Free for up to 10 holdings

Questions about the All Weather portfolio

What is the All Weather portfolio?

A simple version of Ray Dalio's All Weather strategy, which he gave Tony Robbins for his 2014 book Money: Master the Game: 30% stocks, 40% long-term Treasuries, 15% intermediate Treasuries, 7.5% gold and 7.5% commodities. It is built so that rising or falling growth and rising or falling inflation each have something in the portfolio that does well.

Which ETFs make up the All Weather portfolio?

The usual US picks are VTI for stocks, TLT for long-term Treasuries, IEF for 7 to 10 year Treasuries, GLD for gold and DBC for commodities, with a weighted fee of about 0.18% a year. VGLT, VGIT, GLDM and BCI bring that down to about 0.05%. In Europe, CSPX, IDTL or DTLA, IBTM, SGLN and ICOM cover the five slices.

What has the All Weather portfolio returned?

With those five ETFs, $10,000 at the end of 2006 was worth $35,351 on 23 October 2026, 6.6% a year with dividends reinvested and a rebalance every January. It lost money in 3 of the 19 full years. The worst was 2022, down 19.2%, and the deepest fall from a high was 23.7%, from November 2021 to October 2022.

How did the All Weather portfolio do in 2008 and 2022?

In 2008 it gained 3.0% while the S&P 500 lost 36.8%, because long Treasuries rose 34.0%. In 2022 it lost 19.2%, more than a 60/40, which lost 16.0%: rates rose fast, so its large Treasury slices fell together with stocks.

Is ALLW the same as the All Weather portfolio?

No. ALLW, the State Street Bridgewater All Weather ETF, follows Bridgewater's institutional approach: global bonds and stocks, inflation-linked bonds, commodities and gold, with futures and swaps that took its holdings to about 1.8 times its assets in September 2026. It costs 0.85% a year. The five ETF version holds only US funds, does not borrow and costs about 0.18%.

How often should you rebalance the All Weather portfolio?

Once a year is enough. From 2007 to 2026, rebalancing every quarter earned 6.7% a year against 6.6% for once a year, with four times the trades. Never rebalancing earned 7.0%, but by 2026 the portfolio was 60% stocks, so it no longer had the mix that made it fall less.

All Weather or Permanent Portfolio?

Both spread money across stocks, bonds and gold. The Permanent Portfolio puts 25% each in stocks, long Treasuries, gold and cash, and fell less in 2022 because of its cash. From January 2019 to October 2026 it earned 8.6% a year against 6.8% for the All Weather, with a worst fall of 17.6% against 23.7%.

Sources and how the numbers were worked out

The test uses daily closing prices in US dollars with dividends and interest reinvested, before tax and with no trading costs; fund fees are already in the prices. $10,000 goes in at the close on 29 December 2006, the first year end when all five ETFs were trading (DBC began in February 2006), and each portfolio is rebalanced to its weights on the first trading day of every year. The 60/40 is 60% SPY and 40% AGG; the S&P 500 is SPY. Worst fall is the largest drop from a previous high in daily values. A slice's share of risk is its contribution to the volatility of the portfolio's daily returns from January 2007 to October 2026, at the target weights. The ALLW comparison runs from the fund's first close to 23 October 2026, with the five ETFs bought on the same day and not rebalanced in between except in January 2026. The comparison with the Permanent Portfolio and Golden Butterfly uses the shorter 2019 to 2026 test from the portfolio examples page, with the funds listed on each page. Past returns don't tell you future ones, and none of this is a recommendation to buy a particular fund.