Model portfolio, tested on real prices

Harry Browne's Permanent Portfolio: ETFs and Returns

Harry Browne's Permanent Portfolio puts 25% each into stocks, long-term government bonds, gold and cash, one for each kind of economy. You don't guess which one comes next. You put the four back to 25% when they drift.

Built with four ETFs, $10,000 at the end of 2004 grew to $45,161 by 23 October 2026, 7.2% a year. It never fell more than 17.6%, and in 2008, when the S&P 500 lost 36.8%, it made 1.1%.

$10,000 became$45,161end of 2004 to 23 Oct 2026, dividends reinvested
A year7.2%60/40: 8.0%. S&P 500: 10.8%
Worst fall17.6%60/40: 34.0%. S&P 500: 55.2%
In 2008+1.1%S&P 500: −36.8%. Long Treasuries rose 34.0%

Permanent Portfolio returns since 2005

Four ETFs at 25% each, rebalanced every January, against the Permanent Portfolio Fund (PRPFX), a 60/40 of S&P 500 and US bonds, and the S&P 500 on its own.

  • Permanent Portfolio
  • PRPFX fund
  • 60/40
  • S&P 500

Month-end values. Move along the chart to read any month.

Dec 2004 to Oct 2026$10,000 becameA yearWorst fallWorst yearYears with a lossLongest below its high
Permanent Portfolio$45,1617.2%−17.6%−12.6% (2022)4 of 212 yrs 4 mos (2021 to 2024)
PRPFX fund$52,3977.9%−27.2%−8.4% (2008)6 of 212 yrs (2014 to 2016)
60/40$53,2538.0%−34.0%−19.1% (2008)3 of 213 yrs 1 mo (2007 to 2010)
S&P 500$93,41210.8%−55.2%−36.8% (2008)3 of 214 yrs 10 mos (2007 to 2012)

Year by year

Calendar-year returns with dividends reinvested. 2026 runs to 23 October.

  • Permanent Portfolio
  • S&P 500

Why it falls less: one slice carries the others

Each slice's own return, year by year. When stocks had a bad year, long bonds or gold usually had a good one.

Returns in %, rounded. Cash before 2007 is the 3-month Treasury bill rate. *2026 to 23 October.

2008: the bonds paid for the crash

US stocks lost 37.0%. Long Treasuries gained 34.0%, gold 4.9% and cash 2.8%, so the whole portfolio made 1.1%.

2013: gold and bonds dragged

Stocks gained 33.4%, but gold fell 28.3% and long Treasuries 13.4%. The portfolio lost 2.2% while the S&P 500 made 32.3%.

2022: rates rose and bonds broke

Long Treasuries lost 31.2% and stocks 19.5%. Gold held at −0.8% and cash made 0.9%. The portfolio lost 12.6% and was back at its high in March 2024.

The Permanent Portfolio Fund (PRPFX) or four ETFs

PRPFX borrows the name but not the recipe. Here is what each holds, what it costs and how it did over the same years.

Four ETFs, 25% eachVTI, TLT, GLD and SHV, the test on this page

  • US stocks 25%
  • Long-term Treasuries 25%
  • Gold 25%
  • Cash 25%
$10,000 became
$45,1617.2% a year, end of 2004 to 23 Oct 2026
Worst fall
−17.6%Nov 2021 to Oct 2022. In 2008: −14.4%
Feb to Mar 2020
−5.9%
Fee
0.18% a year$18.25 on $10,000; 0.06% with the swaps below
Rebalancing
You do itOnce a year, or when a slice leaves 15% to 35%

Permanent Portfolio FundPRPFX, Class I, a mutual fund since 1982

  • Gold 20%
  • Silver 5%
  • Swiss franc assets 10%
  • Real estate and natural resource stocks 15%
  • Aggressive growth stocks 15%
  • Dollar assets 35%
$10,000 became
$52,3977.9% a year, same dates
Worst fall
−27.2%May to Nov 2008
Feb to Mar 2020
−20.0%
Fee
0.79% a year$79 on $10,000; $1,000 minimum to open an account
Rebalancing
Done for youWhen a part drifts by more than a quarter of its target

The fund made more because 30% of it sits in growth, property and mining stocks, plus 5% in silver. Those ran hard in 2009, 2010 and 2025, when PRPFX made 19.1%, 19.3% and 28.8%. They are also why it fell 27.2% in 2008, while the four ETFs never fell more than 14.4% that year. The four ETFs stay closer to Browne's calm ride. PRPFX is the easy option if you want one fund that does the trading for you, at about four times the cost.

Permanent Portfolio ETFs for each slice

The funds used in the test, a lower-cost swap for each, and a European version if you buy in Europe. Fees checked 24 October 2026.

Slice (25% each)ETF used hereLower-cost swapIf you buy in Europe
US stocksProsperity: grows when the economy grows
VTIVanguard Morningstar Total Stock Market ETF0.03% a year
VTI is already one of the cheapest funds there is.
CSPXiShares Core S&P 500 UCITS ETF (Acc), IE00B5BMR0870.07% a year
Long-term TreasuriesDeflation: rises when rates and prices fall
TLTiShares 20+ Year Treasury Bond ETF0.15% a year
VGLTVanguard Long-Term Treasury ETF0.03% a year
IDTL or DTLAiShares $ Treasury Bond 20+yr UCITS ETF, Dist or Acc0.07% a year
GoldInflation: holds its value when money loses it
GLDSPDR Gold Shares0.40% a year
GLDMSPDR Gold MiniShares0.10% a year
SGLNiShares Physical Gold ETC, IE00B4ND36020.12% a year
CashRecession: steady when money is tight
SHViShares 0-1 Year Treasury Bond ETF0.15% a year
SGOViShares 0-3 Month Treasury Bond ETF0.09% a year
IB01iShares $ Treasury Bond 0-1yr UCITS ETF (Acc), IE00BGSF1X880.07% a year
Average fee of the four used here: 0.18% a year, or $18.25 on $10,000.With the swaps: 0.06%.

US stocks

Used here
VTI, 0.03%Vanguard Morningstar Total Stock Market ETF
Swap
VTI is already one of the cheapest funds there is.
In Europe
CSPX, 0.07%iShares Core S&P 500 UCITS ETF (Acc), IE00B5BMR087

Long-term Treasuries

Used here
TLT, 0.15%iShares 20+ Year Treasury Bond ETF
Swap
VGLT, 0.03%Vanguard Long-Term Treasury ETF
In Europe
IDTL or DTLA, 0.07%iShares $ Treasury Bond 20+yr UCITS ETF, Dist or Acc

Gold

Used here
GLD, 0.40%SPDR Gold Shares
Swap
GLDM, 0.10%SPDR Gold MiniShares
In Europe
SGLN, 0.12%iShares Physical Gold ETC, IE00B4ND3602

Cash

Used here
SHV, 0.15%iShares 0-1 Year Treasury Bond ETF
Swap
SGOV, 0.09%iShares 0-3 Month Treasury Bond ETF
In Europe
IB01, 0.07%iShares $ Treasury Bond 0-1yr UCITS ETF (Acc), IE00BGSF1X88

Average fee of the four used here: 0.18% a year, $18.25 on $10,000. With the swaps: 0.06%.

Browne's own advice was to hold the bonds and cash of the currency you spend. A euro or pound investor who keeps these US dollar funds also takes the swings in the exchange rate; long-dated government bonds and a money market fund in your own currency do the same two jobs at home.

What your money buys

Whole shares of each ETF at the 23 October 2026 close. With fractional shares you can split any amount exactly.

Each slice gets a quarter of the amount. The cash left over is what whole shares can't use up, and it can sit in the cash slice.

ETFPriceSharesCost
Total
Cash left over

Rebalancing the Permanent Portfolio: every January or Browne's bands

Browne didn't rebalance on a date. He left the portfolio alone until a slice fell below 15% or rose above 35%, then put all four back to 25%.

Every January
Trades22
Became$45,161
A year7.2%
Worst fall−17.6%
15% / 35% bands
Trades7
Became$48,718
A year7.5%
Worst fall−18.2%

Same four funds, same $10,000 from the end of 2004. The bands traded a third as often and came out 0.4 points a year ahead, mostly because they let stocks and gold run further before selling. That is one stretch of history, so pick the rule you'll actually follow.

When the bands fired
  1. Gold rose above 35%
  2. Stocks fell below 15%
  3. Stocks rose above 35%
  4. Stocks rose above 35%
  5. Stocks rose above 35%
  6. Long Treasuries fell below 15%
  7. Gold rose above 35%

$10,000 split evenly on 2 January 2026 was worth $10,087 by 23 October. Stocks had grown to 27.7% and gold had shrunk to 22.8%, both well inside the bands. Type in what you hold today.

SliceNowTargetTrade
Total

New money can fill the slices below 25% without selling anything. In a taxable account that saves you realising a gain.

Tracking it across accounts

Four slices, four targets, and where new money should go

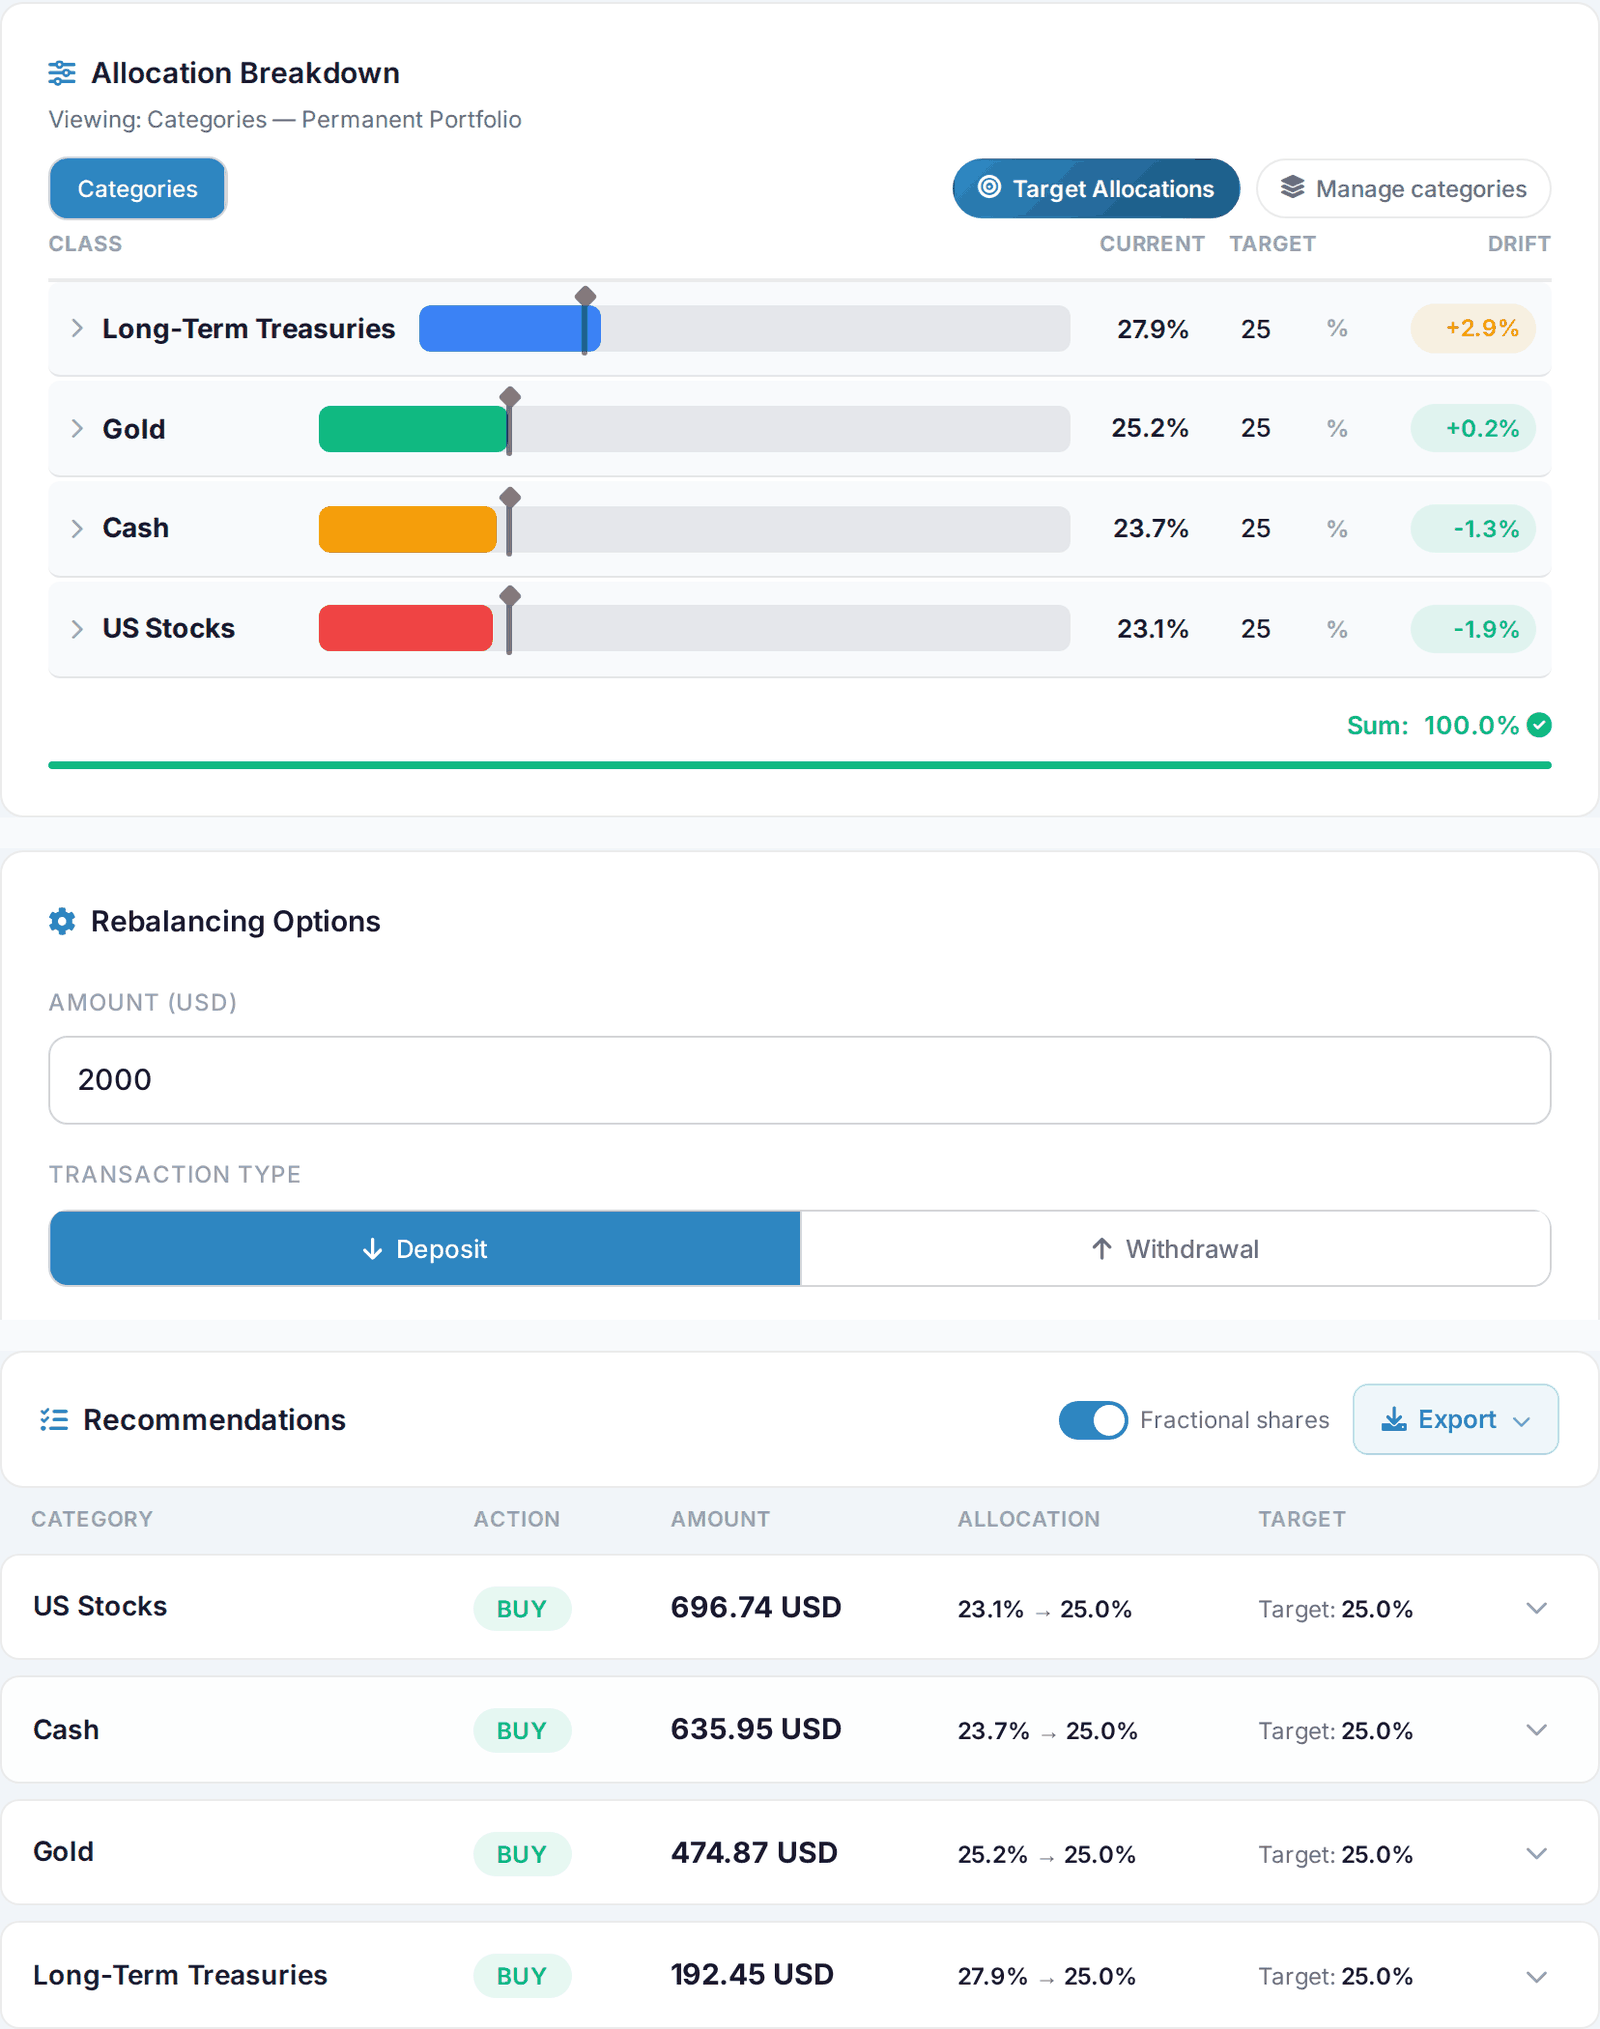
AllInvestView holds each slice against its 25% target from live prices, even when the ETFs sit at different brokers or in an IRA and a taxable account. When you add money it splits the deposit so the slices furthest below target get the most, or lists the sells if you'd rather trade back to 25% now, with the estimated tax on each sell from your own capital gains rules. Four ETFs fit easily in the free plan's ten holdings.

Read the rebalancing guide
AllInvestView AllInvestView rebalancing a Permanent Portfolio with 25% targets: long-term treasuries at 27.9%, gold 25.2%, cash 23.7% and US stocks 23.1%. A 2,000 USD deposit is split into buys of 696.74 USD of US stocks, 635.95 USD of cash, 474.87 USD of gold and 192.45 USD of long-term treasuries, bringing each slice to 25.0% AllInvestView rebalancing a Permanent Portfolio with 25% targets: long-term treasuries at 27.9%, gold 25.2%, cash 23.7% and US stocks 23.1%. A 2,000 USD deposit is split into buys of 696.74 USD of US stocks, 635.95 USD of cash, 474.87 USD of gold and 192.45 USD of long-term treasuries, bringing each slice to 25.0%
The rebalancing page on a demo Permanent Portfolio of VTI, TLT, GLD and SGOV with 25% targets: the drift on each slice, then a 2,000 USD deposit split so every slice lands on 25.0% without selling anything. Demo portfolio on sample prices; three cards of the same page stacked into one image.View full-size View full-size

Permanent Portfolio vs Golden Butterfly, All Weather and 60/40

The same test for all four: $10,000 on 2 January 2019 to 22 October 2026, rebalanced every January.

What the Permanent Portfolio gives up

What you trade for the smaller falls.

It lags when stocks boom

With 25% in stocks, it trailed the S&P 500 in 14 of the 21 full years since 2005. Over the whole run that adds up: $45,161 against $93,412. Browne's goal was to keep what you have through any economy, not to beat the market.

A quarter in cash earns little when rates are low

From 2009 to 2015 the cash slice made 0.2% or less every year. When rates came back it paid again: 5.0% in 2023 and 5.1% in 2024.

Long bonds hurt when rates jump

In 2022 long Treasuries lost 31.2%, and the portfolio spent 2 years and 4 months below its November 2021 high, its longest stretch since 2005. That is still shorter than the 3 years the 60/40 took after 2008.

A quarter in gold means long dry spells

Gold dropped 28.3% in 2013 and kept falling through 2015. Then it gained 24.8% in 2020 and 63.7% in 2025. If you hold GLD in a US taxable account, the IRS taxes its gains as collectibles, at up to 28% after a year.

After you buy it

Track your Permanent Portfolio in one place

Sync or import your brokers and AllInvestView shows the four slices against their 25% targets, the return of the whole portfolio, the dividends and interest, and the tax when you sell.

Targets and drift for each slice Every broker in one view Free for up to 10 holdings

Questions about the Permanent Portfolio

What is the Permanent Portfolio?

Harry Browne's split of a portfolio into four equal parts: 25% in stocks, 25% in long-term government bonds, 25% in gold and 25% in cash. Each part is there for one kind of economy: stocks for prosperity, long bonds for deflation, gold for inflation and cash for a recession. You never guess which one comes next; you just put the four back to 25%.

Which ETFs make up the Permanent Portfolio?

The usual US picks are VTI for stocks, TLT for long-term Treasuries, GLD for gold and SHV for cash, with an average fee of 0.18% a year. VGLT, GLDM and SGOV do the same jobs for less and bring the average down to about 0.06%. In Europe, CSPX, IDTL or DTLA, SGLN and IB01 cover the four slices.

What has the Permanent Portfolio returned?

With those four ETFs, $10,000 at the end of 2004 was worth $45,161 on 23 October 2026, 7.2% a year with dividends reinvested and a rebalance every January. It lost money in 4 of the 21 full years. The worst was 2022, down 12.6%, and the deepest fall from a high was 17.6%, from November 2021 to October 2022.

How did the Permanent Portfolio do in 2008?

It gained 1.1% while the S&P 500 lost 36.8%. Long-term Treasuries rose 34.0%, gold 4.9% and cash 2.8%, which covered the 37.0% fall in US stocks. Its worst stretch that year was a 14.4% fall from March to November.

Is PRPFX the same as the Permanent Portfolio?

No. The Permanent Portfolio Fund (PRPFX) borrows the name but holds six parts: 20% gold, 5% silver, 10% Swiss franc assets, 15% real estate and natural resource stocks, 15% aggressive growth stocks and 35% dollar assets. It costs 0.79% a year. Since 2004 it earned more than the four ETFs, 7.9% a year against 7.2%, but it fell 27.2% in 2008 where the ETFs fell 14.4%.

How often should you rebalance the Permanent Portfolio?

Browne used bands rather than a date: leave it alone until a slice drops below 15% or rises above 35%, then put all four back to 25%. With these funds that happened 7 times from 2005 to 2026. Rebalancing every January instead is simpler and was close: 7.2% a year against 7.5% with the bands.

Permanent Portfolio or Golden Butterfly?

The Golden Butterfly is a variation on it: 20% each in total market stocks, small-cap value, long and short Treasuries and gold, so more in stocks and nothing in cash. From January 2019 to October 2026 it earned 9.3% a year against 8.6%, with a worst fall of 18.8% against 17.6%.

Sources and how the numbers were worked out

The test uses daily closing prices in US dollars with dividends and interest reinvested, before tax and with no trading costs; fund fees are already in the prices. $10,000 goes in at the close on 31 December 2004, the first year end after GLD began trading, and each portfolio is rebalanced to its weights on the first trading day of every year. Cash is SHV from its first day of trading, 11 January 2007, and before that the 3-month Treasury bill rate. PRPFX is the fund's Class I shares with distributions reinvested. The 60/40 is 60% SPY and 40% AGG; the S&P 500 is SPY. Worst fall is the largest drop from a previous high in daily values. The bands version checks the four slices at every close and trades all four back to 25% the first day one is below 15% or above 35%. The comparison with the Golden Butterfly and All Weather uses the shorter 2019 to 2026 test from the portfolio examples page, with the funds listed on each page. Past returns don't tell you future ones, and none of this is a recommendation to buy a particular fund.