Model portfolio, tested on real prices

Aggressive Growth Portfolio: Allocation, Funds and Returns Since 2000

An aggressive growth portfolio puts all or nearly all of its money in stocks and leans toward the ones that grow fastest: large growth companies, small companies and emerging markets. It's for money you won't need for 15 years or more, because it falls the hardest in a crash.

Our example in Vanguard's index funds turned $10,000 at the end of 1999 into $74,588 by 23 October 2026, 7.8% a year. That start came just before the dot-com peak, and the mix came through the 2000s far ahead of the S&P 500. Since 2010 the S&P 500 has been ahead, and over the whole stretch it made 8.2% a year.

$10,000 became$74,588end of 1999 to 23 Oct 2026, dividends reinvested
A year7.8%S&P 500: 8.2%. 60/40: 6.8%
Worst fall56.9%Oct 2007 to Mar 2009. S&P 500: 55.3%
2000 to 2009+25.7%The S&P 500 lost 9.8%

Aggressive growth portfolio returns since 2000

40% Vanguard Growth Index, 20% Small-Cap Index, 20% Developed Markets Index and 20% Emerging Markets Stock Index, rebalanced every January, against the S&P 500 and a 60/40.

  • Aggressive growth
  • S&P 500
  • 60/40

Month-end values (the last one 23 October 2026) on a log scale, so the same percentage gain takes the same height in 2003 as in 2023. Move along the chart to read any month.

Dec 1999 to Oct 2026$10,000 becameA yearWorst fallWorst yearYears with a lossLongest below a highWorst 10 years
Aggressive growth$74,5887.8%−56.9%−41.3% (2008)8 of 265.5 years (2000 to 2005)+1.6% a year
Same, with 20% bonds$65,9097.3%−46.8%−32.2% (2008)8 of 264.7 years (2000 to 2004)+3.1% a year
S&P 500$82,3578.2%−55.3%−37.0% (2008)6 of 266.1 years (2000 to 2006)−1.9% a year
60/40$57,7596.8%−34.2%−20.4% (2008)6 of 264.2 years (2000 to 2004)+1.8% a year

Aggressive portfolio allocation: how much in stocks, and which stocks

The same test for 15 mixes. Down the side, how much is in stocks; the rest is a bond fund. Across the top, what the stocks are. Each cell is the return a year since 2000. Pick one.

What the stocks are
In stocksS&P 500Whole US marketGrowth mix

The stronger the green, the more return a year. ★ marks the 100% growth mix tested above. Each row up adds about five points to the worst fall; switching columns changes it by two points at most.

$10,000 became
A year
Worst fall
Worst year
2022
Back to its 2007 high

Each of the four funds on its own since 2000

FundA yearWorst fall2008
US growthVanguard Growth Index8.3%−57.5%−38.3%
US small capsVanguard Small-Cap Index8.8%−59.8%−36.1%
Developed marketsVanguard Developed Markets Index5.1%−60.6%−41.3%
Emerging marketsVanguard Emerging Markets Stock Index6.5%−66.5%−52.8%
S&P 500Vanguard 500 Index8.2%−55.3%−37.0%

The two US funds did a little better than the S&P 500. The two funds abroad did worse, and they're why the mix ends behind it. On its own each fell between 57% and 67%; together they fell 56.9%.


Decade by decade

2000 to 2009Dot-com bust and 2008
+25.7%
−9.8%
2010 to 2019The US decade
+166.1%
+251.7%
2020 to Oct 2026Covid, rates, AI
+123.0%
+159.7%

Over ten years at a time

69 of 203

Ten-year stretches in which the aggressive mix beat the S&P 500. Every one of them ended between December 2009 and August 2015, so each took in the 2000s. Against a 60/40 it won 174 of 203.

Its worst ten years still made 1.6% a year, to June 2010. The S&P 500's worst ten lost 1.9% a year. Small companies and emerging markets are what kept the mix positive through the 2000s, the decade the S&P 500 went nowhere.

Year by year

Calendar-year returns with dividends reinvested. 2026 runs to 23 October. Years in red are the aggressive mix's losses.

  • Aggressive growth
  • S&P 500
2000 to 2002: small companies held up

The growth fund fell 22.2%, 13.0% and 23.6%. Small caps lost only 2.7% in 2000 and gained 3.1% in 2001. The mix lost 17.7%, 9.5% and 18.1%, then made 38.8% in 2003 against 28.5% for the S&P 500.

2008 and 2009: the deepest fall, the fastest climb

Emerging markets lost 52.8% and then made 76.0%. The mix lost 41.3% and made 42.4%, and was back above its October 2007 high in April 2011, 16 months before the S&P 500.

2022: growth took the hit

The growth fund lost 33.2% as interest rates rose. The mix lost 23.5% against 18.2% for the S&P 500, then made 27.7% in 2023 and 21.4% in 2025, when markets abroad led.

Aggressive growth ETFs and index funds

Every big fund family sells the four pieces, for a few hundredths of a percent a year. Use the set your broker sells without a fee. Fees checked 25 October 2026, blended at 40/20/20/20.

Vanguard ETFs

Used in the buy list

The ETF versions of the four funds in the test. Any US broker sells them.

  • VUGVanguard Morningstar Growth ETF
    40%0.03% a year
  • VBVanguard Morningstar Small-Cap ETF
    20%0.03% a year
  • VEAVanguard FTSE Developed Markets ETF
    20%0.03% a year
  • VWOVanguard FTSE Emerging Markets ETF
    20%0.06% a year
Blended fee 0.04% a year

Vanguard mutual funds

Same funds as the test

Admiral Shares of the same four funds. $3,000 minimum each.

  • VIGAXVanguard Morningstar Growth Index Fund Admiral Shares
    40%0.05% a year
  • VSMAXVanguard Morningstar Small-Cap Index Fund Admiral Shares
    20%0.05% a year
  • VTMGXVanguard Developed Markets Index Fund Admiral Shares
    20%0.05% a year
  • VEMAXVanguard Emerging Markets Stock Index Fund Admiral Shares
    20%0.13% a year
Blended fee 0.07% a year

Fidelity

Index mutual funds with no minimum.

  • FSPGXFidelity Large Cap Growth Index Fund
    40%0.035% a year
  • FSSNXFidelity Small Cap Index Fund
    20%0.025% a year
  • FSPSXFidelity International Index Fund
    20%0.035% a year
  • FPADXFidelity Emerging Markets Index Fund
    20%0.075% a year
Blended fee 0.04% a year

Schwab ETFs

Schwab's own four, at about the same cost as Vanguard's.

  • SCHGSchwab U.S. Large-Cap Growth ETF
    40%0.04% a year
  • SCHASchwab U.S. Small-Cap ETF
    20%0.03% a year
  • SCHFSchwab International Equity ETF
    20%0.03% a year
  • SCHESchwab Emerging Markets Equity ETF
    20%0.06% a year
Blended fee 0.04% a year

One fund that does it for you

FundWhat it holdsFeeGood to know
AOAiShares Core 80/20 Aggressive Allocation ETF
80% stocks from around the world, 20% bonds0.15% a yearAn ETF that keeps its own 80/20.
VASGXVanguard LifeStrategy 80/20 Fund
80% stocks, 20% bonds, in four Vanguard index funds0.10% a yearA mutual fund that rebalances itself. $3,000 minimum.
VSVNXVanguard Target Retirement 2070 Fund
91.5% in stock funds on 30 September 20260.08% a yearStays mostly stocks for decades, then moves toward bonds as 2070 gets closer.

None of these tilts toward growth stocks or small companies the way the four-fund mix does. They're aggressive by holding mostly stocks, which the grid above shows is the part that matters most.

If you buy in Europe

UCITS fundISINFeeGood to know
VWCEVanguard FTSE All-World UCITS ETF (USD) Accumulating
IE00BK5BQT800.19% a yearLarge and mid-sized companies across developed and emerging markets in one ETF.
IUSNiShares MSCI World Small Cap UCITS ETF
IE00BF4RFH310.35% a yearAdds the small companies VWCE leaves out.
EIMIiShares Core MSCI EM IMI UCITS ETF
IE00BKM4GZ660.18% a yearMore emerging markets, small companies included.

What your money buys

Whole shares of VUG, VB, VEA and VWO at the 23 October 2026 close. With fractional shares you can split any amount exactly.

Split: growth / small / developed / emerging
ETFPriceSharesCost
Total
Cash left over

The cash left over is what whole shares can't use up.

How to rebalance an aggressive portfolio

Put each fund back to its weight, by selling what grew or by sending new money to what fell behind.

$10,000 split 40/20/20/20 in VUG, VB, VEA and VWO on 2 January 2026 was worth $10,796 by 23 October: 39.8% growth, 20.5% small caps, 20.4% developed and 19.2% emerging. Type in your own amounts.

$
$
$
$
$
Target
FundNowTargetTrade
Total

What rebalancing did since 2000

Left alone, the same $10,000 would have grown to $71,567 instead of $74,588, and it would have drifted to 47.9% growth, 26.7% small caps, 10.5% developed and 14.9% emerging. Each January sale of the winners bought the laggards, and the laggards took their turn in front.

Which fund goes in which account

Growth funds pay small dividends, so most of their return is taxed only when you sell, which suits a taxable account. The two funds abroad pay foreign tax that a US investor can usually claim as a credit only in a taxable account. A bond fund, if you add one, usually belongs in an IRA or 401(k).

Tracking it across accounts

Your four funds against their targets, with the trades to fix it

AllInvestView adds up your growth, small-cap and international funds from every broker and account, so an aggressive portfolio split across a 401(k), an IRA and a taxable account shows as one, each fund against its target from live prices. Enter what you're adding and it splits the money between the funds, or lists the sells and buys if you allow selling, with the estimated tax on each sell from your own capital gains rules. Four funds fit easily in the free plan's ten holdings.

Read the rebalancing guide
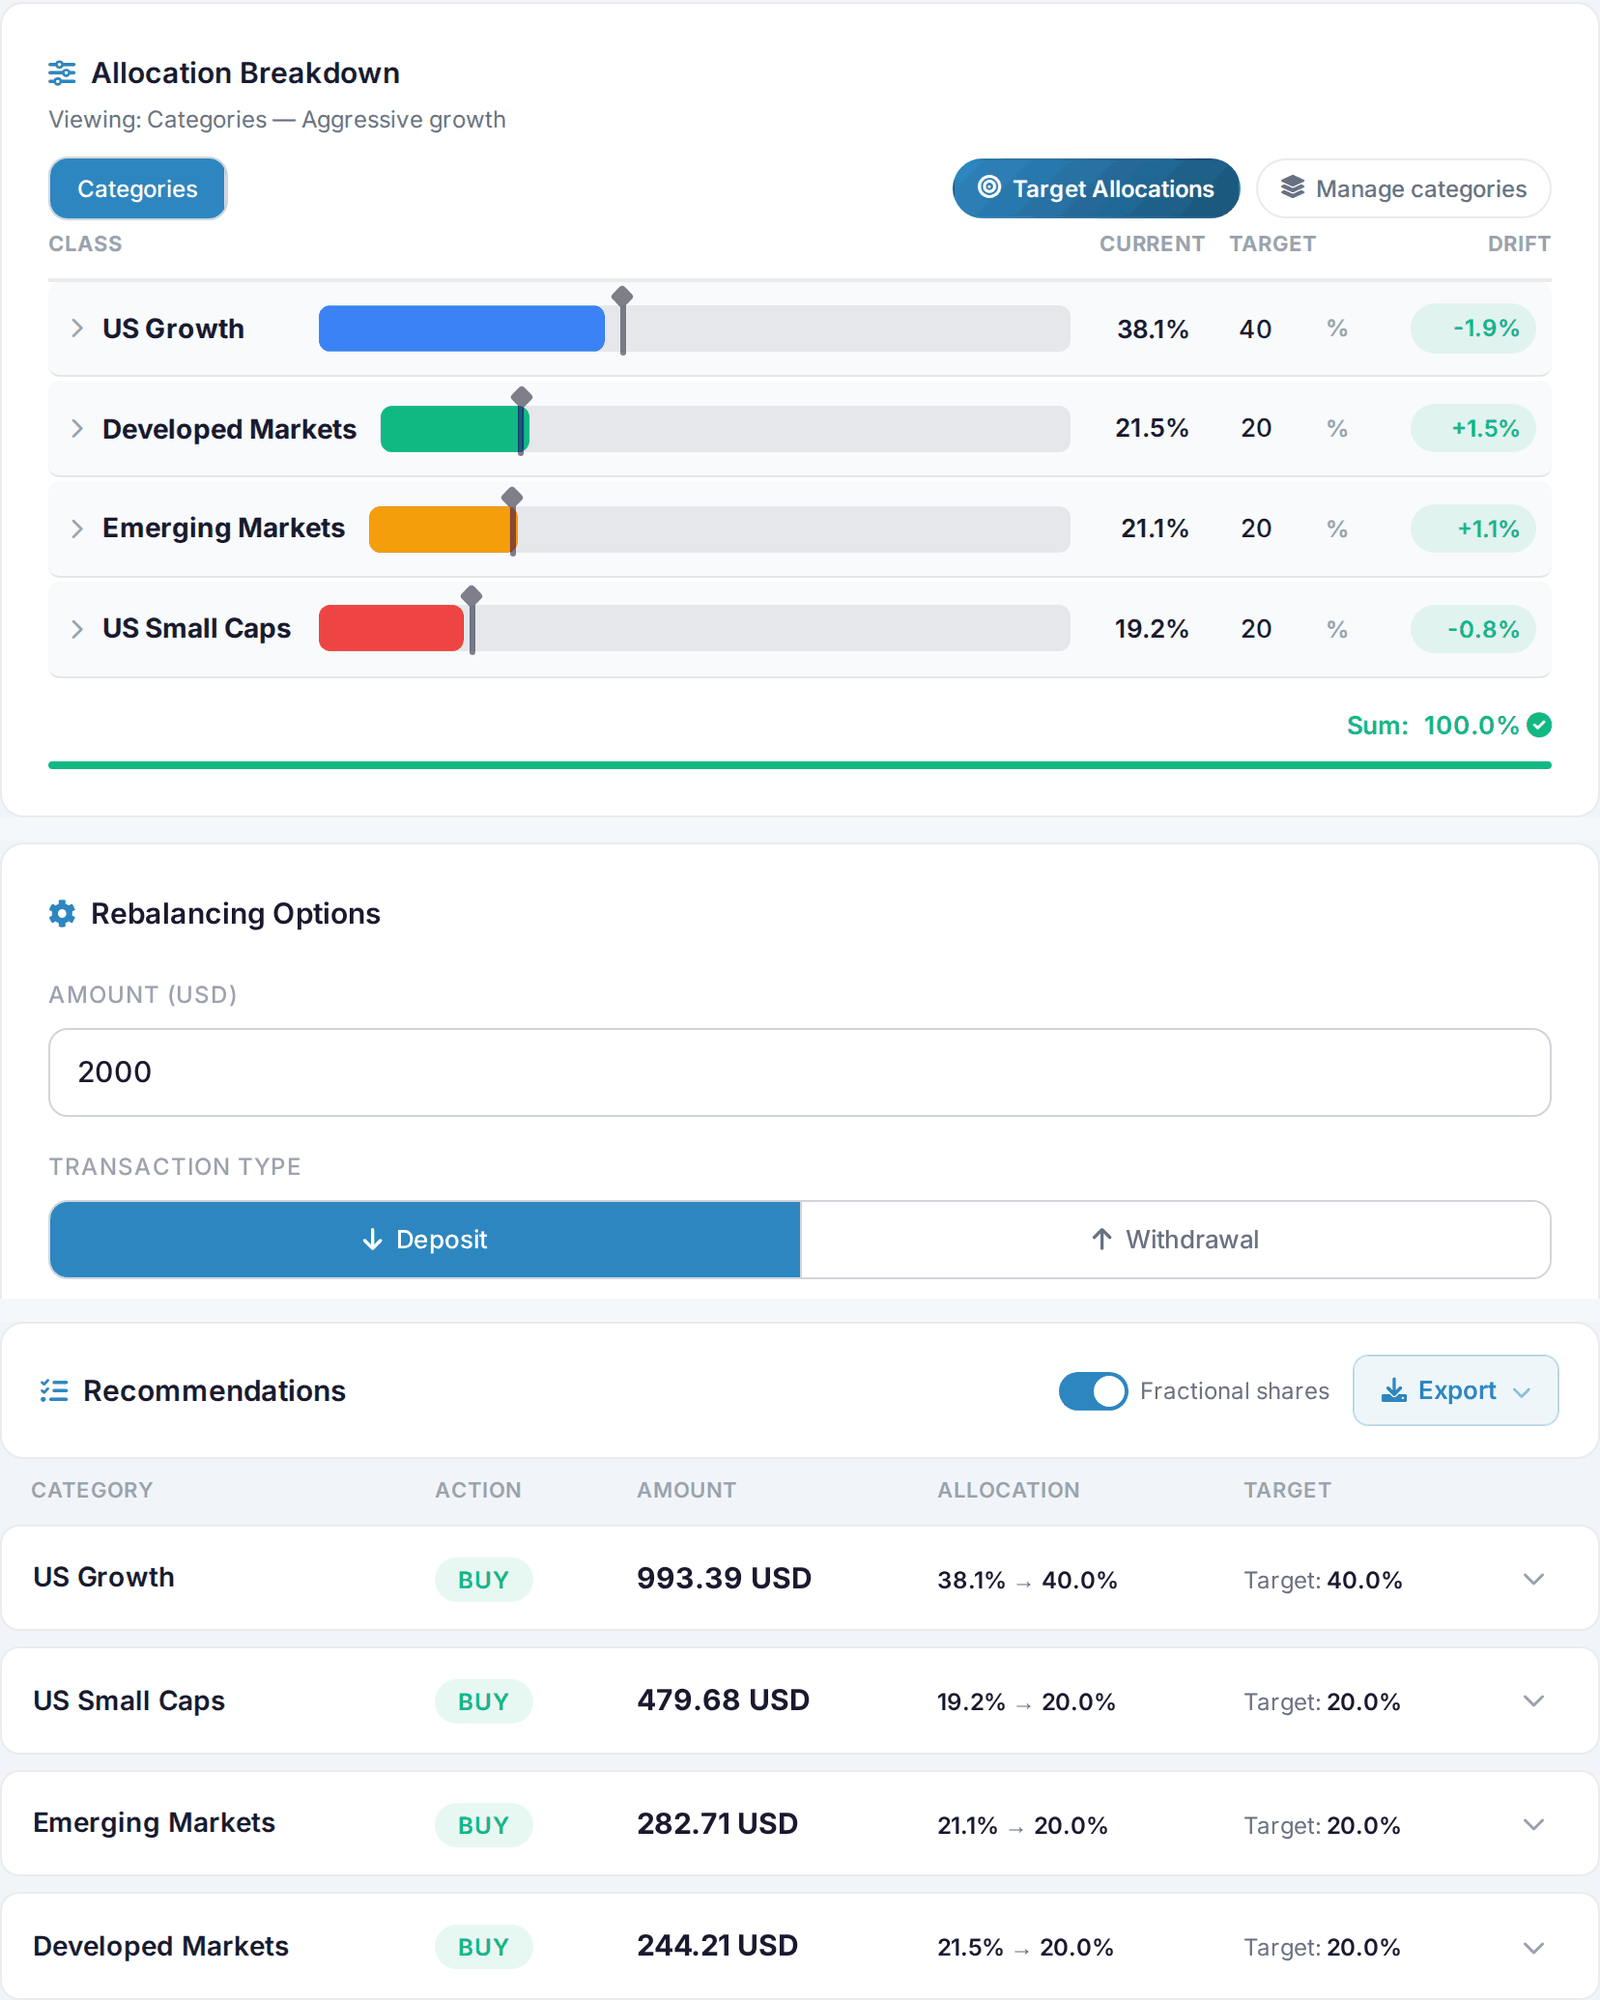
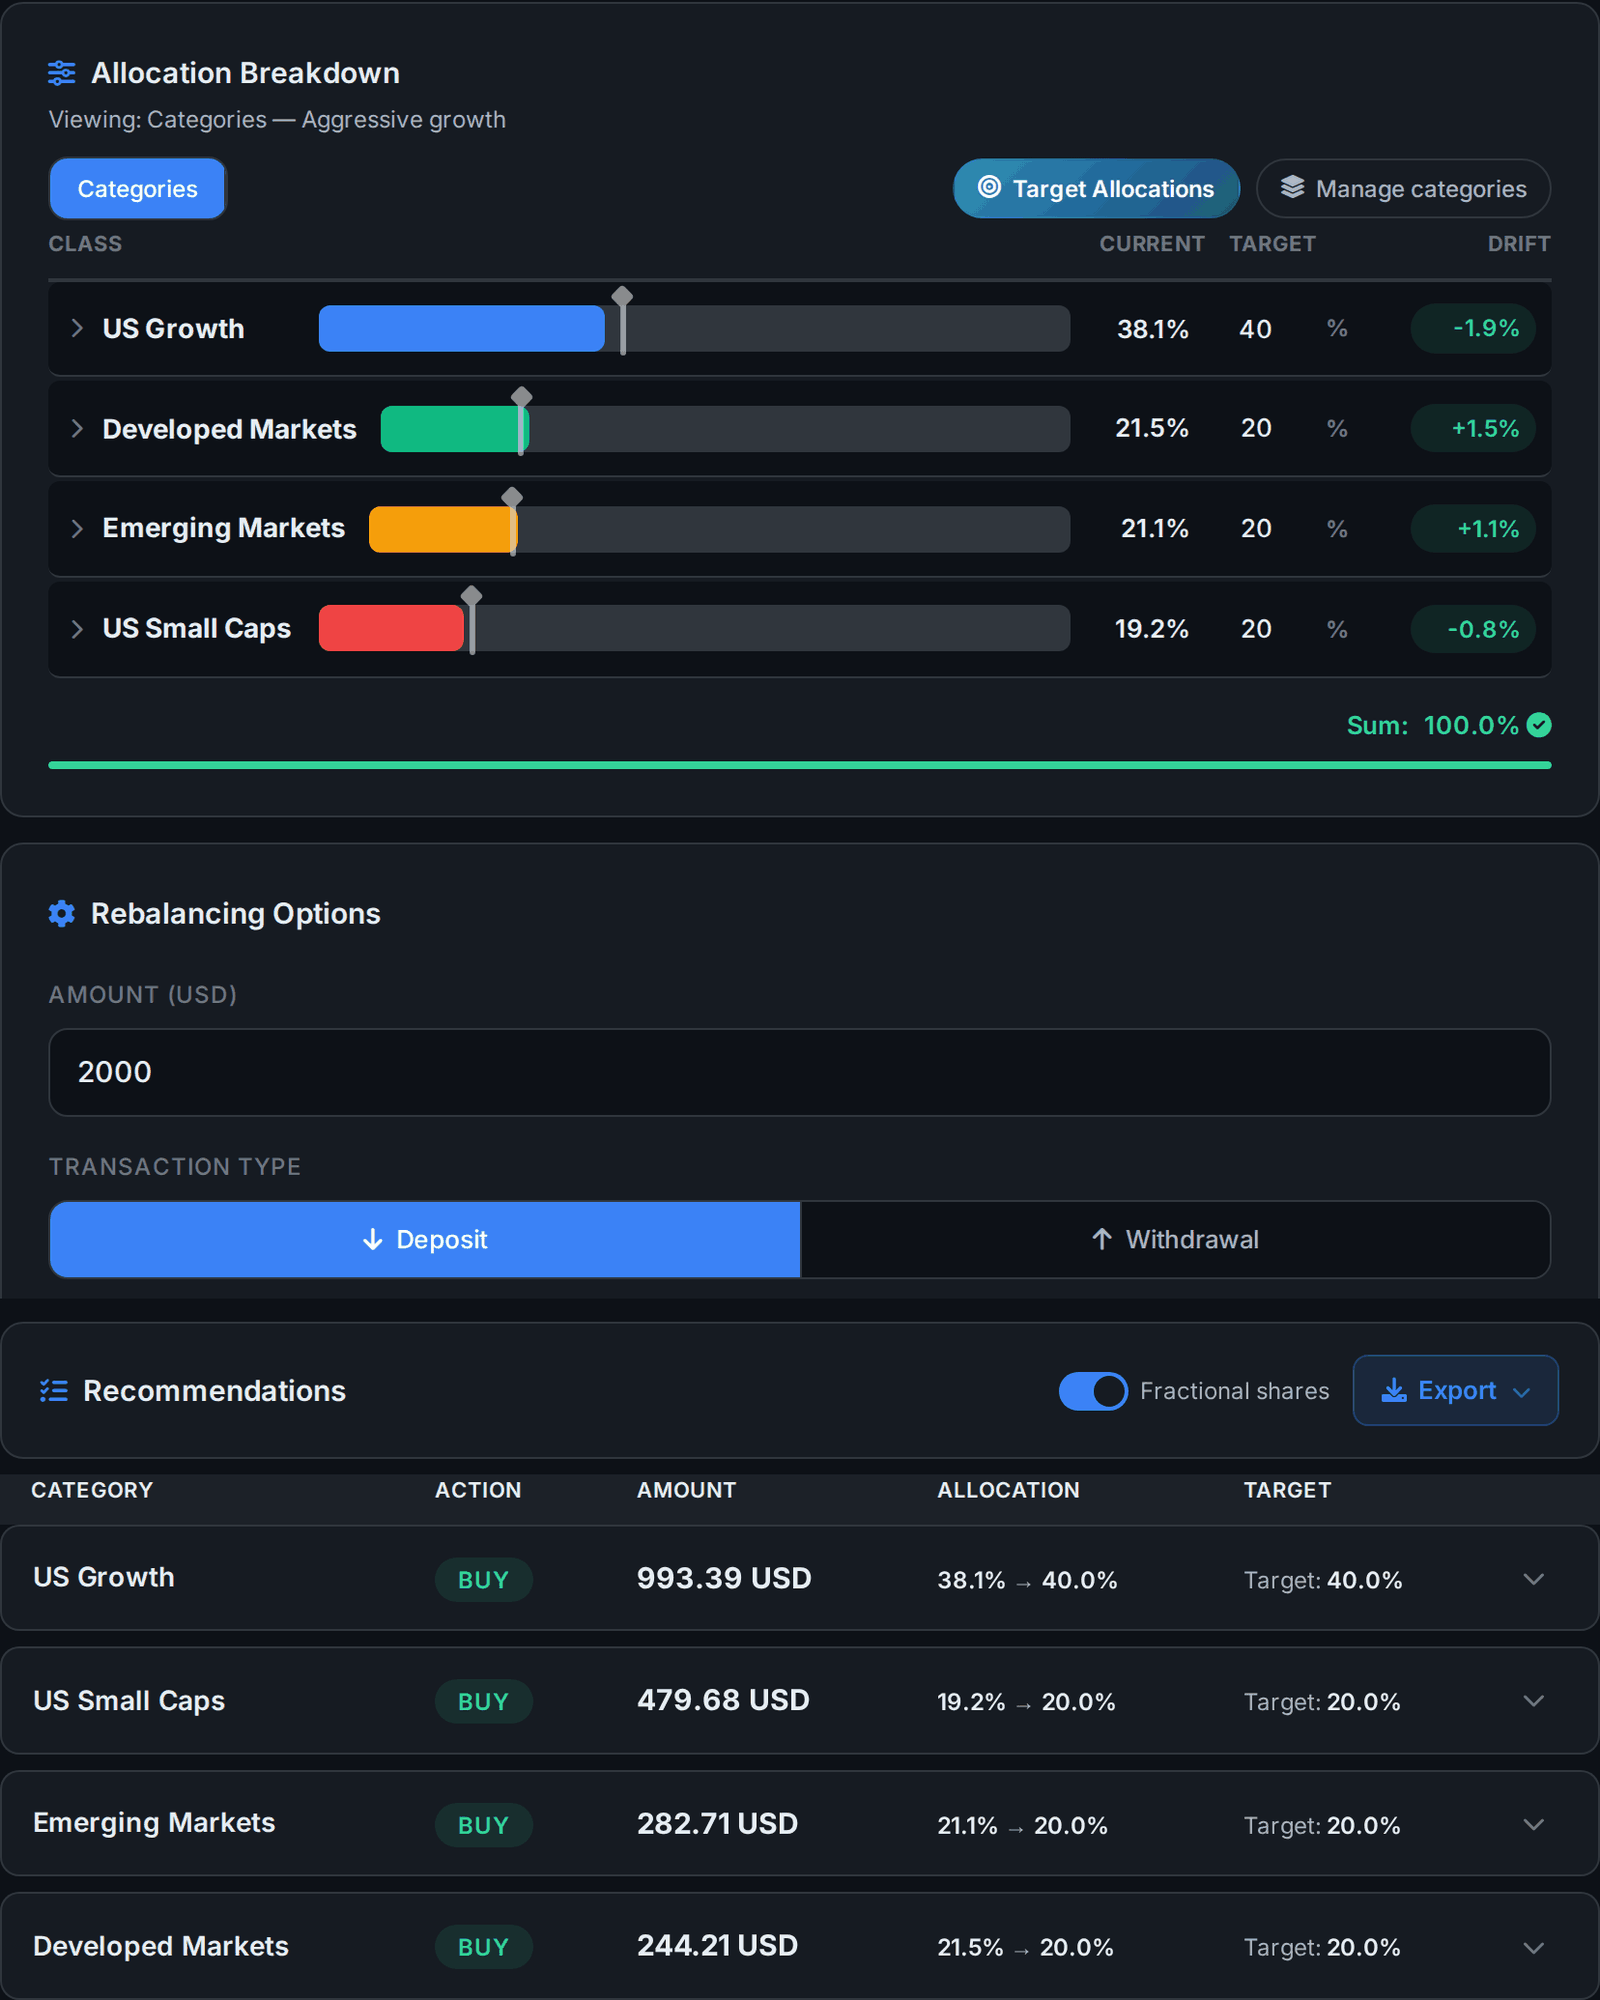
AllInvestView AllInvestView rebalancing page for a four-ETF demo portfolio. Allocation breakdown: US Growth 38.1% against a 40% target, drift -1.9%; Developed Markets 21.5% against 20%, +1.5%; Emerging Markets 21.1% against 20%, +1.1%; US Small Caps 19.2% against 20%, -0.8%. Rebalancing options: a 2000 USD deposit. Recommendations: buy 993.39 USD of US Growth, 479.68 USD of US Small Caps, 282.71 USD of Emerging Markets and 244.21 USD of Developed Markets AllInvestView rebalancing page for a four-ETF demo portfolio. Allocation breakdown: US Growth 38.1% against a 40% target, drift -1.9%; Developed Markets 21.5% against 20%, +1.5%; Emerging Markets 21.1% against 20%, +1.1%; US Small Caps 19.2% against 20%, -0.8%. Rebalancing options: a 2000 USD deposit. Recommendations: buy 993.39 USD of US Growth, 479.68 USD of US Small Caps, 282.71 USD of Emerging Markets and 244.21 USD of Developed Markets
The rebalancing page on a demo aggressive growth portfolio of VUG, VB, VEA and VWO that drifted off 40/20/20/20: with a $2,000 deposit and selling switched off, it sends $993.39 to US growth, $479.68 to small caps, $282.71 to emerging and $244.21 to developed markets, and all four land on target. Demo portfolio on sample prices; three cards of the same page stacked into one image.View full-size View full-size

Aggressive growth vs the S&P 500, tech growth and FIRE portfolios

A shorter test for all four, with ETFs: $10,000 on 2 January 2019 to 22 October 2026, rebalanced every January.

What an aggressive portfolio asks of you

Four things to be sure of before you go all in on stocks.

Sitting through a 57% fall

$10,000 in the mix at its October 2007 high was worth about $4,300 in March 2009. Selling near the bottom is how an aggressive portfolio ends up with a worse return than a cautious one. If that would be you, a lower row of the grid fits better.

Years below the old high

After its March 2000 high the mix didn't get back there until September 2005. Anything you need within about five years belongs somewhere steadier.

The tilts take turns

In the 2000s small companies and emerging markets carried the mix while growth stocks lost 24%. In the 2010s growth stocks led and the two funds abroad fell far behind. A growth fund is also heavy in a few big tech names; our growth ETF list shows how much they overlap.

No bonds to rebalance from

In a crash an all-stock mix has nothing safe to sell and buy stocks with. That's what the 20% bond version does: it fell 46.8% instead of 56.9% and gave up half a point a year.

After you buy it

Track your aggressive portfolio in one place

Sync or import your brokers and AllInvestView shows your growth, small-cap and international funds against their targets across every account, the return of the whole portfolio, its deepest fall and the tax when you sell.

Targets and drift for each fund Every broker and account in one view Free for up to 10 holdings

Questions about aggressive growth portfolios

What is an aggressive growth portfolio?

A portfolio with all or nearly all of its money in stocks, usually tilted toward the companies expected to grow fastest: large growth companies, small companies and emerging markets. It aims for the most growth over 15 years or more and accepts the deepest falls along the way. Our example holds 40% US growth stocks, 20% US small caps, 20% developed markets and 20% emerging markets.

What is a good aggressive portfolio allocation?

Somewhere between 80% and 100% in stocks. Morningstar's aggressive allocation category is for funds that behave like more than 85% in stocks, and moderately aggressive for 70% to 85%. In our test since 2000 each extra 10 points in stocks added about a third of a point a year and about five points to the worst fall, while switching from the S&P 500 to growth, small and emerging markets funds changed the return by less than half a point.

What has an aggressive growth portfolio returned?

With Vanguard's growth, small-cap, developed markets and emerging markets index funds at 40/20/20/20, $10,000 at the end of 1999 grew to $74,588 by 23 October 2026, 7.8% a year with dividends reinvested and a rebalance every January. It lost money in 8 of the 26 full years. The worst was 2008, down 41.3%, and the deepest fall from a high was 56.9%, from October 2007 to March 2009.

Is an aggressive growth portfolio better than the S&P 500?

It depends on the decade. From 2000 to 2009 the mix gained 25.7% while the S&P 500 lost 9.8%. From 2010 the S&P 500 was ahead, and since the end of 1999 it made 8.2% a year against 7.8%. The two US parts of the mix beat the S&P 500 on their own; the two funds abroad held it back.

How much can an aggressive portfolio fall?

More than half. The 40/20/20/20 mix fell 56.9% from October 2007 to March 2009: $10,000 at the high was worth about $4,300 at the bottom, and it took until April 2011 to get back. After the dot-com crash it spent five and a half years, from March 2000 to September 2005, below its high. With 20% in bonds the worst fall was 46.8%.

What is an aggressive growth fund?

A mutual fund or ETF that invests for the fastest growth, mostly in growth companies or small companies, and takes more risk to get it. The name is a description rather than a fixed category. All-in-one options for an aggressive mix include iShares' AOA and Vanguard's LifeStrategy 80/20 Fund (VASGX), both 80% stocks, or a Target Retirement fund for a date 40 or more years away.

Who should have an aggressive portfolio?

Someone saving for a goal 15 or more years away who won't need the money in a crash and won't sell when it has halved. Young investors saving for retirement are the usual case. Money for a house, school fees or the next few years of spending belongs somewhere steadier.

Sources and how the numbers were worked out

The test uses daily closing prices in US dollars with dividends reinvested, before tax and with no trading costs; fund fees are already in the prices. The four funds are Vanguard's Growth Index (VIGRX), Small-Cap Index (NAESX), Developed Markets Index (VTMGX) and Emerging Markets Stock Index (VEIEX). The developed markets fund began in August 1999, so $10,000 goes in at the close on 31 December 1999, and each mix is rebalanced to its weights on the first trading day of every year, to the close on 23 October 2026. The emerging markets fund's distributions from 2003 to 2009 are taken from its December payouts only, so its yearly returns match Vanguard's published ones. The S&P 500 is the Vanguard 500 Index Fund (VFINX), the whole US market is the Total Stock Market Index Fund (VTSMX), and the bond fund in every mix is the Total Bond Market Index Fund (VBMFX). Worst fall is the largest drop from a previous high in daily values; the worst 10 years is the lowest yearly return over any ten years ending at a month end (or on 23 October 2026). A payout whose date has no price in the data, such as the small-cap fund's in June 2023, is reinvested at the next close. The 2026 rebalancing example and the buy list use VUG, VB, VEA and VWO. The comparison with the S&P 500, tech growth and FIRE portfolios uses the shorter 2019 to 2026 test from the portfolio examples page. Past returns don't tell you future ones, and none of this is a recommendation to buy a particular fund.