Total US stocks
- Used here
VTI, 0.03%Vanguard Morningstar Total Stock Market ETF
- Swap
- VTI is already one of the cheapest funds there is.
- UCITS
- CSPX, 0.07%iShares Core S&P 500 UCITS ETF (Acc), IE00B5BMR087
The Golden Butterfly puts 20% each into five things: the whole US stock market, US small-cap value stocks, long-term Treasuries, short-term Treasuries and gold. You rebalance back to 20% once a year.
Built with five ETFs, $10,000 at the end of 2004 grew to $50,738 by 23 October 2026, 7.7% a year. A 60/40 portfolio made about the same, $53,253, but fell 34.0% at its worst. The Golden Butterfly never fell more than 20.0%.
Five ETFs at 20% each, rebalanced every January, against a 60/40 of S&P 500 and US bonds and the S&P 500 on its own.
Month-end values. Move along the chart to read any month.
| Dec 2004 to Oct 2026 | $10,000 became | A year | Worst fall | Worst year | Years with a loss | Back to its high after 2008 |
|---|---|---|---|---|---|---|
| Golden Butterfly | $50,738 | 7.7% | −20.0% | −12.9% (2022) | 4 of 21 | Sep 2009 |
| 60/40 | $53,253 | 8.0% | −34.0% | −19.1% (2008) | 3 of 21 | Nov 2010 |
| S&P 500 | $93,412 | 10.8% | −55.2% | −36.8% (2008) | 3 of 21 | Aug 2012 |
Calendar-year returns with dividends reinvested. 2026 runs to 23 October.
Each slice's own return, year by year. In most years something was up when stocks were down.
US stocks lost 37.0% and small-cap value 32.2%. Long Treasuries gained 34.0%, short ones 6.6% and gold 4.9%, so the whole portfolio lost only 4.9%.
Stocks gained 33.4% and small-cap value 36.6%, but gold fell 28.3% and long Treasuries 13.4%. The portfolio made 5.5% while the S&P 500 made 32.3%.
Rates jumped and long Treasuries lost 31.2%, worse than stocks. Gold held at −0.8%. The portfolio lost 12.9%, its worst year, and only got back to its old high in March 2024.
The funds used in the test, a lower-cost swap for each, and a UCITS version if you buy in Europe. Fees checked 24 October 2026.
| Slice (20% each) | ETF used here | Lower-cost swap | UCITS, if you buy in Europe |
|---|---|---|---|
| Total US stocksGrowth from the whole market | VTIVanguard Morningstar Total Stock Market ETF0.03% a year |
VTI is already one of the cheapest funds there is. |  CSPXiShares Core S&P 500 UCITS ETF (Acc), IE00B5BMR0870.07% a year |
| Small-cap valueSmaller, cheaper US companies | VBRVanguard Morningstar Small-Cap Value ETF0.05% a year |
VBR is already the low-cost choice for this slice. |  ZPRVSPDR MSCI USA Small Cap Value Weighted UCITS ETF (Acc), IE00BSPLC4130.30% a year |
| Long-term TreasuriesRises when rates fall and in most crashes | TLTiShares 20+ Year Treasury Bond ETF0.15% a year |
VGLTVanguard Long-Term Treasury ETF0.03% a year |
IDTL or DTLAiShares $ Treasury Bond 20+yr UCITS ETF, Dist or Acc0.07% a year |
| Short-term TreasuriesClose to cash, with a little interest | SHYiShares 1-3 Year Treasury Bond ETF0.15% a year |
VGSHVanguard Short-Term Treasury ETF0.03% a year |
IBTS or IBTAiShares $ Treasury Bond 1-3yr UCITS ETF, Dist or Acc0.07% a year |
| GoldHolds up against inflation and panics |  GLDSPDR Gold Shares0.40% a year |
GLDMSPDR Gold MiniShares0.10% a year |
SGLNiShares Physical Gold ETC, IE00B4ND36020.12% a year |
VTI, 0.03%Vanguard Morningstar Total Stock Market ETFVBR, 0.05%Vanguard Morningstar Small-Cap Value ETFTLT, 0.15%iShares 20+ Year Treasury Bond ETFSHY, 0.15%iShares 1-3 Year Treasury Bond ETFGLD, 0.40%SPDR Gold SharesAverage fee of the five used here: 0.16% a year, $15.60 on $10,000. With the swaps: 0.05%.
In Europe gold trades as an ETC, not a UCITS ETF, and the S&P 500 fund stands in for the total market. These funds hold US dollar assets, so a euro or pound investor also takes the swings in the exchange rate.
Whole shares of each ETF at the 23 October 2026 close. With fractional shares you can split any amount exactly.
Each slice gets a fifth of the amount. The cash left over is what whole shares can't use up.
| ETF | Price | Shares | Cost |
|---|---|---|---|
| Total | |||
| Cash left over | |||
Sell what grew past 20% and buy what fell below it. Here is the real drift from 2026, ready to change to your own numbers.
$10,000 split evenly on 2 January 2026 was worth $10,307 by 23 October. Small-cap value had grown to 22.1% of the portfolio and gold had shrunk to 17.9%. Type in what you hold today.
| Slice | Now | Target | Trade |
|---|---|---|---|
| Total |
New money can fill the slices below 20% without selling anything. In a taxable account that saves you realising a gain.
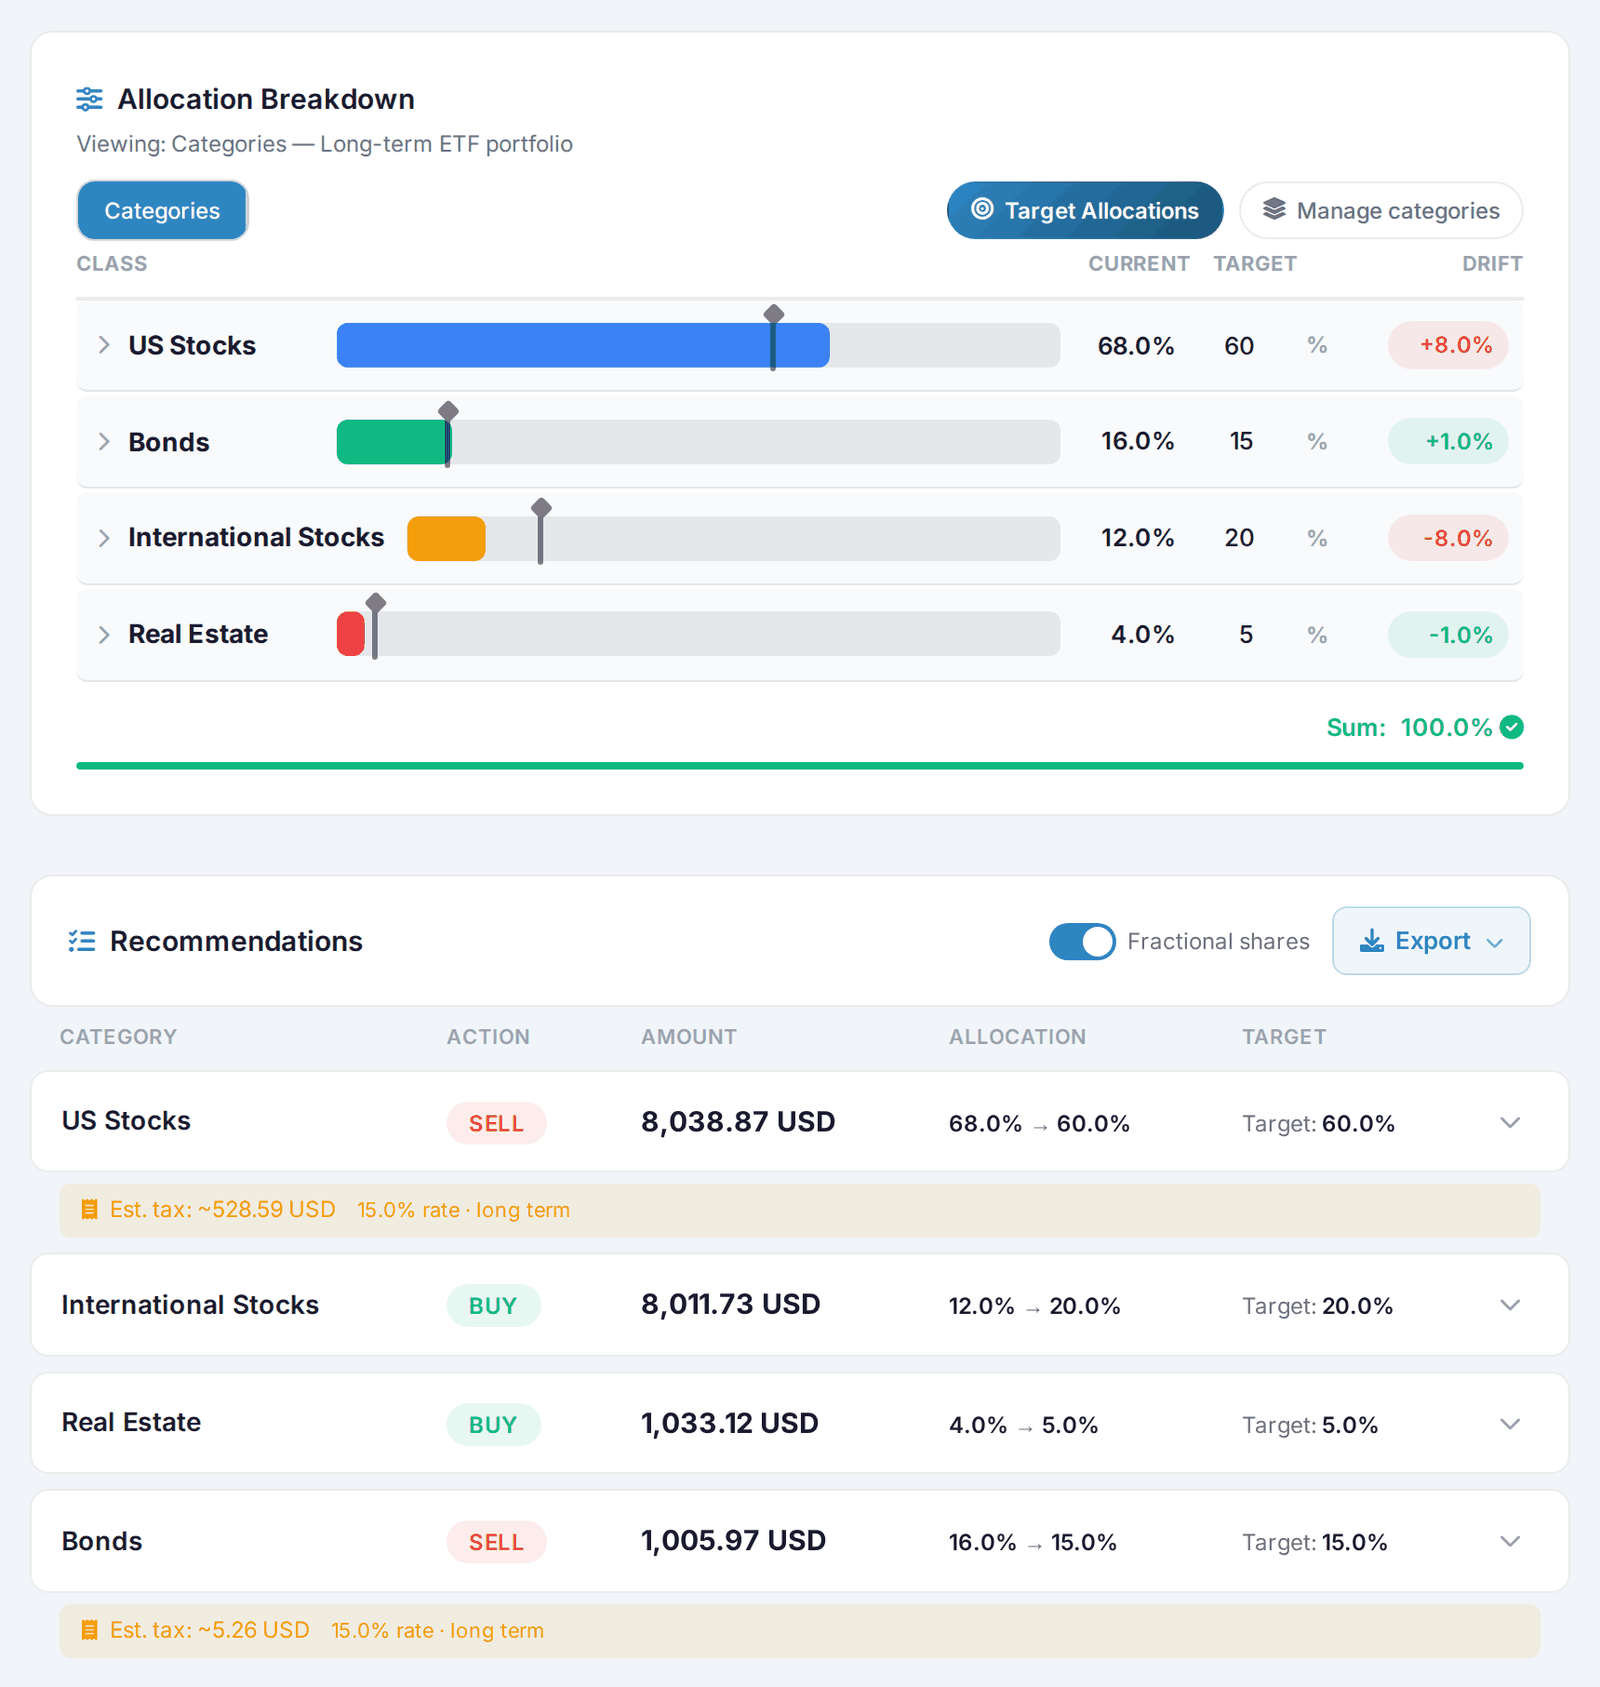
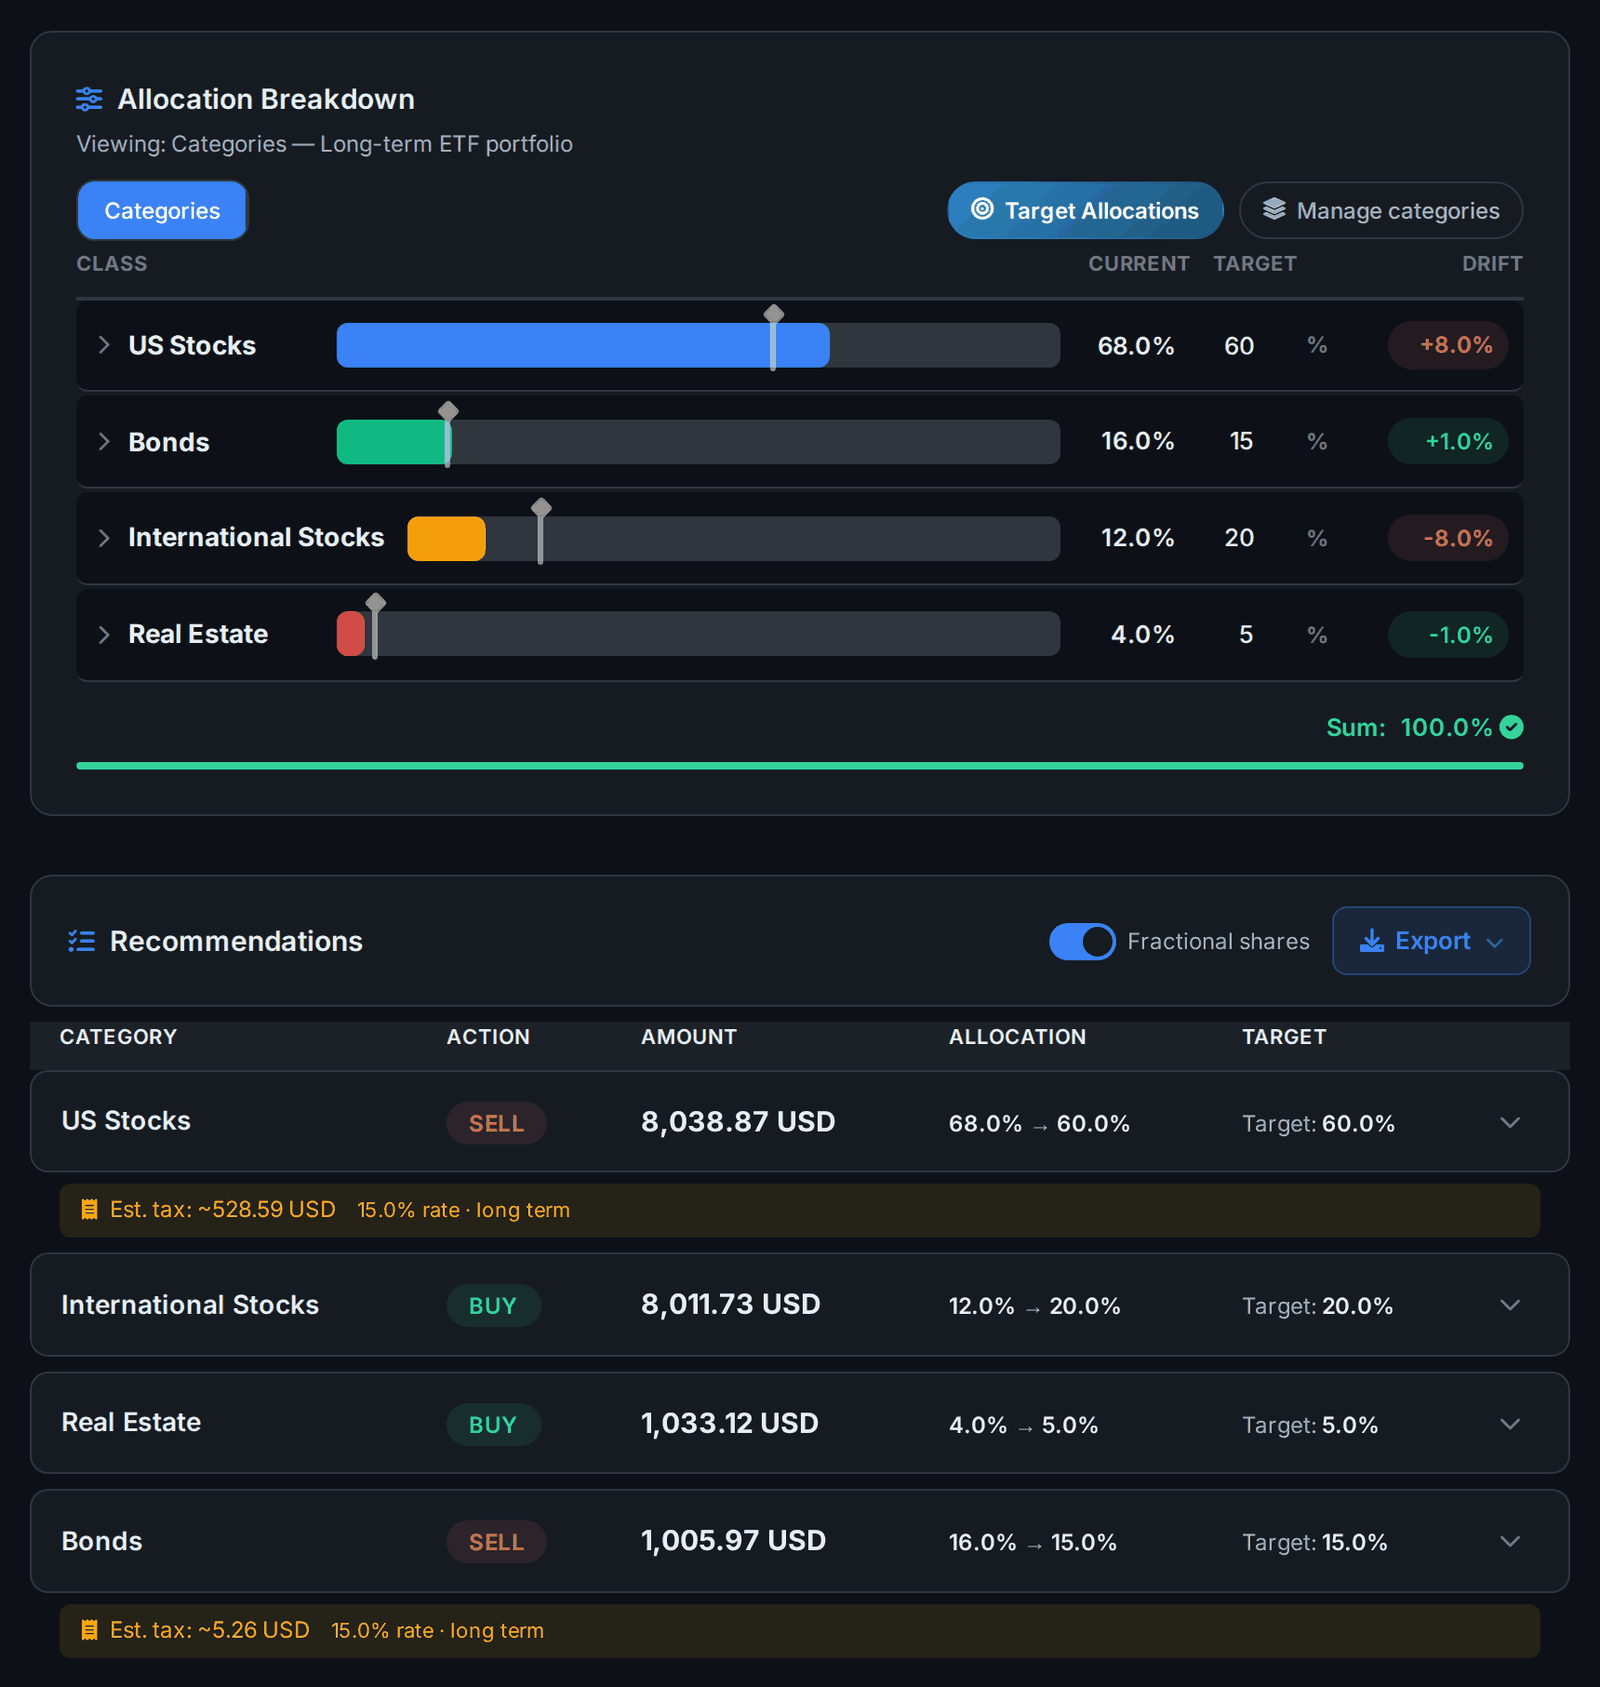
AllInvestView holds each slice against its 20% target from live prices, even when the ETFs sit at different brokers or in an IRA and a taxable account. When it's time to rebalance it lists the buys and sells, with or without selling, and can estimate the tax on each sell from your own capital gains rules. Five ETFs fit in the free plan's ten holdings.
Read the rebalancing guide AllInvestView
The same test for all four: $10,000 on 2 January 2019 to 22 October 2026, rebalanced every January.
20% each in total market, small-cap value, long and short Treasuries, and gold.
Harry Browne's 25% each in stocks, long Treasuries, gold and cash.
30% stocks, 55% Treasuries, 7.5% gold and 7.5% commodities.
60% S&P 500 and 40% US bonds, the classic balanced mix.
Four costs that show up when you hold it for years.
With only 40% in stocks, it trailed the S&P 500 in 13 of the 21 full years since 2005. Over the whole run that adds up: $50,738 against $93,412. If you can sit through a 55% fall, the stock-heavy route has paid more.
When rates jump, long Treasuries fall hard. In 2022 they lost 31.2% and the portfolio took until March 2024 to get back to its high, longer than the S&P 500, which recovered in December 2023.
Gold lost 28.3% in 2013 and fell again in 2014 and 2015, then gained 63.7% in 2025. In a US taxable account, gains on a physical gold ETF like GLD are taxed as collectibles, at up to 28% when held over a year.
Both stock slices are US-only. If you want companies from the rest of the world, a three-fund portfolio holds them, or you can swap the total-market slice for a world fund.
Sync or import your brokers and AllInvestView shows the five slices against their 20% targets, the return of the whole portfolio, the dividends and interest, and the tax when you sell.
A five-way split published by Tyler at Portfolio Charts as a twist on Harry Browne's Permanent Portfolio: 20% in the US total stock market, 20% in US small-cap value, 20% in long-term Treasuries, 20% in short-term Treasuries and 20% in gold, rebalanced back to 20% each once a year. The idea is that whatever the economy does next, at least one of the five should do well.
The usual US picks are VTI, VBR, TLT, SHY and GLD, with an average fee of 0.16% a year. VGLT, VGSH and GLDM do the same jobs for less and bring the average down to about 0.05%. In Europe, CSPX, ZPRV, IDTL or DTLA, IBTS or IBTA and a physical gold ETC such as SGLN cover the five slices.
With those five ETFs, $10,000 at the end of 2004 was worth $50,738 on 23 October 2026, 7.7% a year with dividends reinvested and a rebalance every January. Its worst year was 2022, down 12.9%, and its deepest fall from a high was 20.0%, in March 2009.
From 2005 to 2026 they earned about the same, 7.7% a year against 8.0%. The ride was different. The 60/40 fell 34.0% in 2008 and 2009 and only got back to its high in November 2010; the Golden Butterfly fell 20.0% and was back by September 2009. After 2022 it went the other way: the Golden Butterfly took until March 2024 to recover, the 60/40 until January 2024.
The Permanent Portfolio holds 25% each in stocks, long-term Treasuries, gold and cash. The Golden Butterfly trims those to 20%, swaps the cash for short-term Treasuries and adds a second 20% of stocks in small-cap value. From January 2019 to October 2026 it earned 9.3% a year against 8.6%, with a similar worst fall: 18.8% against 17.6%.
Once a year is enough, and it is what the test on this page does. Others wait until a slice drifts outside a band they set. Either way, putting new money into the slices below 20% first means you sell less, which matters in a taxable account.
The test uses daily closing prices in US dollars with dividends and interest reinvested, before tax and with no trading costs; fund fees are already in the prices. $10,000 goes in at the close on 31 December 2004, the first year end after GLD began trading, and each portfolio is rebalanced to its weights on the first trading day of every year. The 60/40 is 60% SPY and 40% AGG; the S&P 500 is SPY. Worst fall is the largest drop from a previous high in daily values. The comparison with the Permanent Portfolio and All Weather uses the shorter 2019 to 2026 test from the portfolio examples page, with the funds listed on each page. Past returns don't tell you future ones, and none of this is a recommendation to buy a particular fund.