Free stock average calculator

Stock Average Calculator: Your Average Price and Averaging Down

Your average price is everything you paid, fees included, divided by the shares you own. Buy 100 shares at $50 and 100 more at $30 and your average is $40: the stock has to climb 33% from $30 to get you back to even, not 67%. Enter your own buys below, then see what the next one would do.

Up to 50 buys, fees included Average down or up Shares needed for a target average

Your buys

Your average price per share
$40.00
200 shares for $8,000.00
Total shares200over 2 buys
Total cost$8,000.00no fees
Value today$6,000.00200 x $30.00
Gain or loss-$2,000.00-25.0% on what you paid
The stock has to rise 33.3%, from $30.00 to your $40.00 average, for you to break even.

Average down calculator: what your next buy does

Plan a buy at today's price. Enter how many shares you'd buy to see your new average, or the average you want to see what it takes.

I want to
New average price $36.67 Buying 100 shares at $30.00 for $3,000.00
Shares after300
Money in after$11,000.00
Rise to break even+22.2%

Each extra buy at $30.00 does less

The more you add, the closer your average gets to the buy price, but it never reaches it.

Buy moreSharesCash neededNew averageAverage movedRise to break even

How the average price is worked out

One formula for the average, one for the shares a target takes, and one thing that changes when you sell.

The two formulas

Average price and target average

Average = (sum of shares x price + fees) / total shares
(100 x $50 + 100 x $30) / 200 = $40

Shares to buy = shares owned x (average - target) / (target - price)
100 x ($50 - $45) / ($45 - $30) = 33.33 shares

The second formula is the first one solved for the new shares. It works upward too: if the price is above your average, buying more raises the average, and a target between the two tells you how many shares keep it there.

Equal money in each buy is not the same as equal shares: $5,000 at $50 and $5,000 at $30 average $37.50, because the cheaper buy gets you more shares. That is why buying a fixed amount every month tends to keep your average below the average of the prices.

After you sell 100 of the 200 shares

Selling: average cost or FIFO

MethodShares sold at costShares keptAverage kept
Average cost100 x $40100$40.00
FIFO, first in first out100 x $50100$30.00

With the average cost method, a sale never changes the average of the shares you keep. With FIFO the oldest shares go first, so what is left can have a very different cost. The gain you report on the sale changes with it, so the method matters at tax time.

In the US, shares you can't identify are treated as sold first in, first out, and the average method is allowed for mutual fund and dividend reinvestment plan shares (IRS Publication 550). Our realized gains calculator works a sale out lot by lot.

For the shares you actually own

Your real average cost on every holding, kept up to date

This calculator needs you to type every buy. AllInvestView keeps the record for you: sync your broker or import your history, and each holding shows the shares you own, your average cost and its return. Every buy stays on record as its own tax lot, so a sale is matched the way you choose: average cost, FIFO, LIFO or the lots you pick. Reinvested dividends, splits and buys at several brokers all count toward the same holding.

See the portfolio tracker

AllInvestView AllInvestView holding page for the Vanguard S&P 500 ETF built from 32 monthly buys of $500: 29.06 shares at an average cost of 550.66 USD, cost basis 16,000.00 USD, value 20,406.12 USD, total return 27.54%, XIRR 16.84%, and the first six of 32 tax lots, each a $500 buy with its own price and gain AllInvestView holding page for the Vanguard S&P 500 ETF built from 32 monthly buys of $500: 29.06 shares at an average cost of 550.66 USD, cost basis 16,000.00 USD, value 20,406.12 USD, total return 27.54%, XIRR 16.84%, and the first six of 32 tax lots, each a $500 buy with its own price and gain
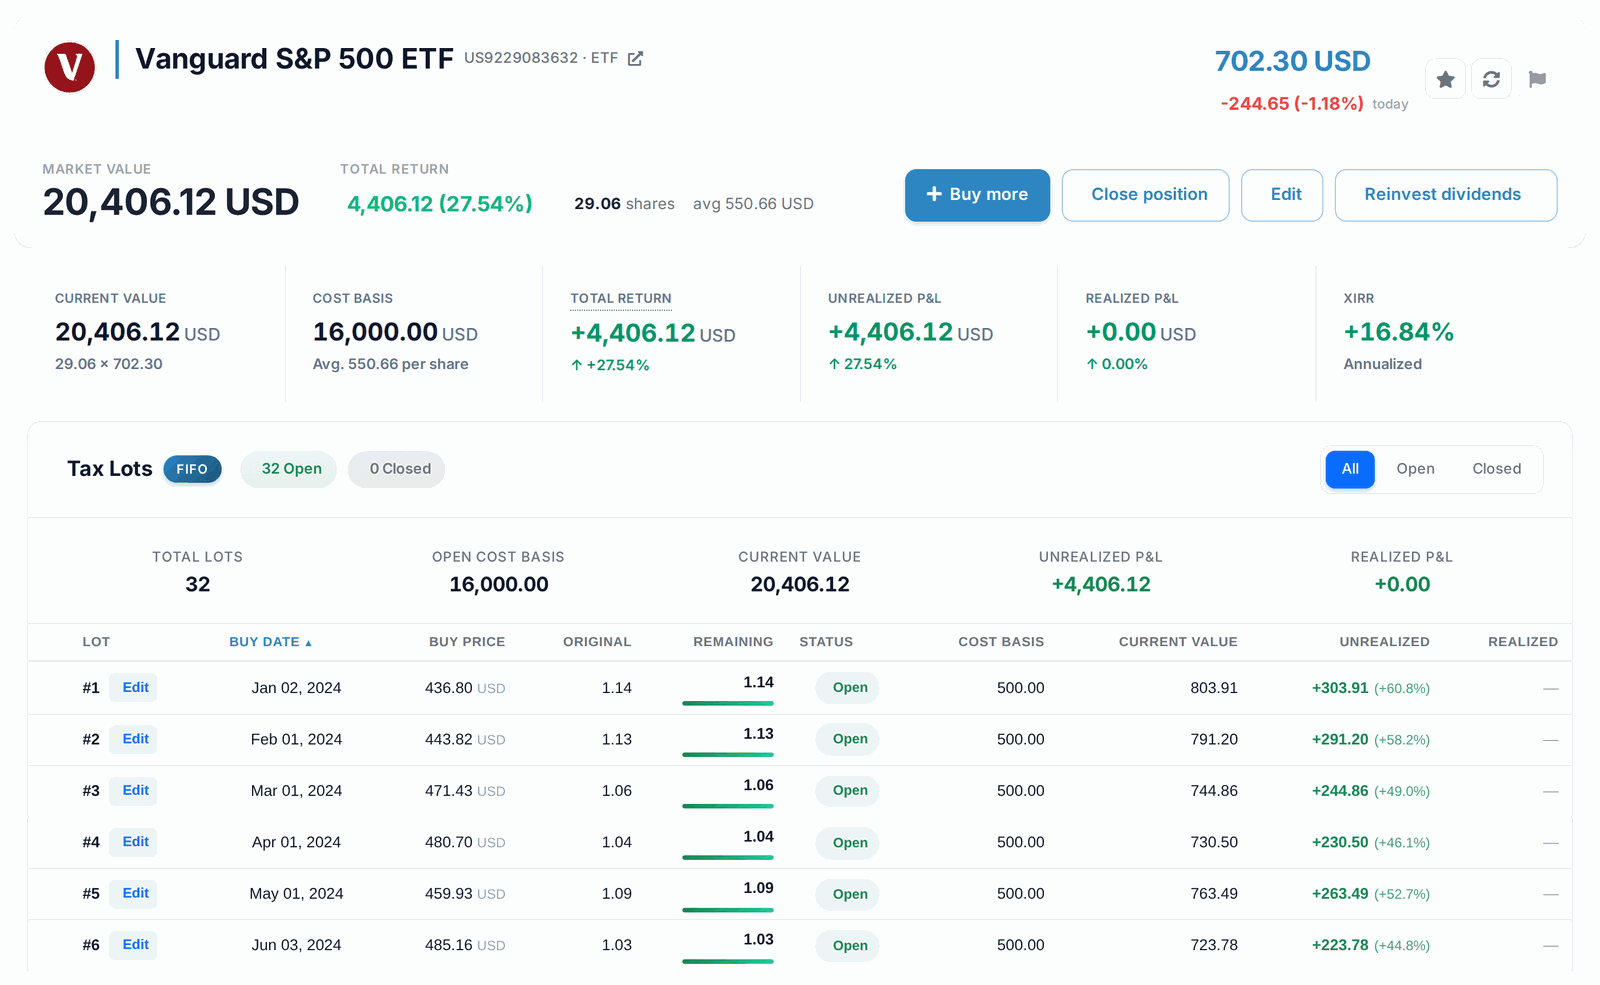
One VOO holding built from 32 monthly $500 buys: 29.06 shares at an average 550.66 USD, with each buy kept as its own lot. Demo portfolio.View full-size View full-size
Your own portfolio

Stop recalculating your average by hand

Connect your broker or import your trades, and AllInvestView keeps the average cost, gain and return of every holding up to date, across all your accounts.

Every buy kept as its own lot Average cost, FIFO, LIFO or the lots you pick Stocks, ETFs, funds, bonds and crypto

Stock average questions

How do you calculate the average price of a stock?

Add up what you paid for every buy, fees included, and divide by the number of shares you own. 100 shares at $50 ($5,000) and 100 more at $30 ($3,000) is $8,000 for 200 shares: an average of $40. If you put the same amount of money into each buy instead of the same number of shares, the average lands below the middle, because the cheaper buy gets you more shares: $5,000 at $50 and $5,000 at $30 average $37.50.

What does averaging down mean?

Buying more of a stock after its price has fallen below what you paid, so your average price per share goes down. With 100 shares at $50 and the stock at $30, buying 100 more brings your average to $40. The stock then needs to rise 33% from $30 for you to break even, instead of 67%. The other side: you now have $8,000 in a stock that has been falling instead of $5,000, so it only helps if your reasons for owning it still hold.

How many shares do I need to buy to reach a target average price?

Shares to buy = shares you own x (your average - target) / (target - price you buy at). With 100 shares at $50 and the stock at $30, reaching a $45 average takes 33.33 shares ($1,000), while reaching $35 takes 300 shares ($9,000). The closer the target is to the market price, the faster the shares you need grow, and you can never reach the market price itself.

Does selling shares change my average cost?

Under the average cost method, no: the shares you keep still cost $40 each in the example above. Under FIFO, the shares you bought first are treated as sold first, so after selling 100 of those 200 shares the 100 you keep are the $30 ones. Which method applies to your taxes depends on your country and, in the US, on the asset and the method you or your broker chose.

Do fees count in the average price?

For your real cost, yes. Commissions and other buying costs are part of what each share cost you, and in the US they are added to your cost basis. Enter them in the fees box and the average includes them.

What happens to my average price after a stock split or a dividend reinvestment?

A split changes the number of shares, not what you paid: after a 2-for-1 split you own twice the shares at half the average price. A reinvested dividend is a new buy at that day's price, so it moves your average like any other purchase. AllInvestView records both on each holding for you.

About the numbers

Everything is worked out in your browser from the numbers you type; nothing is saved or sent. Fees are spread over all the shares you bought. The average down planner assumes the new buy has no fee. Prices and amounts are in one currency; use the same one for every buy. Rules for the cost of shares you sell come from IRS Publication 550 and Publication 551 for the US; other countries have their own.