Free stock return calculator

Stock Return Calculator: What Your Investment Would Be Worth Today

$10,000 put into the S&P 500 (SPY) ten years ago, on 7 October 2016, was worth $41,179 on 30 October 2026 with dividends reinvested, 15.1% a year. The same $10,000 in NVIDIA became $1,247,815. Pick any of 62 popular stocks and ETFs, an amount and the month you bought.

Real weekly prices back to 1995 Dividends reinvested or as cash Against the S&P 500

Your investment

Bought in
Worth at the end of
Or go back
Worth on 30 Oct 2026
$41,179
from $10,000 in SPY on 7 Oct 2016
Gain+$31,179+311.8% total return
Yearly return15.1%Compound annual growth (CAGR)
Dividends$3,123paid while you held it
Shares

What the investment was worth along the way

Weekly closes.

  • Your investment
  • Same amount in the S&P 500
Year by year
YearValue at year endReturn that yearDividends that year

$10,000 invested 1, 5, 10 and 20 years ago

What $10,000 in each stock or ETF was worth on 30 October 2026, with dividends reinvested. Sorted by the last 10 years. Pick a name to load it in the calculator.

Stock or ETF1 year5 years10 years20 years
NVDANVIDIA$10,934$99,101$1,247,815$4,340,103
AMDAMD$30,655$49,273$747,852$210,246
SHOPShopify$9,773$11,659$355,027not listed
TSLATesla$9,302$15,472$305,028not listed
AVGOBroadcom$9,711$73,074$243,825not listed
LLYEli Lilly$16,985$64,602$201,726$433,051
AAPLApple$13,407$24,765$132,124$1,552,564
MSFTMicrosoft$10,172$18,818$101,687$267,732
DEDeere$14,758$21,072$91,073$231,101
CATCaterpillar$12,654$35,001$87,805$150,891
VGTVanguard Information Technology ETF$12,438$23,752$84,940$220,390
COSTCostco$11,139$23,856$80,061$301,223
MSMorgan Stanley$12,032$21,915$75,984not listed
ABBVAbbVie$13,072$32,662$70,911not listed
GOOGLAlphabet, Class A$11,436$20,688$70,556$268,435
MAMastercard$11,077$18,272$66,128$938,884
GSGoldman Sachs$11,544$26,563$64,732$70,438
JPMJPMorgan Chase$11,132$22,971$64,133$119,441
WMTWalmart$12,202$28,778$63,736$114,439
QQQInvesco QQQ, Nasdaq-100$11,502$19,751$62,358$195,076
NFLXNetflix$5,383$10,125$59,225$1,802,403
AMZNAmazon$10,949$14,641$57,265$1,474,992
VVisa$11,918$18,639$53,536not listed
METAMeta Platforms$8,684$18,098$48,127not listed
CSCOCisco$15,665$21,894$44,492$67,953
VOOVanguard S&P 500 ETF$11,423$18,670$41,424not listed
SPYSPDR S&P 500 ETF$11,414$18,610$41,179$80,731
VTIVanguard Total Stock Market ETF$11,390$17,692$39,395$79,847
ORCLOracle$4,635$15,629$39,136$90,710
BACBank of America$10,087$13,120$38,739$13,923
BRK-BBerkshire Hathaway, Class B$10,877$19,676$37,537$82,697
SCHDSchwab US Dividend Equity ETF$13,509$17,059$35,808not listed
UNHUnitedHealth$11,598$11,362$35,186$103,563
CVXChevron$15,946$27,592$35,161$80,247
DIASPDR Dow Jones Industrial Average ETF$11,227$16,437$34,418$67,803
XOMExxon Mobil$17,006$36,601$33,305$55,162
CRMSalesforce$9,618$8,487$32,947$231,543
HDHome Depot$8,570$11,318$32,707$146,460
QCOMQualcomm$9,950$14,276$31,664$72,201
VTVanguard Total World Stock ETF$11,353$16,708$31,599not listed
VYMVanguard High Dividend Yield ETF$11,851$18,074$30,903not listed
KOCoca-Cola$14,498$20,542$30,739$76,932
JNJJohnson & Johnson$14,811$19,568$30,074$74,861
GLDSPDR Gold Shares$9,948$21,616$29,713$62,428
MCDMcDonald's$8,797$11,934$28,942$113,648
IWMiShares Russell 2000 ETF$11,479$13,375$25,786$49,639
WFCWells Fargo$10,565$20,026$24,193$39,349
SBUXStarbucks$12,305$10,326$24,022$73,491
PGProcter & Gamble$10,993$13,245$23,725$45,436
ADBEAdobe$7,217$4,333$23,033$65,591
INTCIntel$17,855$13,265$21,332$53,767
PEPPepsiCo$10,065$10,695$17,648$38,465
VZVerizon$11,135$11,517$15,467not listed
PYPLPayPal$8,325$2,178$14,457not listed
BABoeing$7,931$7,591$13,933$28,504
DISDisney$10,005$6,499$13,014$44,466
NKENike$5,559$2,884$8,641$46,645
JEPIJPMorgan Equity Premium Income ETF$10,931$14,851not listednot listed
PLTRPalantir$10,638$75,672not listednot listed
ORealty Income$9,989not listednot listednot listed
UBERUber$6,755$13,868not listednot listed
COINCoinbase$3,777$6,210not listednot listed

Ten years turned $10,000 into anything from $8,641 (Nike) to $1,247,815 (NVIDIA). The winners are easy to spot today. Picking them ten years ago was the hard part, which is why the calculator always shows the S&P 500 beside your pick.

How the return is worked out

One buy at the weekly close of the month you choose, valued at the last weekly close of the end month.

Total return and yearly return

Two numbers, two jobs

Total return = value now / amount invested - 1
CAGR = (value now / amount invested)1 / years - 1
SPY, 10 years: $41,179 / $10,000, over 10 years = 15.1% a year

Total return tells you how much the money grew. The yearly return (CAGR) is the steady rate that would have got you to the same place, so you can compare a 3-year holding with a 20-year one, or with a savings account.

Coca-Cola, last 10 years

What dividends add

Reinvested
$30,739
Taken as cash
$26,734

$10,000 in Coca-Cola paid $4,189 in dividends over 10 years. Reinvested, each one bought more shares that paid dividends of their own, which is why the first bar is longer: 11.8% a year against 10.3% counting the cash. Share prices alone leave all of that out.

Profit on a trade you already made

Know your buy and sell prices? Work out the profit and the return on the money you put in. Bought at several prices? Get your average first with the stock average calculator.

Profit$1,500.00
Return+25.0%
For the stocks you actually own

Your real return, every buy and every dividend counted

This calculator runs one buy on paper. AllInvestView follows the trades you actually made, at every price, across all your brokers, with the dividends each holding paid. For any start and end date it shows your money-weighted and time-weighted returns, the yearly growth rate against a benchmark and the worst drop.

See the portfolio tracker

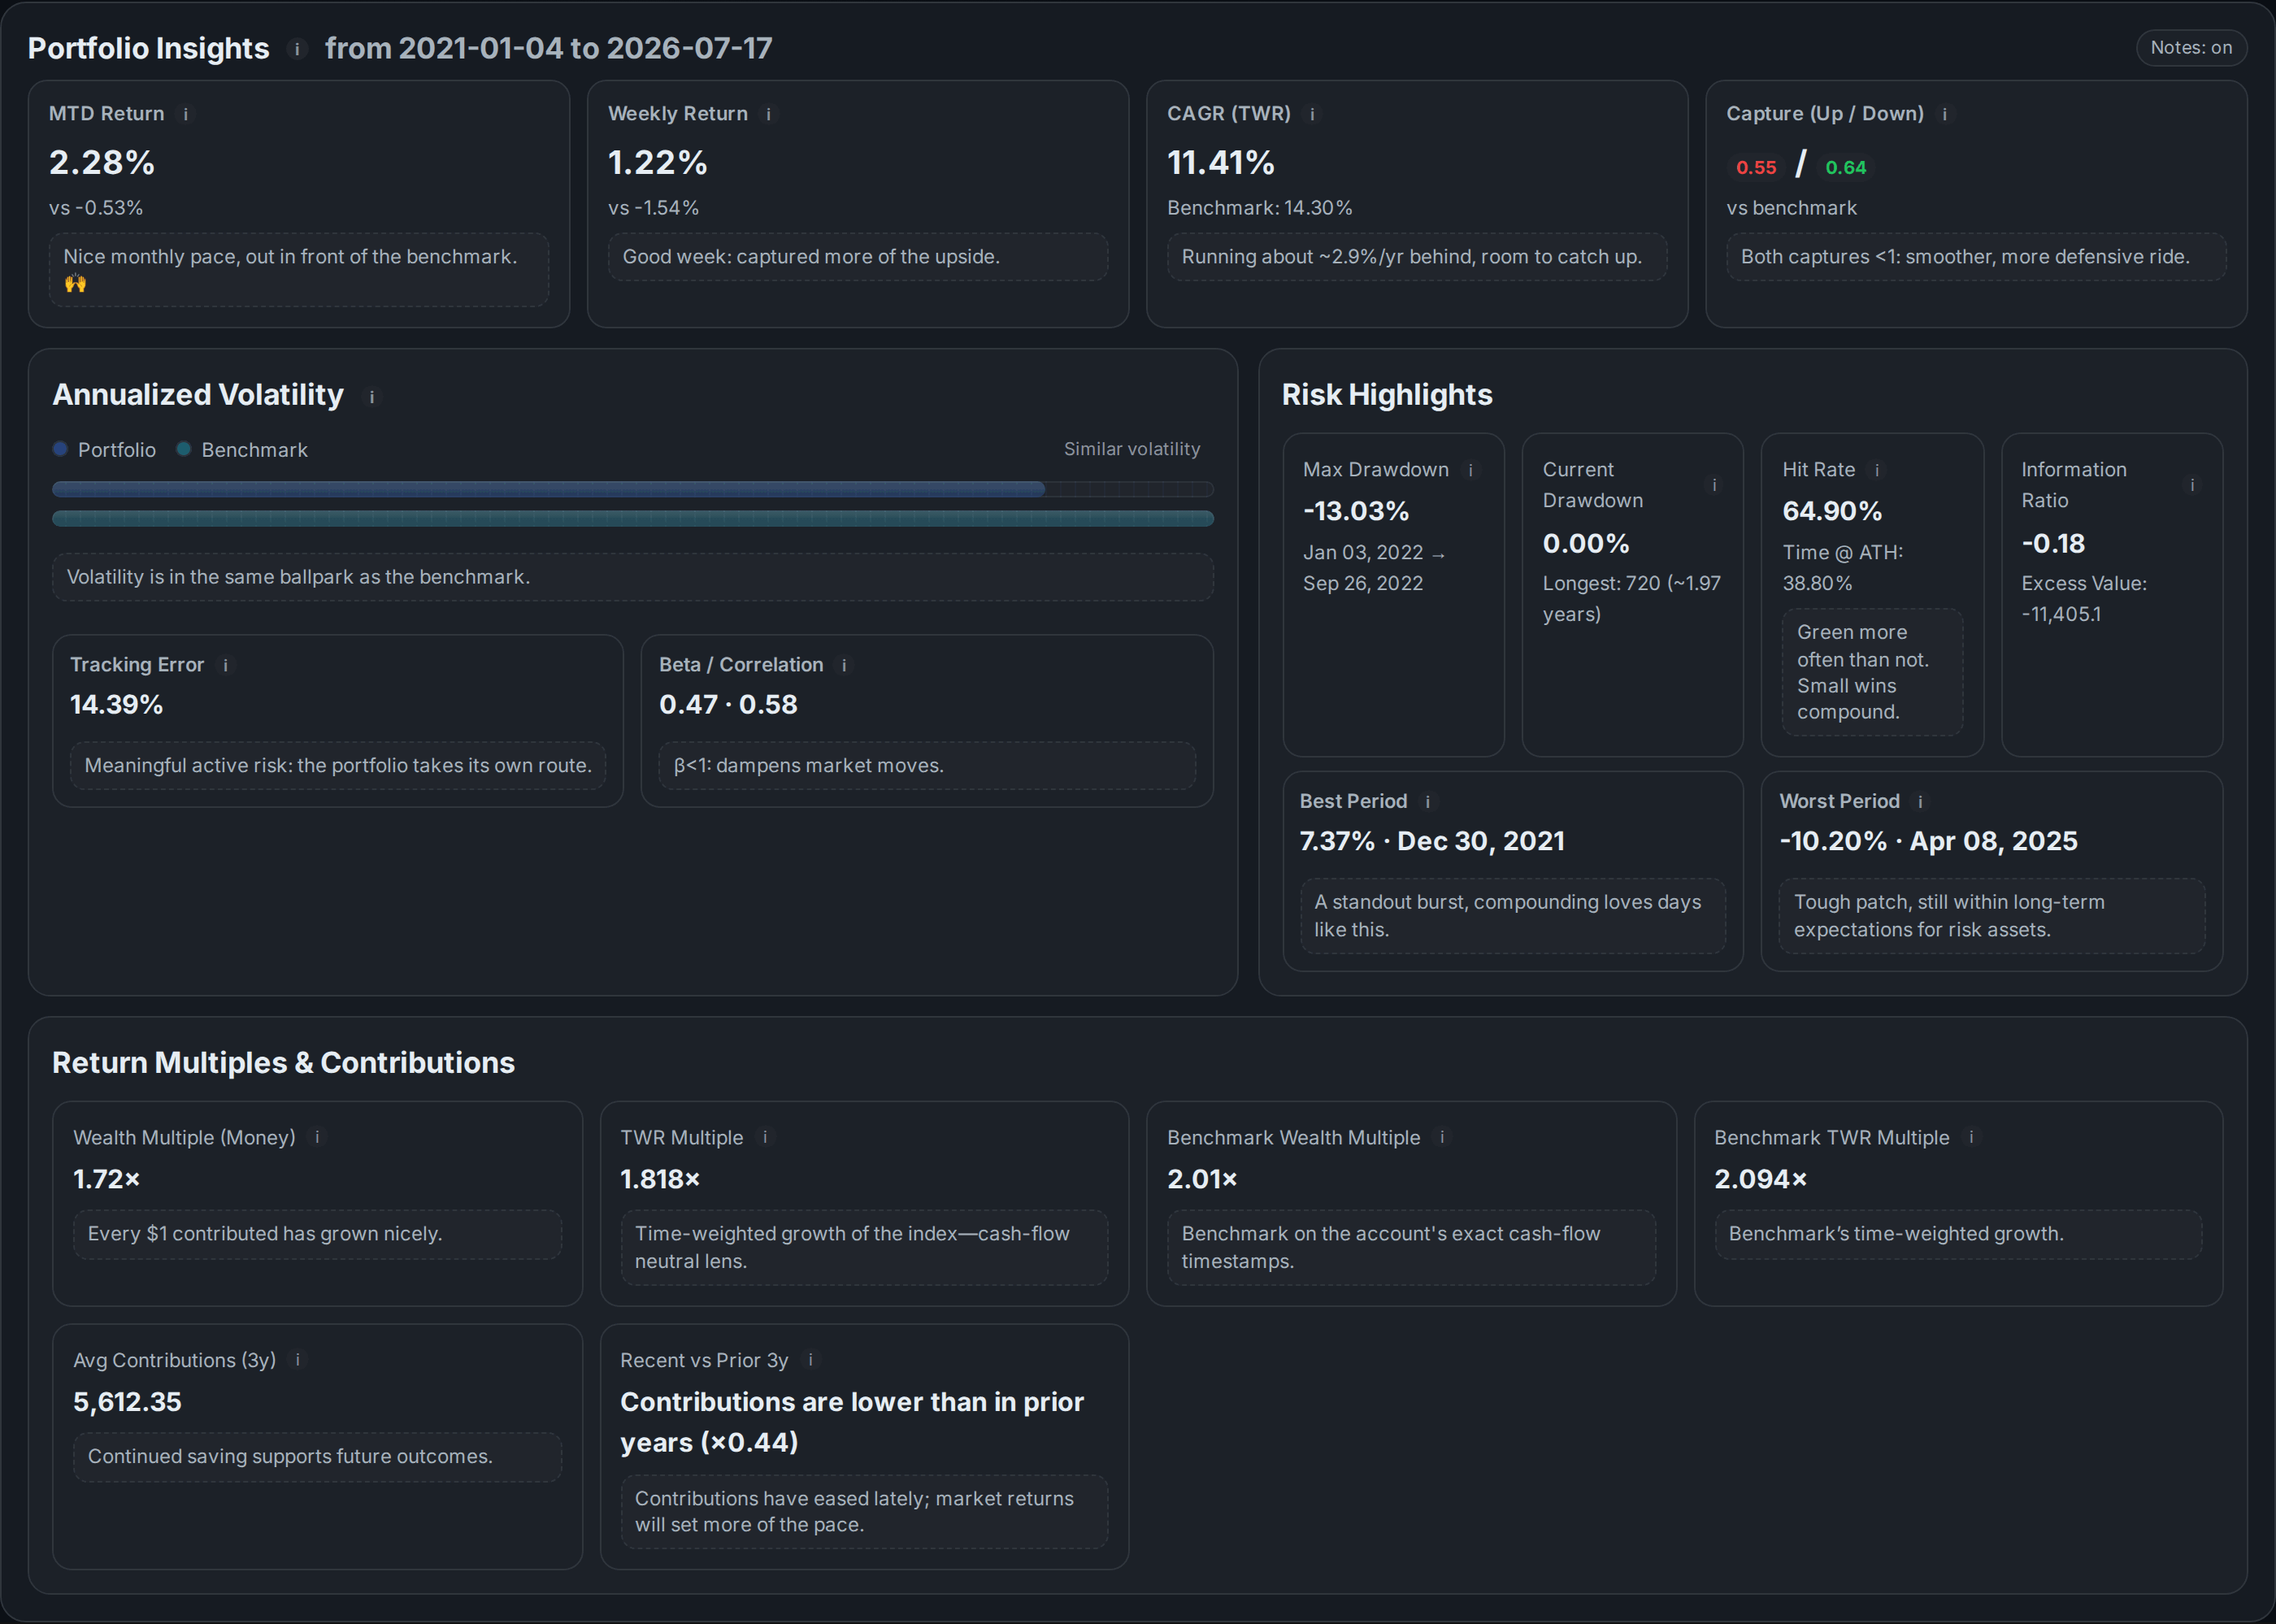
AllInvestView AllInvestView portfolio insights for a demo portfolio from January 2021 to July 2026: CAGR (TWR) 11.41% against a benchmark at 14.30%, volatility, tracking error, beta and correlation, maximum drawdown of 13.03% in 2022, hit rate and wealth multiples AllInvestView portfolio insights for a demo portfolio from January 2021 to July 2026: CAGR (TWR) 11.41% against a benchmark at 14.30%, volatility, tracking error, beta and correlation, maximum drawdown of 13.03% in 2022, hit rate and wealth multiples
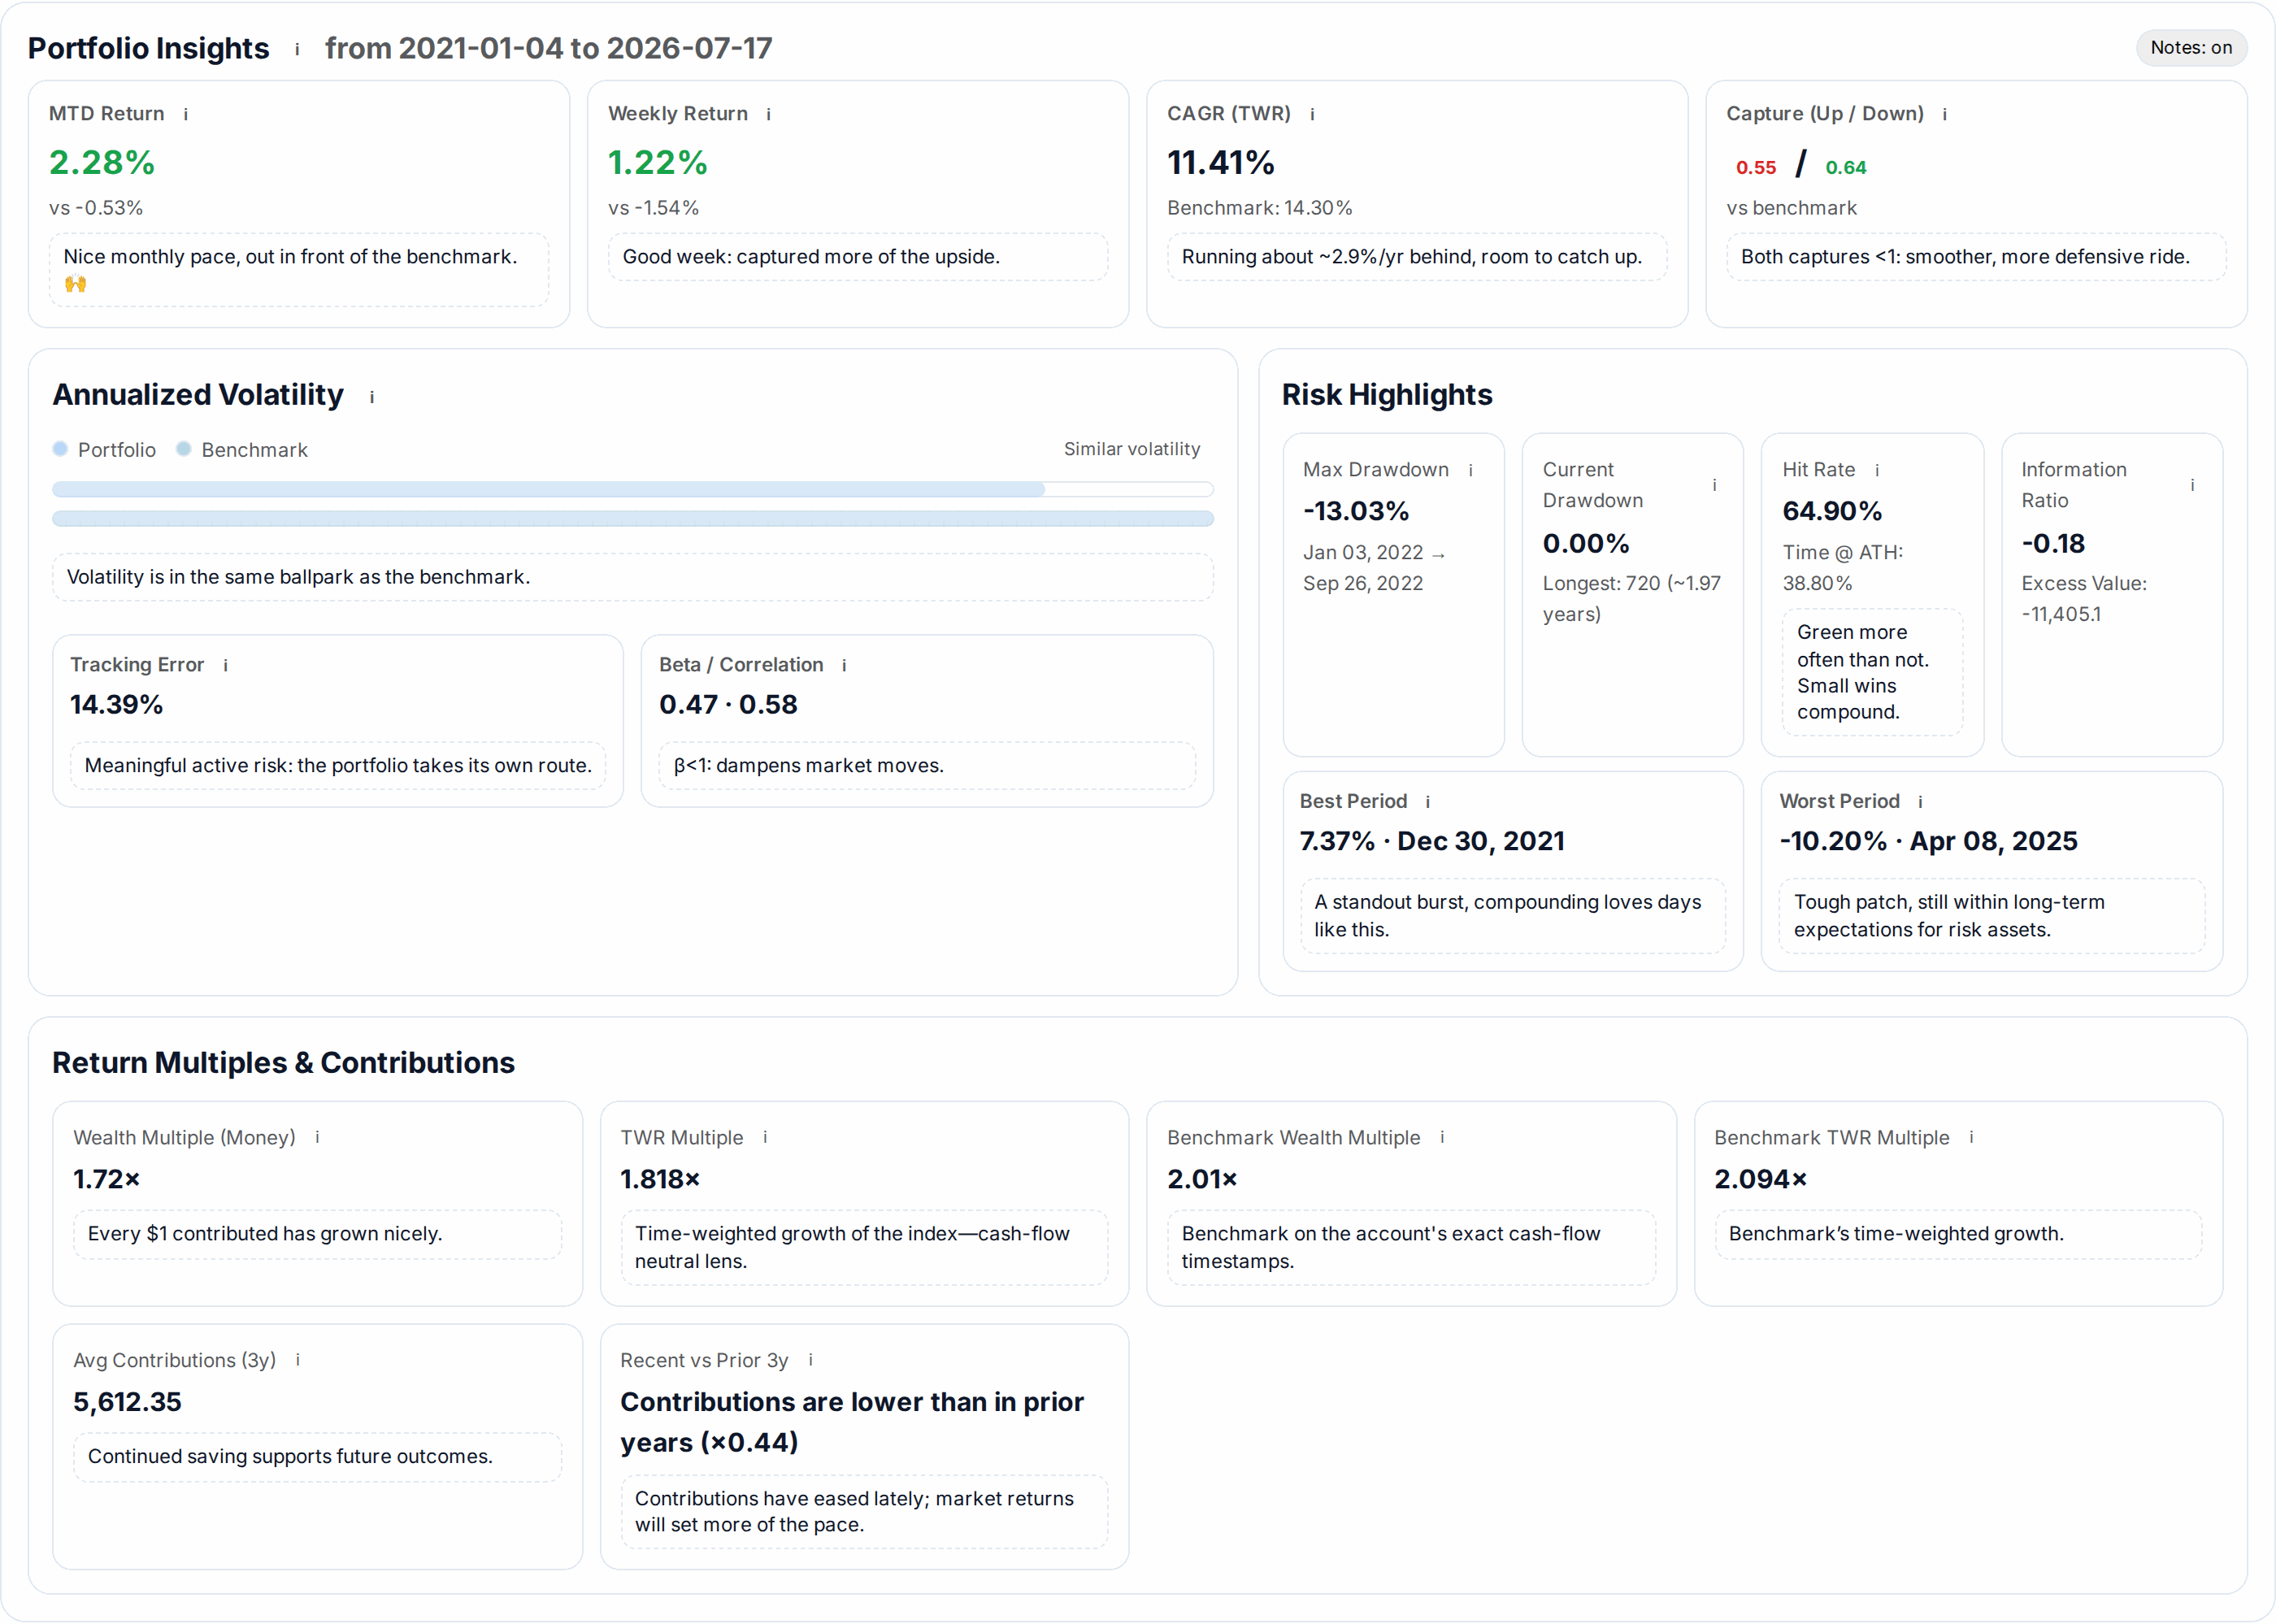
Portfolio insights on a demo portfolio, 4 January 2021 to 17 July 2026.View full-size View full-size
Your own portfolio

See what your investments have really made

Connect your broker or import your history, and AllInvestView works out the return of every holding and of the whole portfolio, dividends included, against the S&P 500.

Every buy and sale on its own date Dividends tracked automatically Stocks, ETFs, funds, bonds and crypto

Stock return questions

How do you calculate the return on a stock?

Divide what the investment is worth now by what you paid, and subtract 1. With dividends, count them too: either the cash they paid or the extra shares they bought. $10,000 in the S&P 500 (SPY) on 7 October 2016 is worth $41,179 on 30 October 2026 with dividends reinvested, a total return of 312%. To compare periods of different lengths, turn it into a yearly rate (CAGR): (end value / start value) to the power of 1 / years, minus 1. Here that is 15.1% a year.

What's the difference between total return and price return?

Price return only counts the change in the share price. Total return adds the dividends. For a dividend payer the gap is large: $10,000 in Coca-Cola 10 years ago is worth $30,739 with the dividends reinvested, or $26,734 if you took them as cash. A chart of the share price alone shows neither.

What is the average return of the S&P 500?

From October 1995 to October 2026, the S&P 500 (through SPY, after its small fee) returned 10.5% a year with dividends reinvested: $10,000 became $221,027. Over the last 10 years it was 15.1% a year. Single years swing far more than that, from big losses (2008, 2022) to gains above 25%.

Should I reinvest dividends?

If you don't need the income, reinvesting usually ends with more money, because the new shares earn their own dividends and gains. The calculator shows both: switch "Reinvest dividends" off to see the cash you'd have collected instead. Either way dividends are usually taxed in the year they're paid.

How do I work out the return on stock I actually own?

If you bought once and never sold, the calculator gives it to you. Most people bought at several prices, sold some and hold the shares across more than one account, and then a single start date doesn't fit. A money-weighted return counts each buy and sale from its own date. AllInvestView works that out for every holding and your whole portfolio from your real trades and dividends.

Why is my stock not in the list?

The calculator covers 62 of the most searched US stocks and ETFs. Companies that spun off a business, like AT&T or Pfizer, are left out or start after the spin-off, because a share price alone misses the new shares holders received. In an AllInvestView portfolio you can track the return of any stock, ETF, fund, bond or crypto you hold.

About the numbers

Weekly closing prices to 30 October 2026, adjusted for stock splits, from January 1995 or the first week a stock traded. Each dividend counts from its ex-dividend week, reinvested at that week's close or kept as cash; the dividend in the week you buy is not included. No fees or taxes. Companies that spun off a business either aren't listed or start after the spin-off, because a share price leaves out the new shares their holders received. ETF prices already reflect the fund's own fees. Past returns don't tell you what comes next.