- Home
- Bond tracker
- Yield curve today
US Treasury Yield Curve Today
On November 17, 2026 the 10-year Treasury yielded 5.10% and the 2-year 4.80%. The curve slopes up: the 10-year pays 0.30 points more than the 2-year.
The curve, from 1 month to 30 years
Lowest: 1M at 4.09% · Highest: 20Y at 5.50%- Nov 17, 2026
- Oct 16, 2026
- Nov 17, 2025
| Maturity | Nov 17 | Nov 17, 2025 | Change in a year |
|---|---|---|---|
| 1M | 4.09% | 4.04% | +0.05 |
| 2M | 4.26% | 4.01% | +0.25 |
| 3M | 4.33% | 3.97% | +0.36 |
| 4M | 4.32% | 3.87% | +0.45 |
| 6M | 4.41% | 3.81% | +0.60 |
| 1Y | 4.60% | 3.69% | +0.91 |
| 2Y | 4.80% | 3.60% | +1.20 |
| 3Y | 4.84% | 3.60% | +1.24 |
| 5Y | 4.90% | 3.72% | +1.18 |
| 7Y | 4.99% | 3.90% | +1.09 |
| 10Y | 5.10% | 4.13% | +0.97 |
| 20Y | 5.50% | 4.71% | +0.79 |
| 30Y | 5.46% | 4.73% | +0.73 |
What the bill yields mean in dollars: the T-bill calculator shows what each bill costs and pays.
Is the yield curve inverted?
No. The 10-year minus 2-year spread is +0.30 points and the 10-year minus 3-month spread is +0.77 points. Neither spread has closed below zero once in the last twelve months.
- 10Y minus 2Y
- 10Y minus 3M
- Zero: below it, the curve is inverted
Normal, flat and inverted curves
NormalToday
Long bonds pay more than short ones. Lenders want extra for tying money up for years, and markets expect rates and growth to hold up.
Flat
Two years and ten years pay about the same. It often shows up on the way from one shape to the other, when the market is unsure where the Fed goes next.
Inverted
Short bills pay more than long bonds. Markets expect the Fed to cut, usually because they expect growth to slow, which is why an inversion is watched as a recession signal.
Treasuries next to other government curves
| Curve | 2Y | 10Y |
|---|---|---|
| US TreasuriesNov 17, 2026 | 4.80% | 5.10% |
| Euro area AAA governmentsNov 16, 2026 | 3.11% | 3.42% |
| UK giltsNov 13, 2026 | n/a | 5.30% |
| Government of CanadaNov 16, 2026 | 3.30% | 3.81% |
Each curve comes from its central bank or treasury: US Treasury, European Central Bank, Bank of England, Bank of Canada. The euro area curve is the ECB's AAA-rated government spot curve; the UK figures are nominal gilt par yields.
See what a move in rates does to your bonds
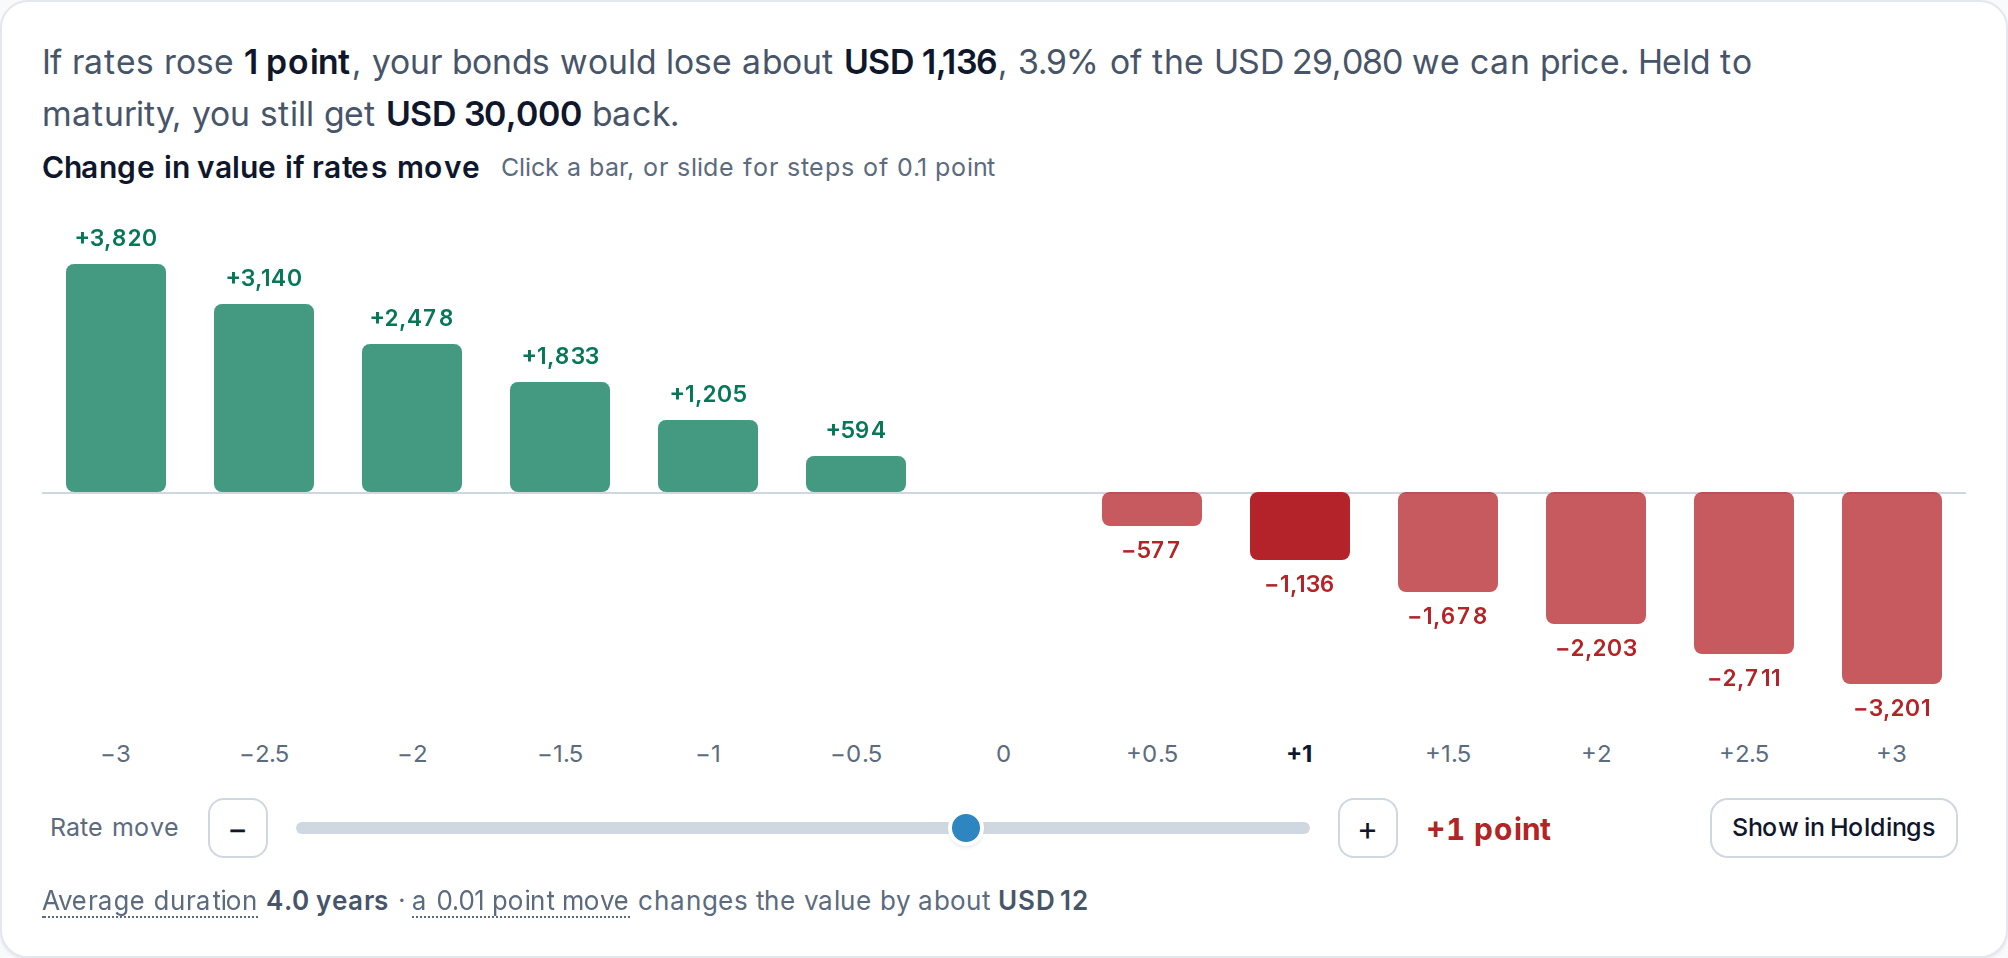
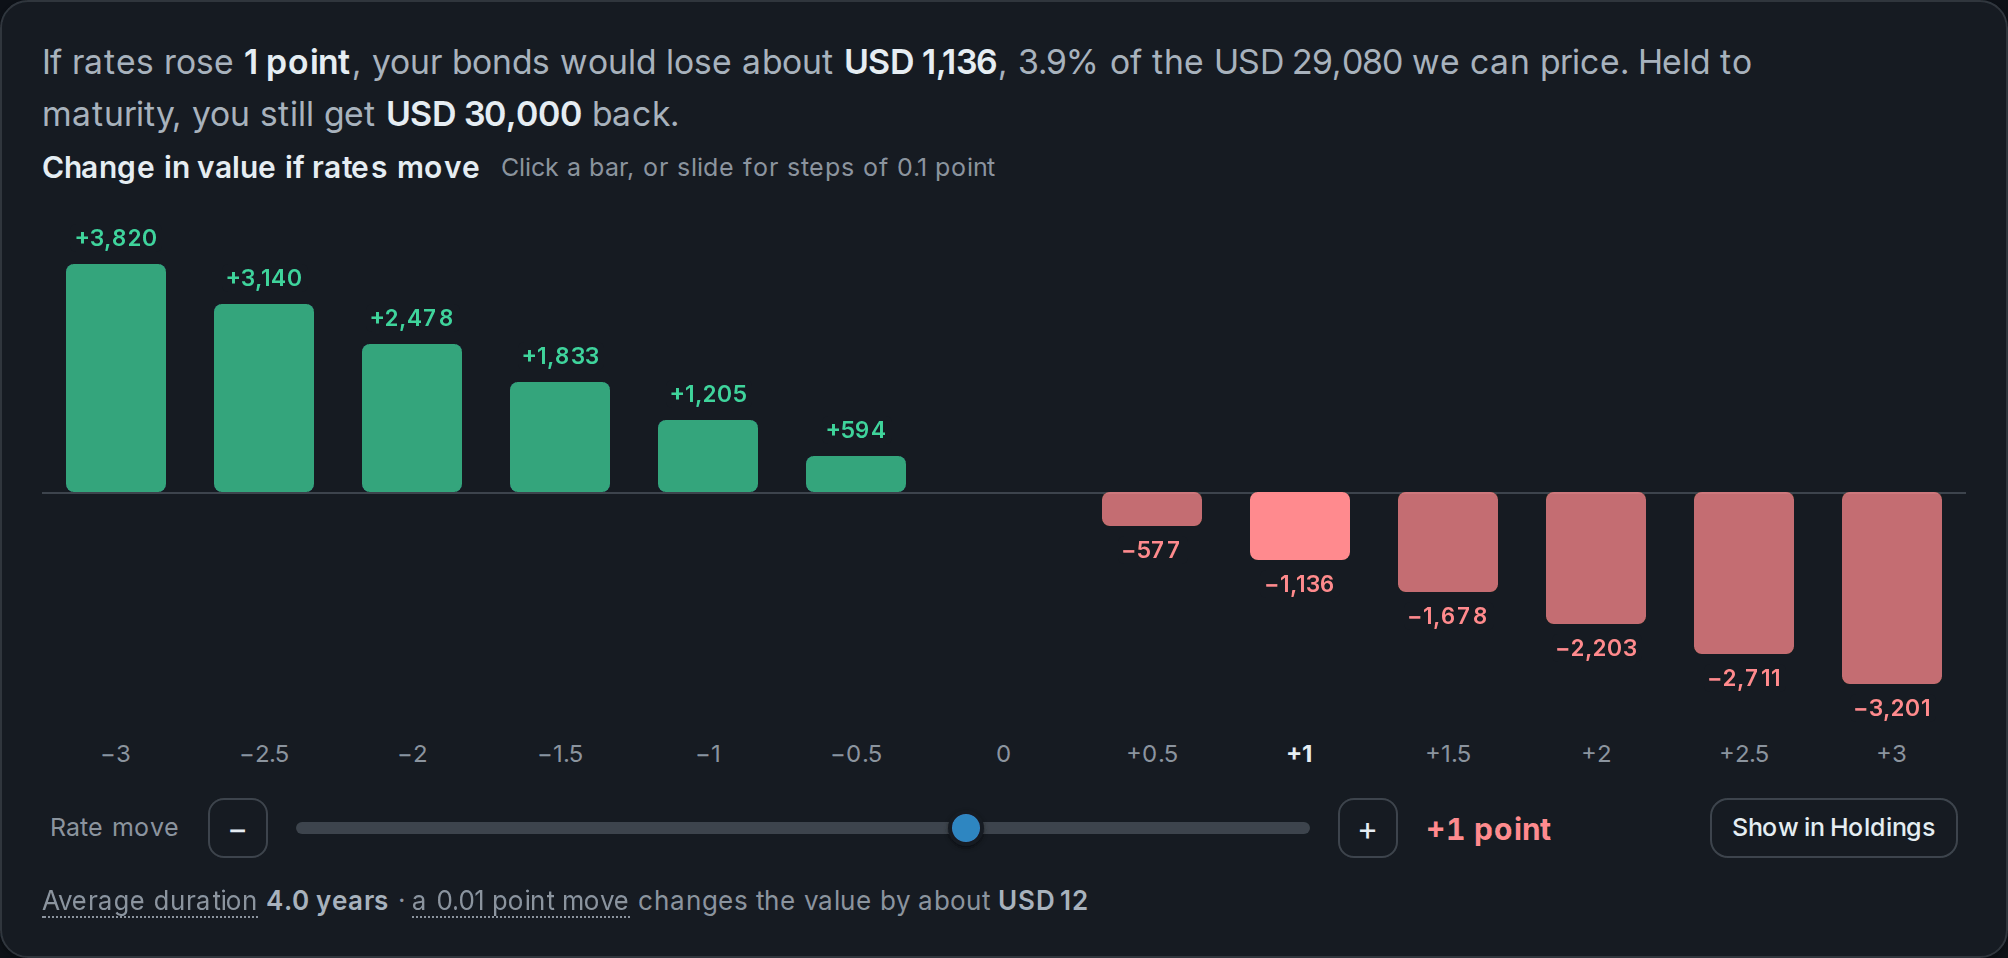
A curve on a chart is the market's number. The one you care about is what it does to the bonds you hold. AllInvestView prices each bond against its own government curve plus the spread it trades at, and tells you how much the whole book gains or loses if rates move.
- What your bond book gains or loses if rates move anywhere from 3 points down to 3 points up
- Yield to maturity, duration and spread over government for every position
- US, euro area, UK, Canadian and Australian government curves, next to your stocks, ETFs and funds
14-day Advanced trial. No card required.
 AllInvestViewBond report · Risk
Yield curve questions
Is the yield curve inverted right now?
No. On November 17, 2026 the 10-year Treasury yielded 5.10%, 0.30 points more than the 2-year at 4.80%.
What is the yield curve?
It is a line through the yields of government bonds that are the same in every way except the time left until they pay back. The US Treasury curve runs from 1-month bills to 30-year bonds. Most of the time it slopes up, because lenders want more to tie money up for longer.
What does an inverted yield curve mean?
Short-term Treasuries pay more than long-term ones. That usually happens when markets expect the Federal Reserve to cut rates, often because growth is expected to slow. An inverted 10-year minus 2-year or 10-year minus 3-month spread came before every US recession since the 1970s, though the gap between the two has ranged from months to about two years.
What is the difference between 2s10s and 3m10y?
Both measure the slope. 2s10s is the 10-year yield minus the 2-year yield and is the one most traders quote. 3m10y is the 10-year minus the 3-month bill, which follows the Fed's policy rate more closely. This page shows both every day.
How often is this page updated?
Every business day. The figures are the daily Treasury par yield curve rates that the US Treasury publishes after the market close, and the chart shows the most recent complete day.
What does the yield curve do to the bonds I own?
When yields at a bond's maturity rise, its price falls, and the longer the bond, the bigger the move. A parallel shift hits every bond, but a steepening or flattening moves short and long bonds by different amounts, so two portfolios with the same average yield can react very differently.
Keep going
Source: US Treasury daily par yield curve rates, published each business day after the close. Yields in percent, spreads in percentage points. Market data for information, not investment advice.