Desktop, web and mobile, with no minimum to open the account. paperMoney gives you $100,000 of virtual money to practice with, and the desktop version runs your own thinkScript studies.
Track a Schwab accountBest TradingView Alternatives in 2026
It depends on what you use TradingView for. For free charts, use your broker's own platform: thinkorswim at Schwab, Webull and IBKR Desktop cost nothing with an account. For automatic trendlines, chart patterns and backtests without code, TrendSpider. For futures, NinjaTrader. For research, Koyfin or Finviz. And for one record of every trade across your brokers, options included, AllInvestView, free for 10 holdings.
TradingView itself is free with ads, one chart per tab and two indicators per chart. Paid plans run from $14.95 a month for Essential to $239.95 for Ultimate, or $12.95 to $199.95 a month billed yearly.
Pick a TradingView alternative by what you use it for
TradingView does a lot in one place. Each tool below does one part of it better, so start with the part you use most.
Free charts
If you already trade at one of these brokers, its own platform gives you full charts, alerts and paper trading without a subscription.
Free charts on desktop, web and mobile, and a paper trading simulator with unlimited virtual cash to try a strategy first.
Track a Webull accountCharts across stocks, options, futures and forex in many countries, with free streaming US quotes from Cboe One and IEX. Full exchange data is billed separately.
Track an IBKR accountPatterns and backtests
TradingView finds chart patterns for you only on Premium and above. These tools are built around doing that work automatically.
Draws trendlines and Fibonacci levels for you, spots candlestick and chart patterns, and backtests a strategy without writing code.
Real-time scans of US stocks and options, with Nasdaq Basic data included. Premium, at $49.99, adds EasyScan conditions and your own formulas.
Automated trading with Expert Advisors written in MQL5, and a Strategy Tester to run them on past data first.
Research and screening
For finding the next stock rather than timing the entry on the one you picked.
Charts with fundamentals, estimates and macro data beside the price, and dashboards you build yourself.
Koyfin alternativesA fast screener and the market heat map for free. Elite adds real-time quotes and intraday charts with up to 12 on one screen.
Finviz alternativesClassic technical charts and scans. Free charts take three indicators and three overlays, more than TradingView Basic allows.
Futures and forex
For trading futures or currencies straight from the chart, with the broker built in.
Futures charts, simulated trading and order flow. The paid plans, $99 a month or $1,499 once, cut what you pay per contract.
Offered by hundreds of brokers and banks for forex and more, on Windows, Mac, Linux, the web and your phone.
Your trades and options
TradingView Portfolios keeps stocks, funds, forex and crypto, but not options. If you want every trade from every broker in one record, start here.
Every lot at its own cost, options with their Greeks and wheel cycles, the dividends you were paid, your return for any dates and a capital gains report for your country.
See it belowHoldings next to your charts, with return against a benchmark, allocation and risk figures. Paid plans link up to three brokers.
How it comparesTradingView alternatives compared
US prices. "Billed yearly" is the monthly price when you pay for a year up front.
| Tool | Best for | Free | Cheapest paid plan | Runs on | Your trades and holdings |
|---|---|---|---|---|---|
AllInvestView |
Your trades, options and tax | 1 portfolio, 10 holdings | $6.99 a month, billed yearly, or pay once for a limited time | Web, iPhone, Android | Every lot from every broker, options, dividends and capital gains |
TradingView |
Charts and trading ideas | Basic, with ads | Essential $14.95 a month, or $12.95 billed yearly | Web, desktop, mobile | Stocks, funds, forex and crypto; no options |
thinkorswim |
Charts and trading at Schwab | With a Schwab account | None | Desktop, web, mobile | Your Schwab positions and activity |

Webull |
Free charts at your broker | Yes | Premium $3.99 a month, or $40 a year | Desktop, web, mobile | Your Webull positions and orders |

IBKR Desktop |
Global trading at Interactive Brokers | With an IBKR account | None; extra market data is billed | Windows, Mac, Linux | Your IBKR P&L, margin and performance |
TrendSpider |
Automated trendlines, patterns and backtests | No | Standard $89 a month, or $54 billed yearly | Web, mobile | Strategy tests and trading bots |
TC2000 |
Real-time scans of US stocks and options | No | Basic $24.99 a month | Windows, Mac and web by streaming, mobile | Paper trading and its own brokerage |
StockCharts |
Classic technical charts | 3 indicators and 3 overlays a chart | Basic $19.95 a month | Web | ChartLists of the symbols you follow |
Koyfin |
Fundamentals and macro dashboards | Yes | Plus $39 a month, billed yearly | Web, mobile | Portfolios from a CSV of your lots |
Finviz |
Screener and heat maps | Yes | Elite $39.50 a month, or $299.50 a year | Web | Elite: up to 100 portfolios with real-time quotes |
NinjaTrader |
Futures | Yes | $99 a month, or $1,499 once | Desktop, web, mobile | Your live and simulated futures accounts |
MetaTrader 5 |
Forex and automated strategies | Through your broker | None | Windows, Mac, Linux, web, mobile | Orders, positions and history at that broker |
For the two side by side, feature by feature, read TradingView vs AllInvestView. For research and screening tools, see Koyfin alternatives and Finviz alternatives.
Is TradingView free? What the free plan keeps and what you pay for
Yes. TradingView Basic is free for good, with no card needed, and it keeps paper trading and trading through a linked broker. Here is where it stops.
| Plan | Basic | Essential | Plus | Premium | Ultimate |
|---|---|---|---|---|---|
| Price a month | Free | $14.95$12.95 billed yearly | $34.95$29.95 billed yearly | $69.95$59.95 billed yearly | $239.95$199.95 billed yearly |
| Charts per tab | 1 | 2 | 4 | 8 | 16 |
| Indicators per chart | 2 | 5 | 10 | 25 | 50 |
| Price alerts | 3 | 20 | 100 | 400 | 1,000 |
| Alerts on indicators and drawings | - | 20 | 100 | 400 | 1,000 |
| Bars of history | 5K | 10K | 10K | 20K | 40K |
| Minute bars in Bar Replay | - | 180 days | 365 days | All | All |
| Auto chart patterns | - | - | - | Yes | Yes |
| Ads on charts | Yes | No | No | No | No |
| Portfolios | 1 of 20 holdings | 3 of 50 | 4 of 75 | 5 of 100 | 7 of 150 |
| Broker links for portfolios | - | 3 | 3 | 3 | 3 |
Free US stock prices are real-time from Cboe, which can differ a little from the main exchanges. Nasdaq, NYSE and NYSE Arca cost $3 a month each, or $9.95 for the US bundle, and buying data needs a paid plan or a trial. Ultimate is the only plan for professional users.
TradingView Portfolios next to AllInvestView
TradingView added portfolios to keep your holdings next to the chart. Here is what it keeps, from its own help pages, and what changes when the same trades live in AllInvestView.
If you trade options, bring your broker's own history rather than a TradingView export: it has every leg, roll, assignment and expiry, which TradingView Portfolios has no place for.
Keep TradingView for charts, and your trades in AllInvestView
Your charts can stay in TradingView or your broker's platform. AllInvestView is where every trade from every broker ends up, with the options, the gains and the tax worked out.
Plan a trade with its payoff, breakevens and Greeks
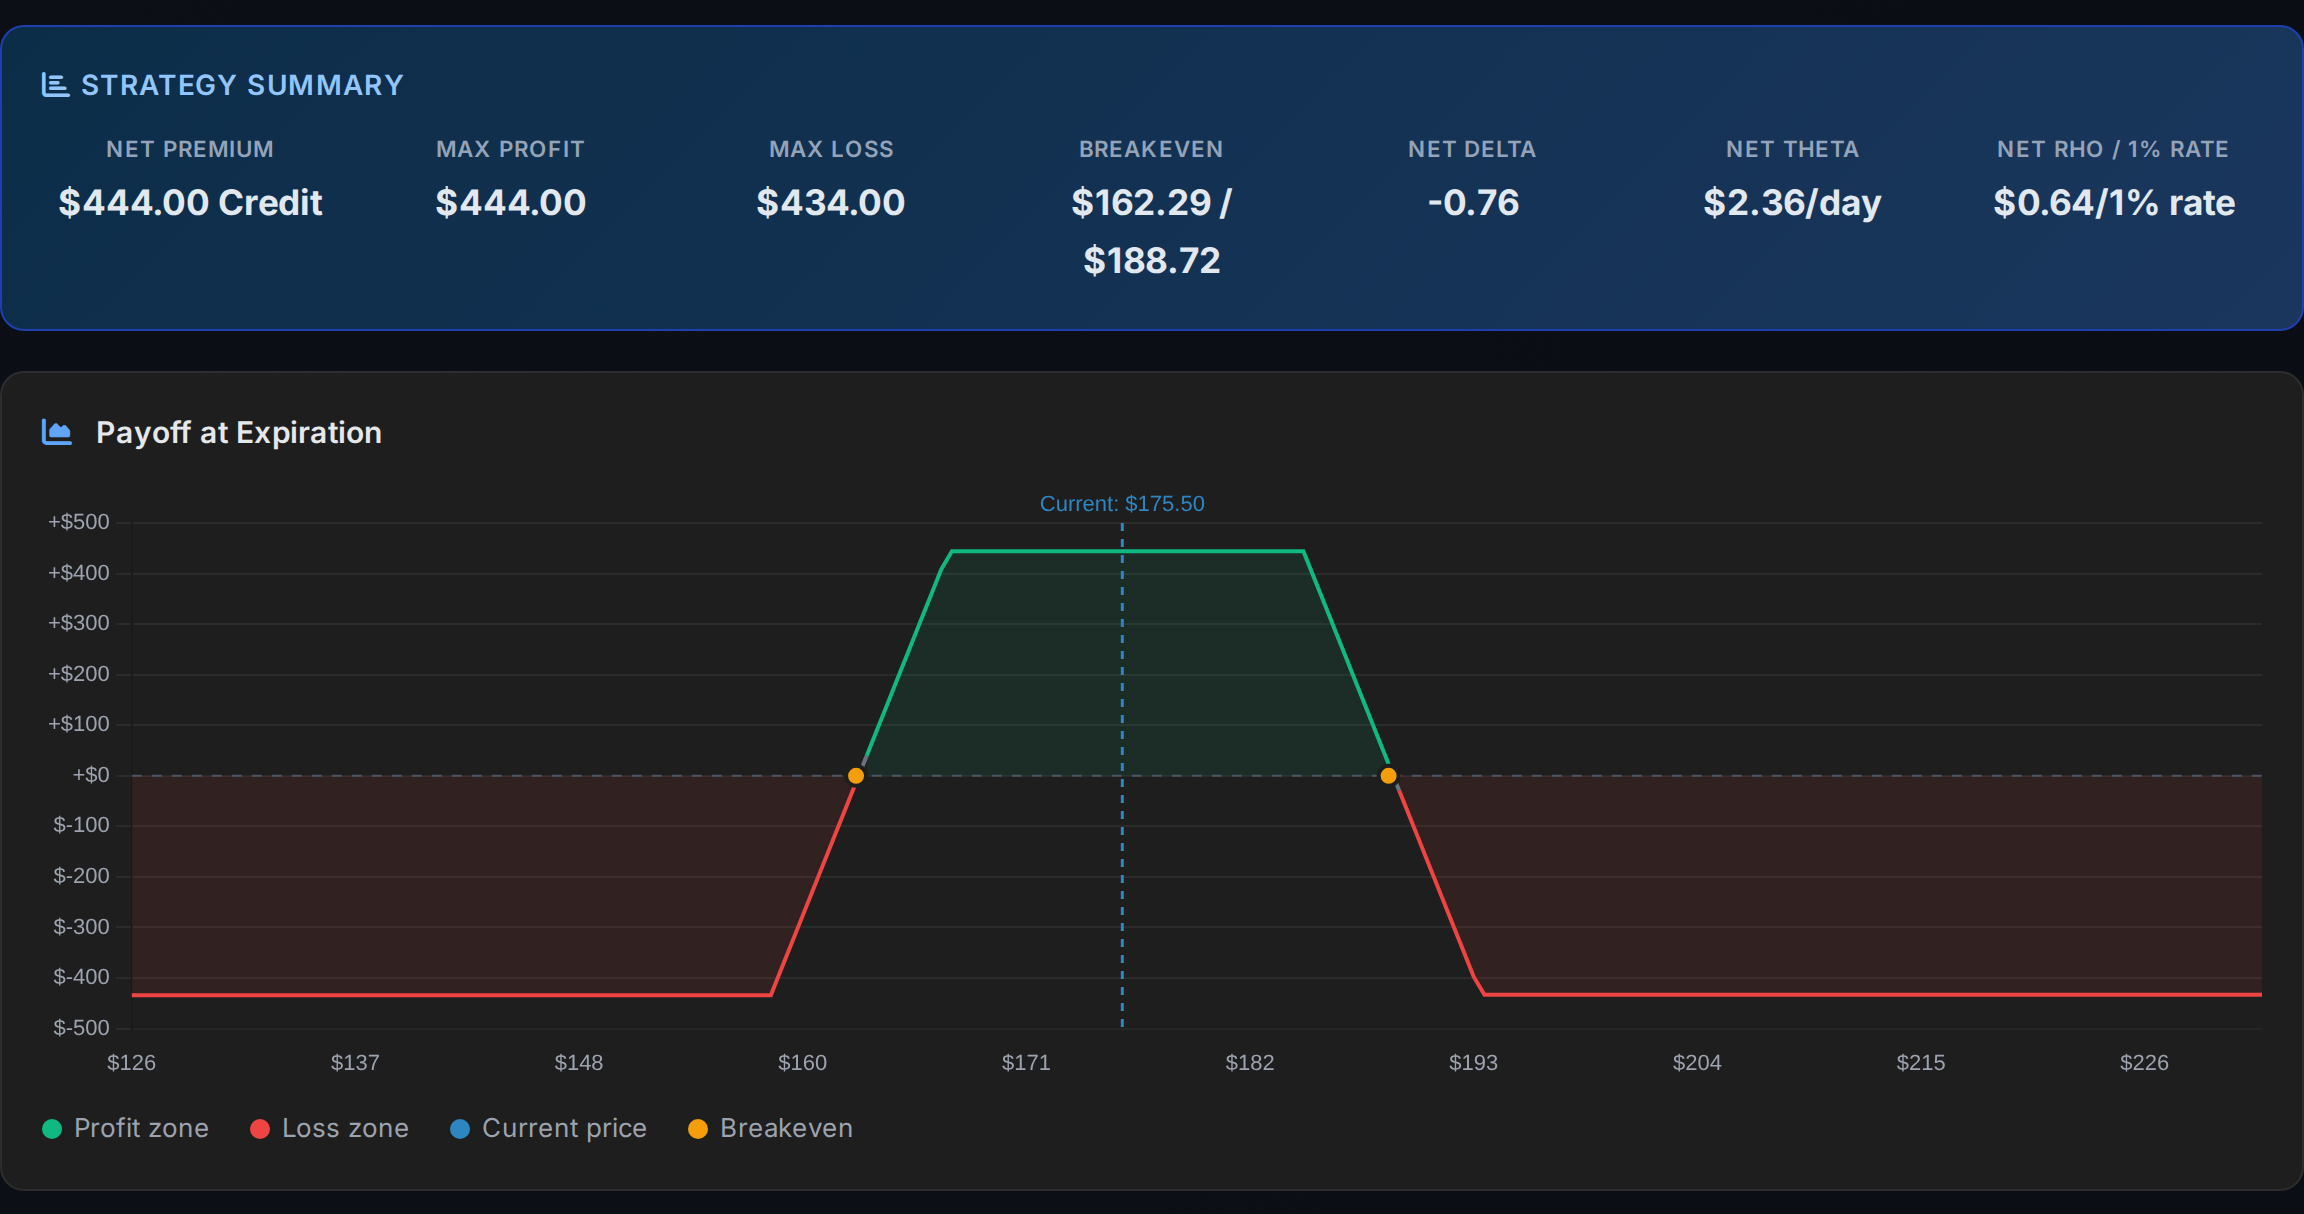
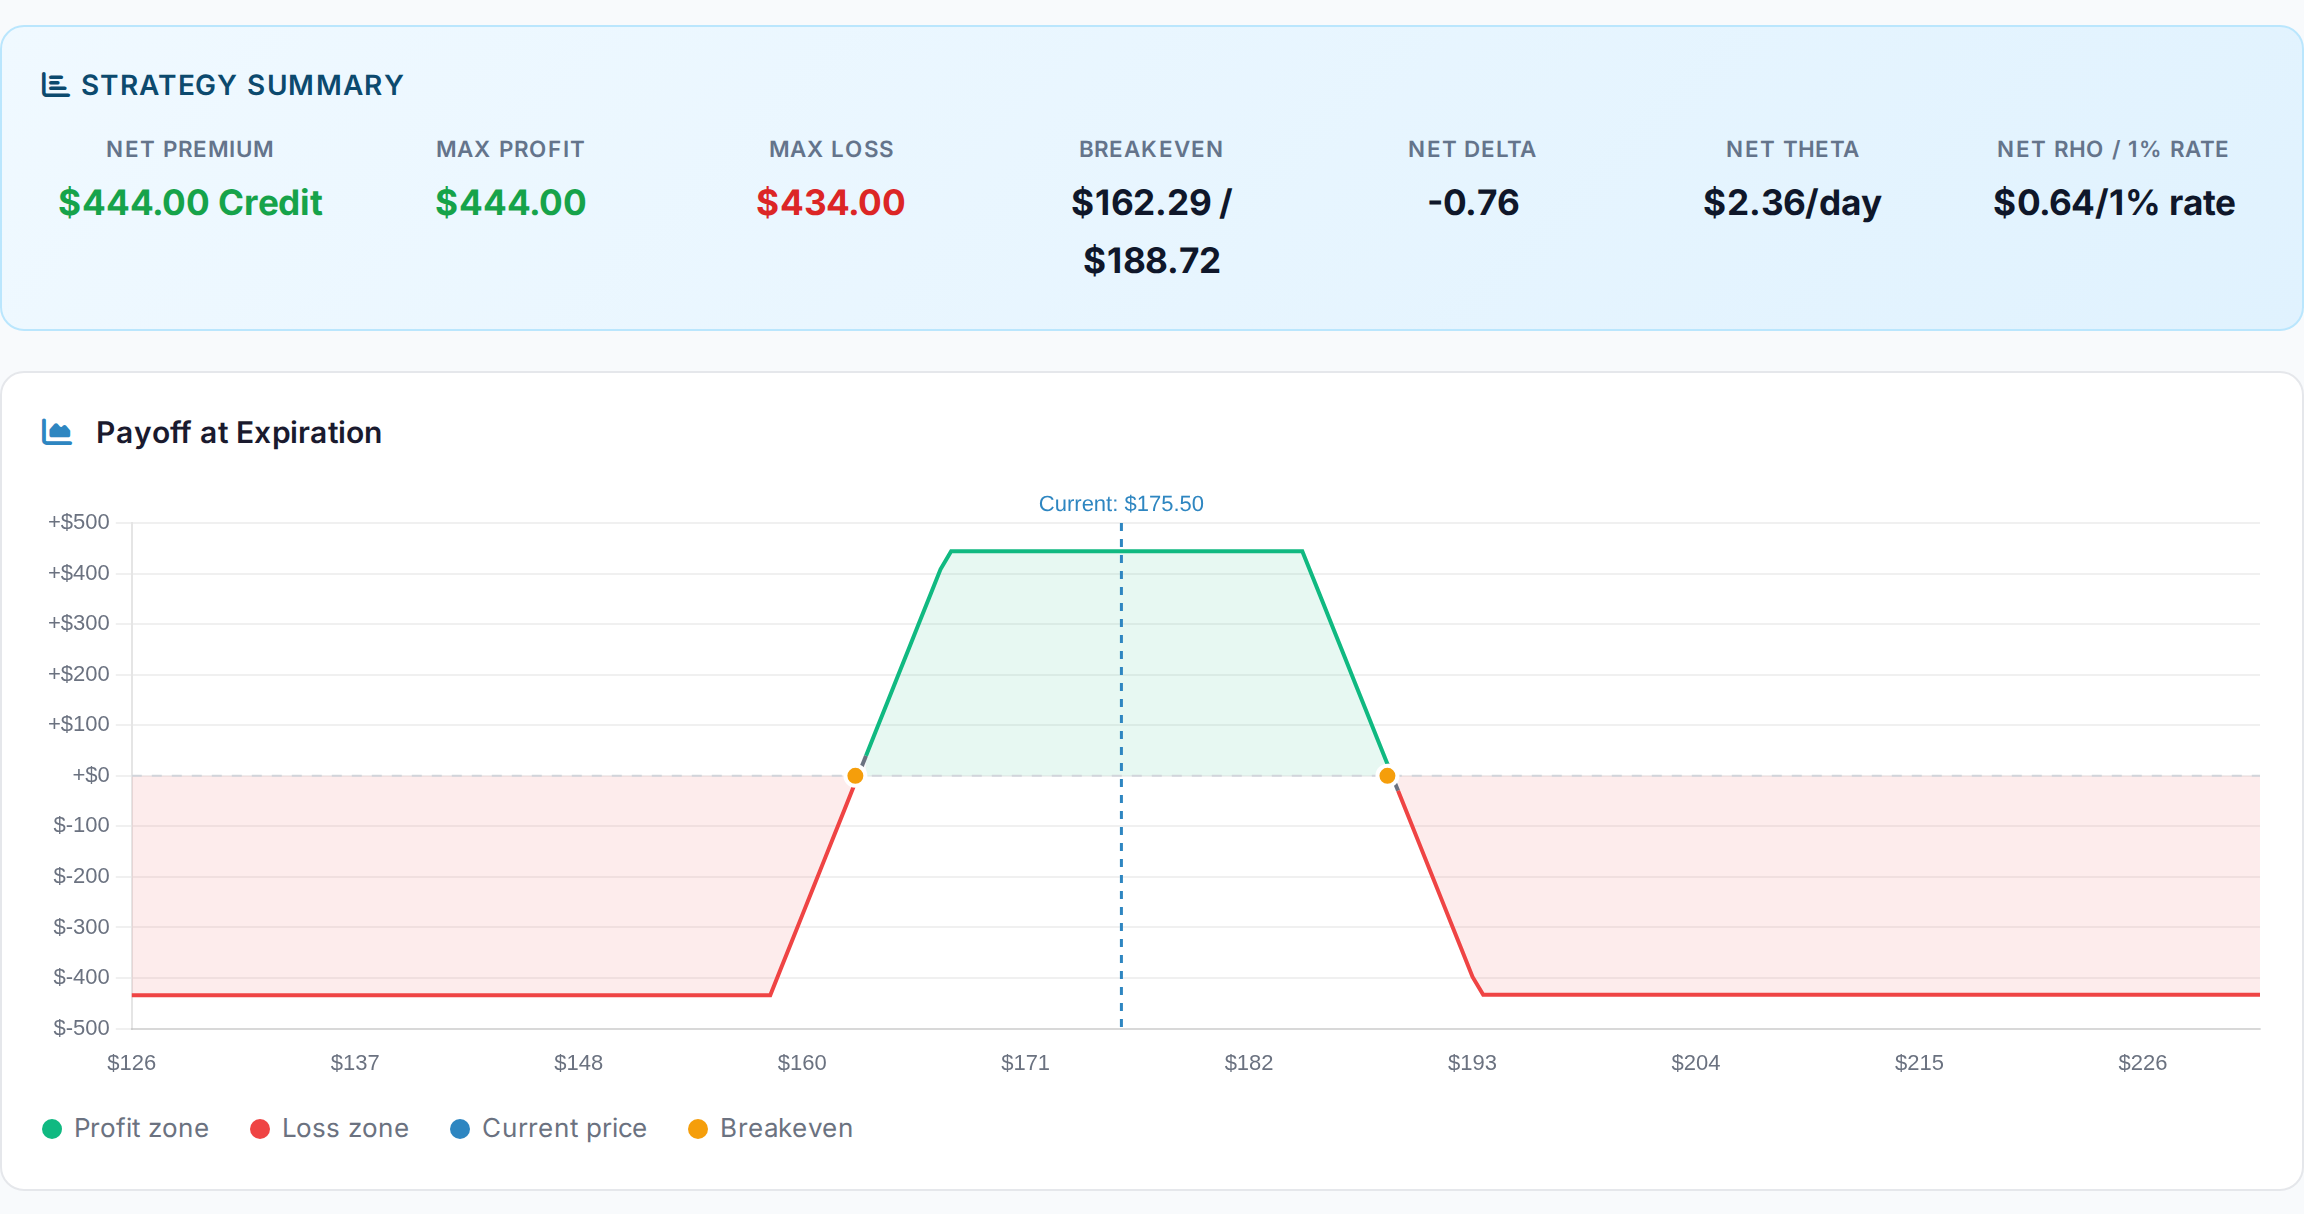
Build an iron condor, a spread or any mix of legs and see the premium, the most you can make and lose, both breakevens and the combined delta and theta, with the payoff at expiration drawn for you.
Try the payoff calculator
AllInvestView
Your options, their P&L and every wheel cycle
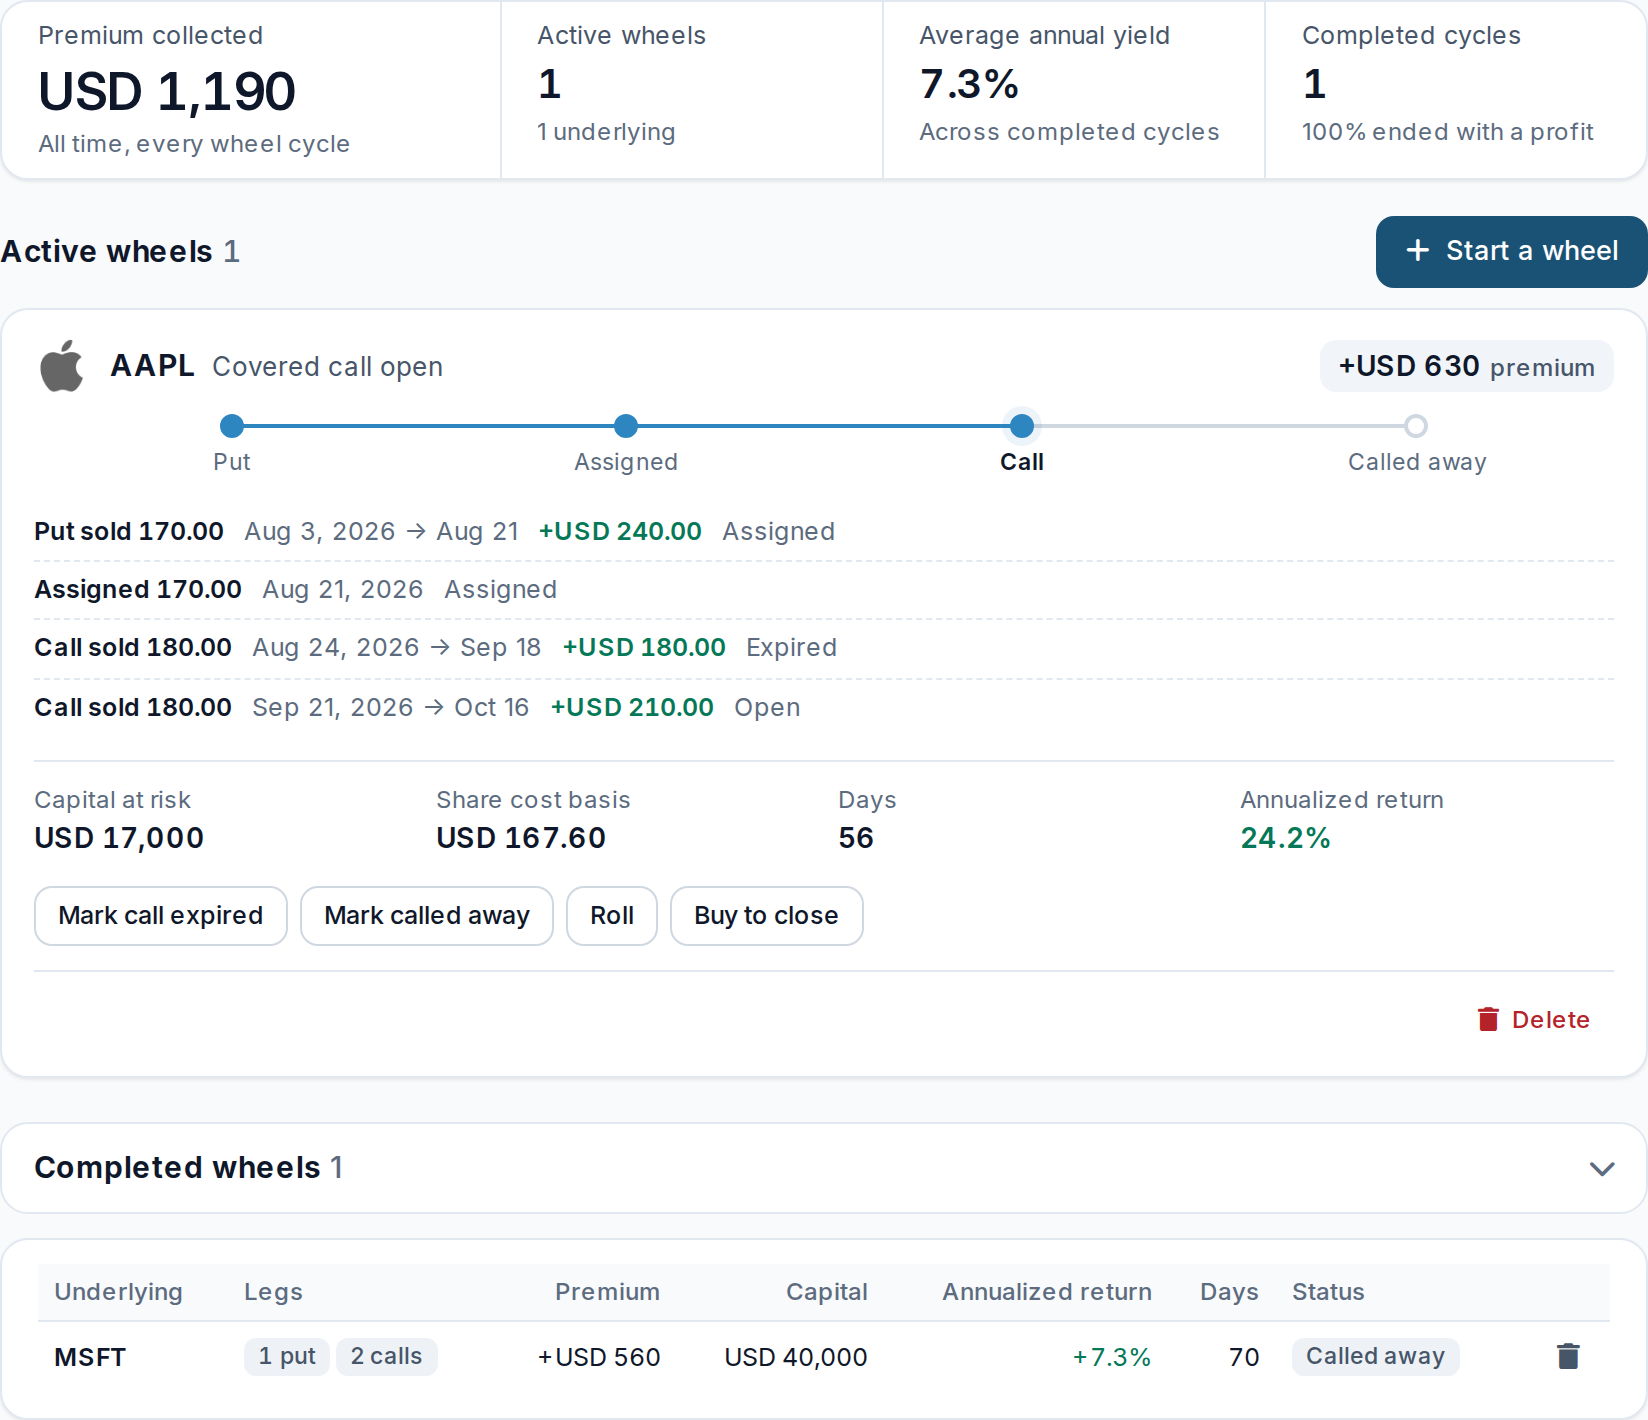
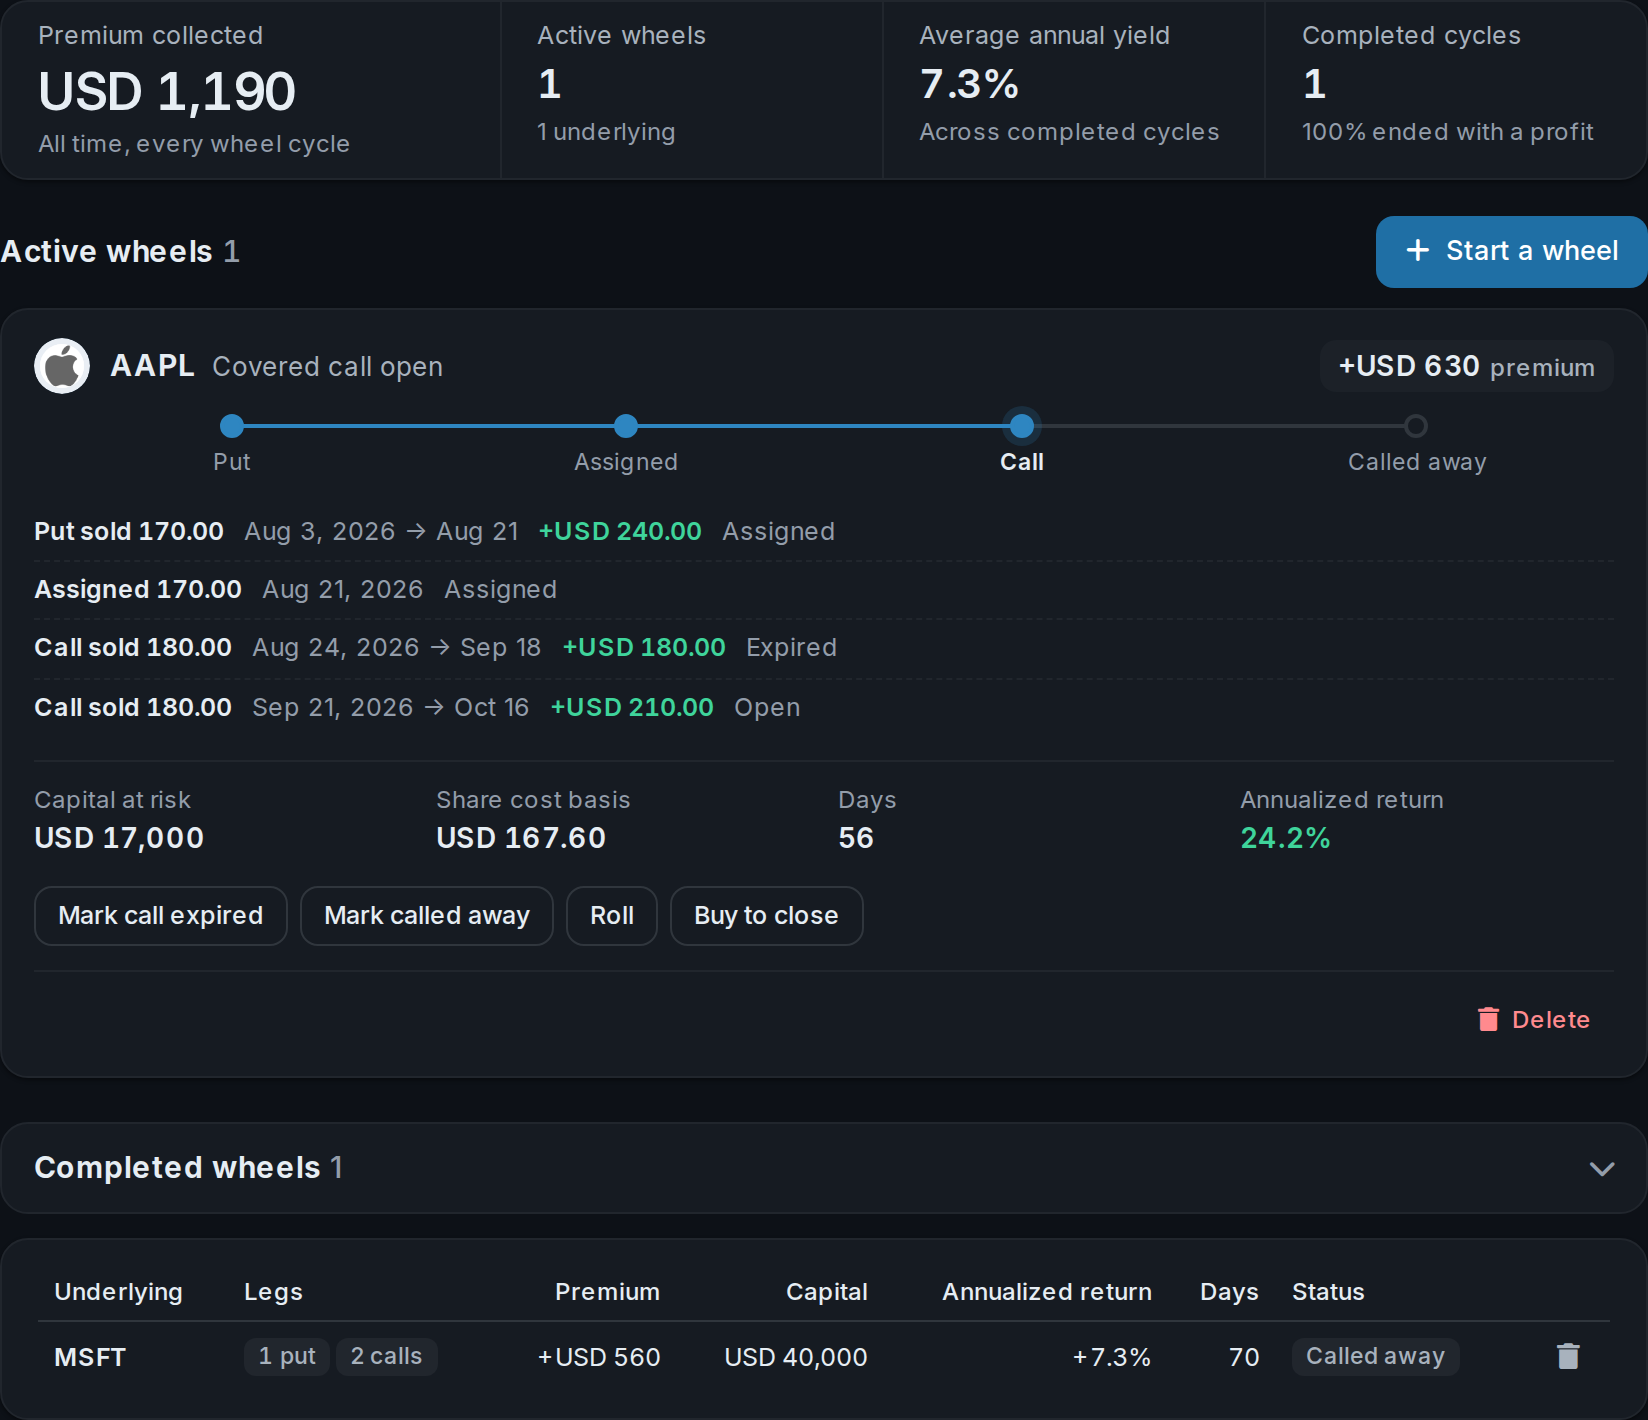
Open options show their delta and theta, closed trades keep their P&L and win rate, and assignments and covered calls are linked into one cycle, so you see the premium a stock has paid you and what the shares really cost after it.
See the wheel tracker
AllInvestView
Form 8949 and Schedule D, with wash sales caught across brokers
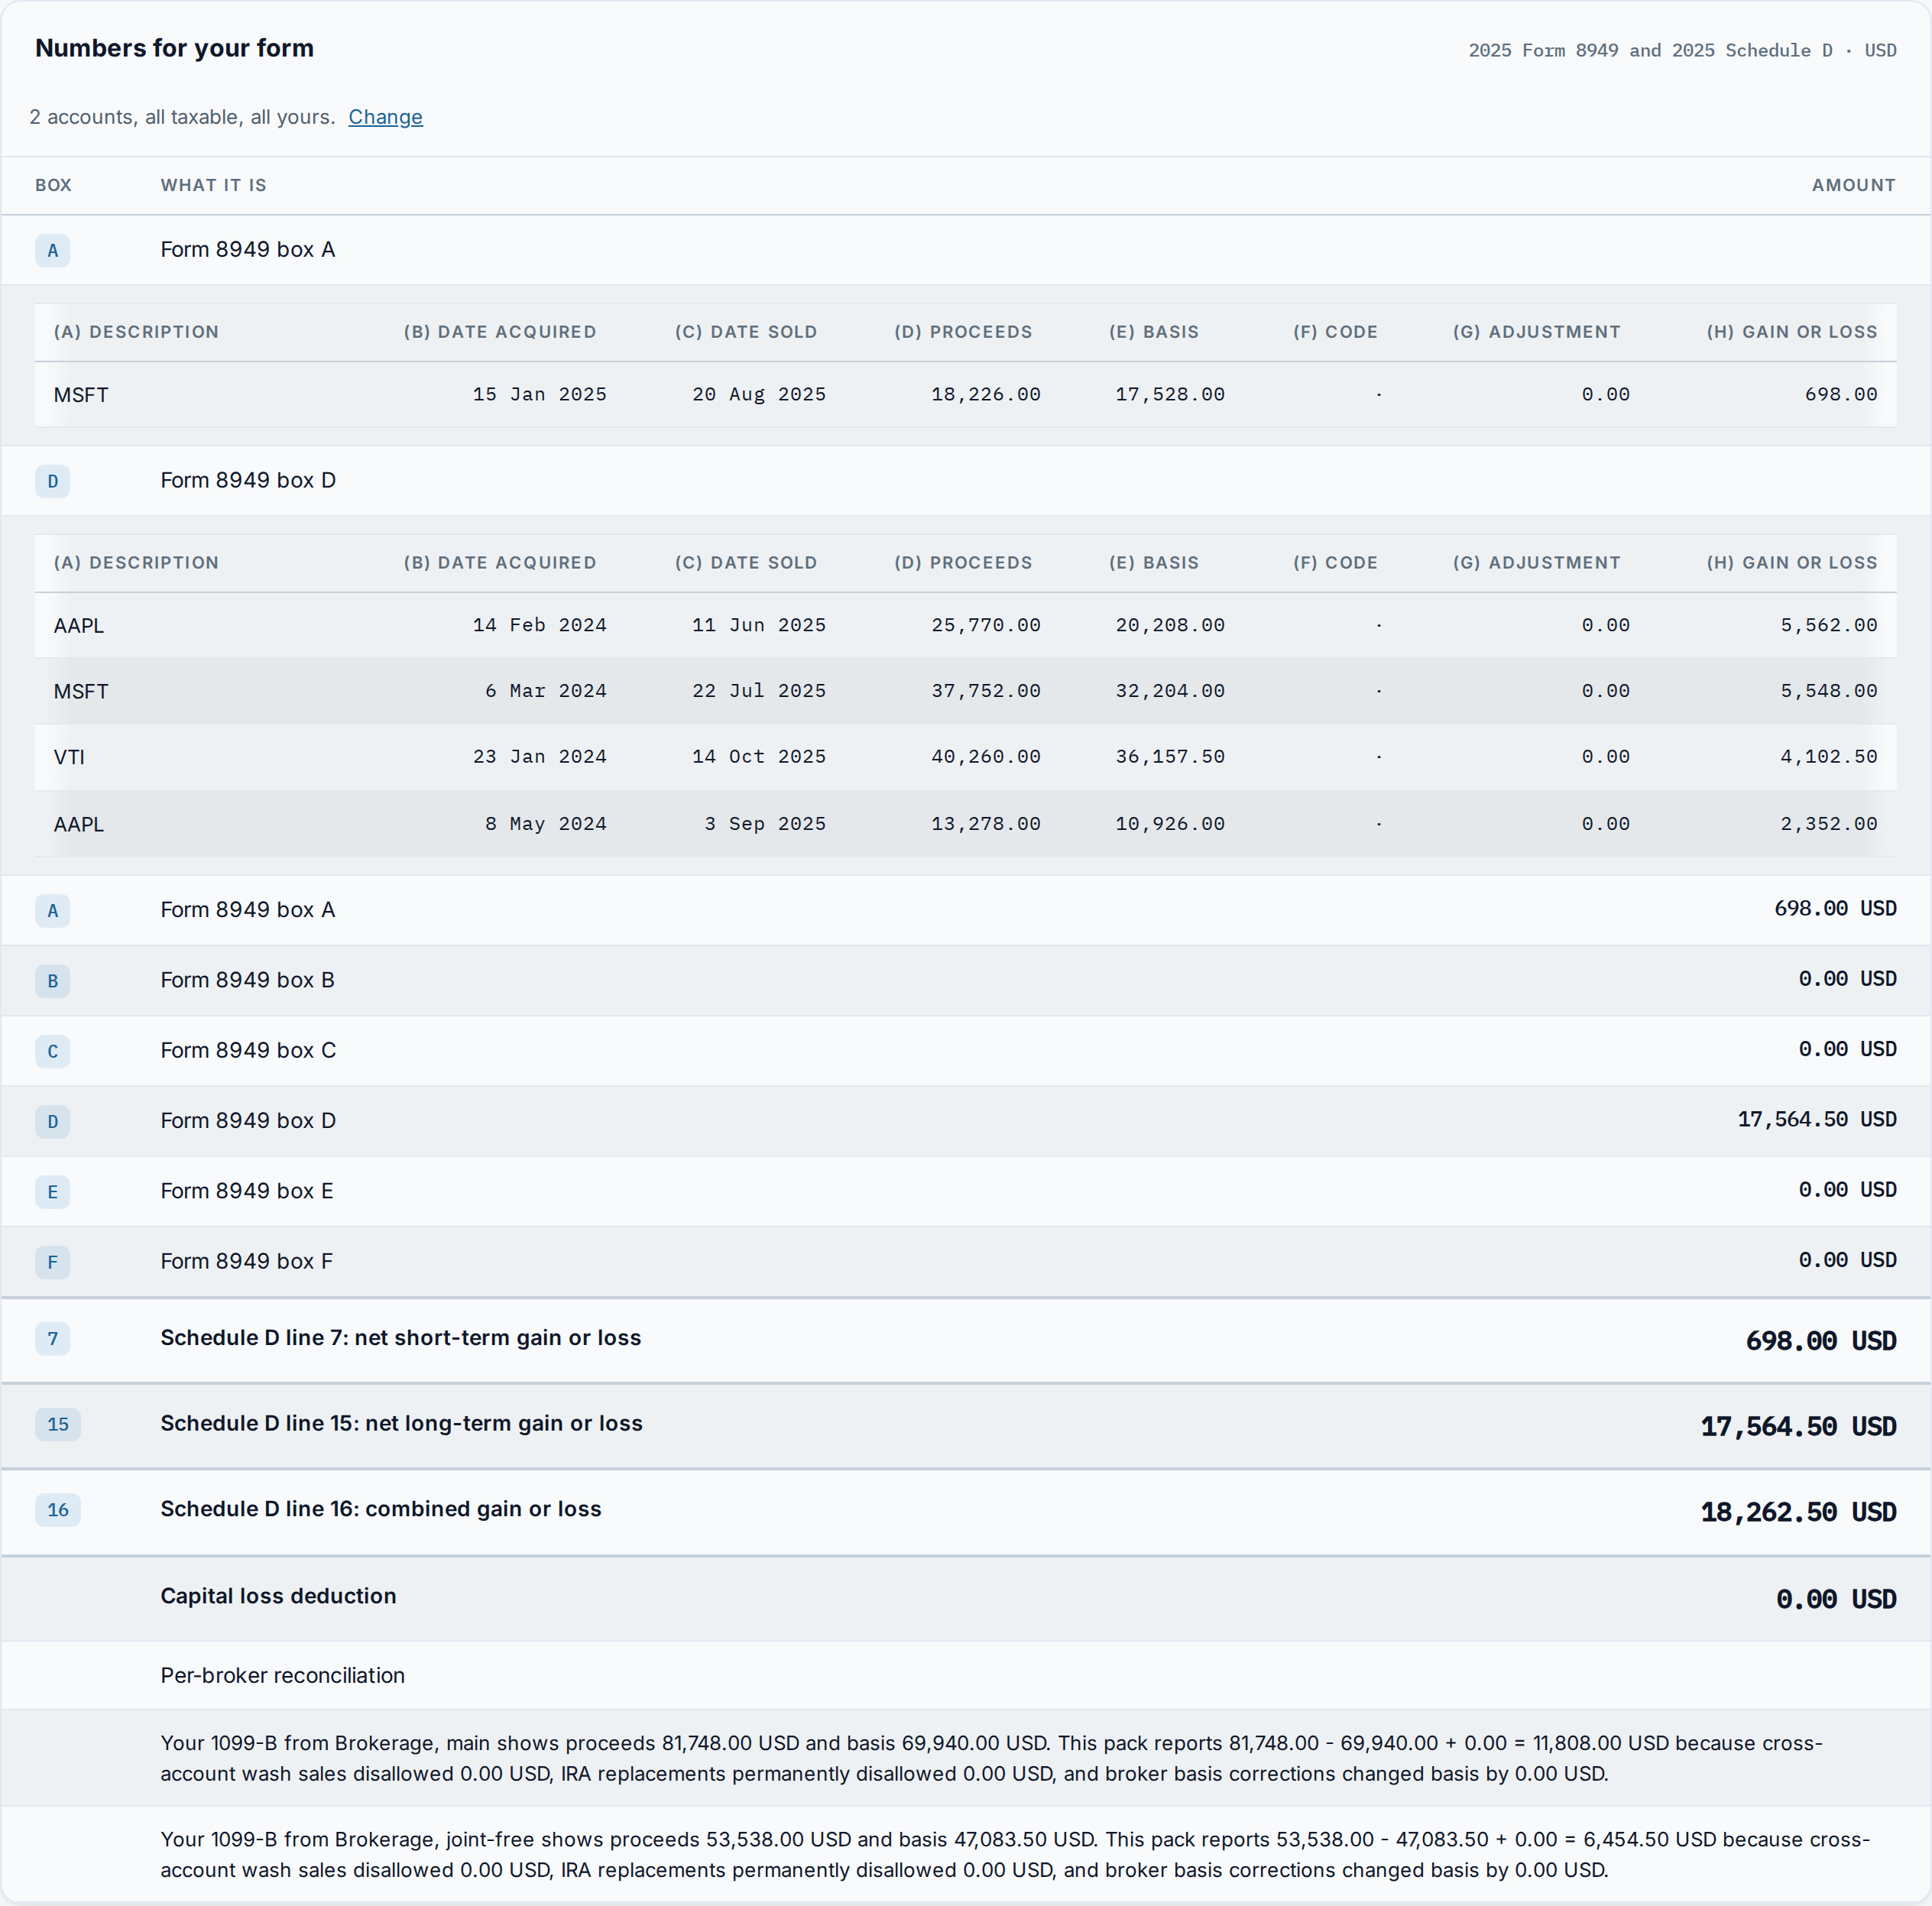
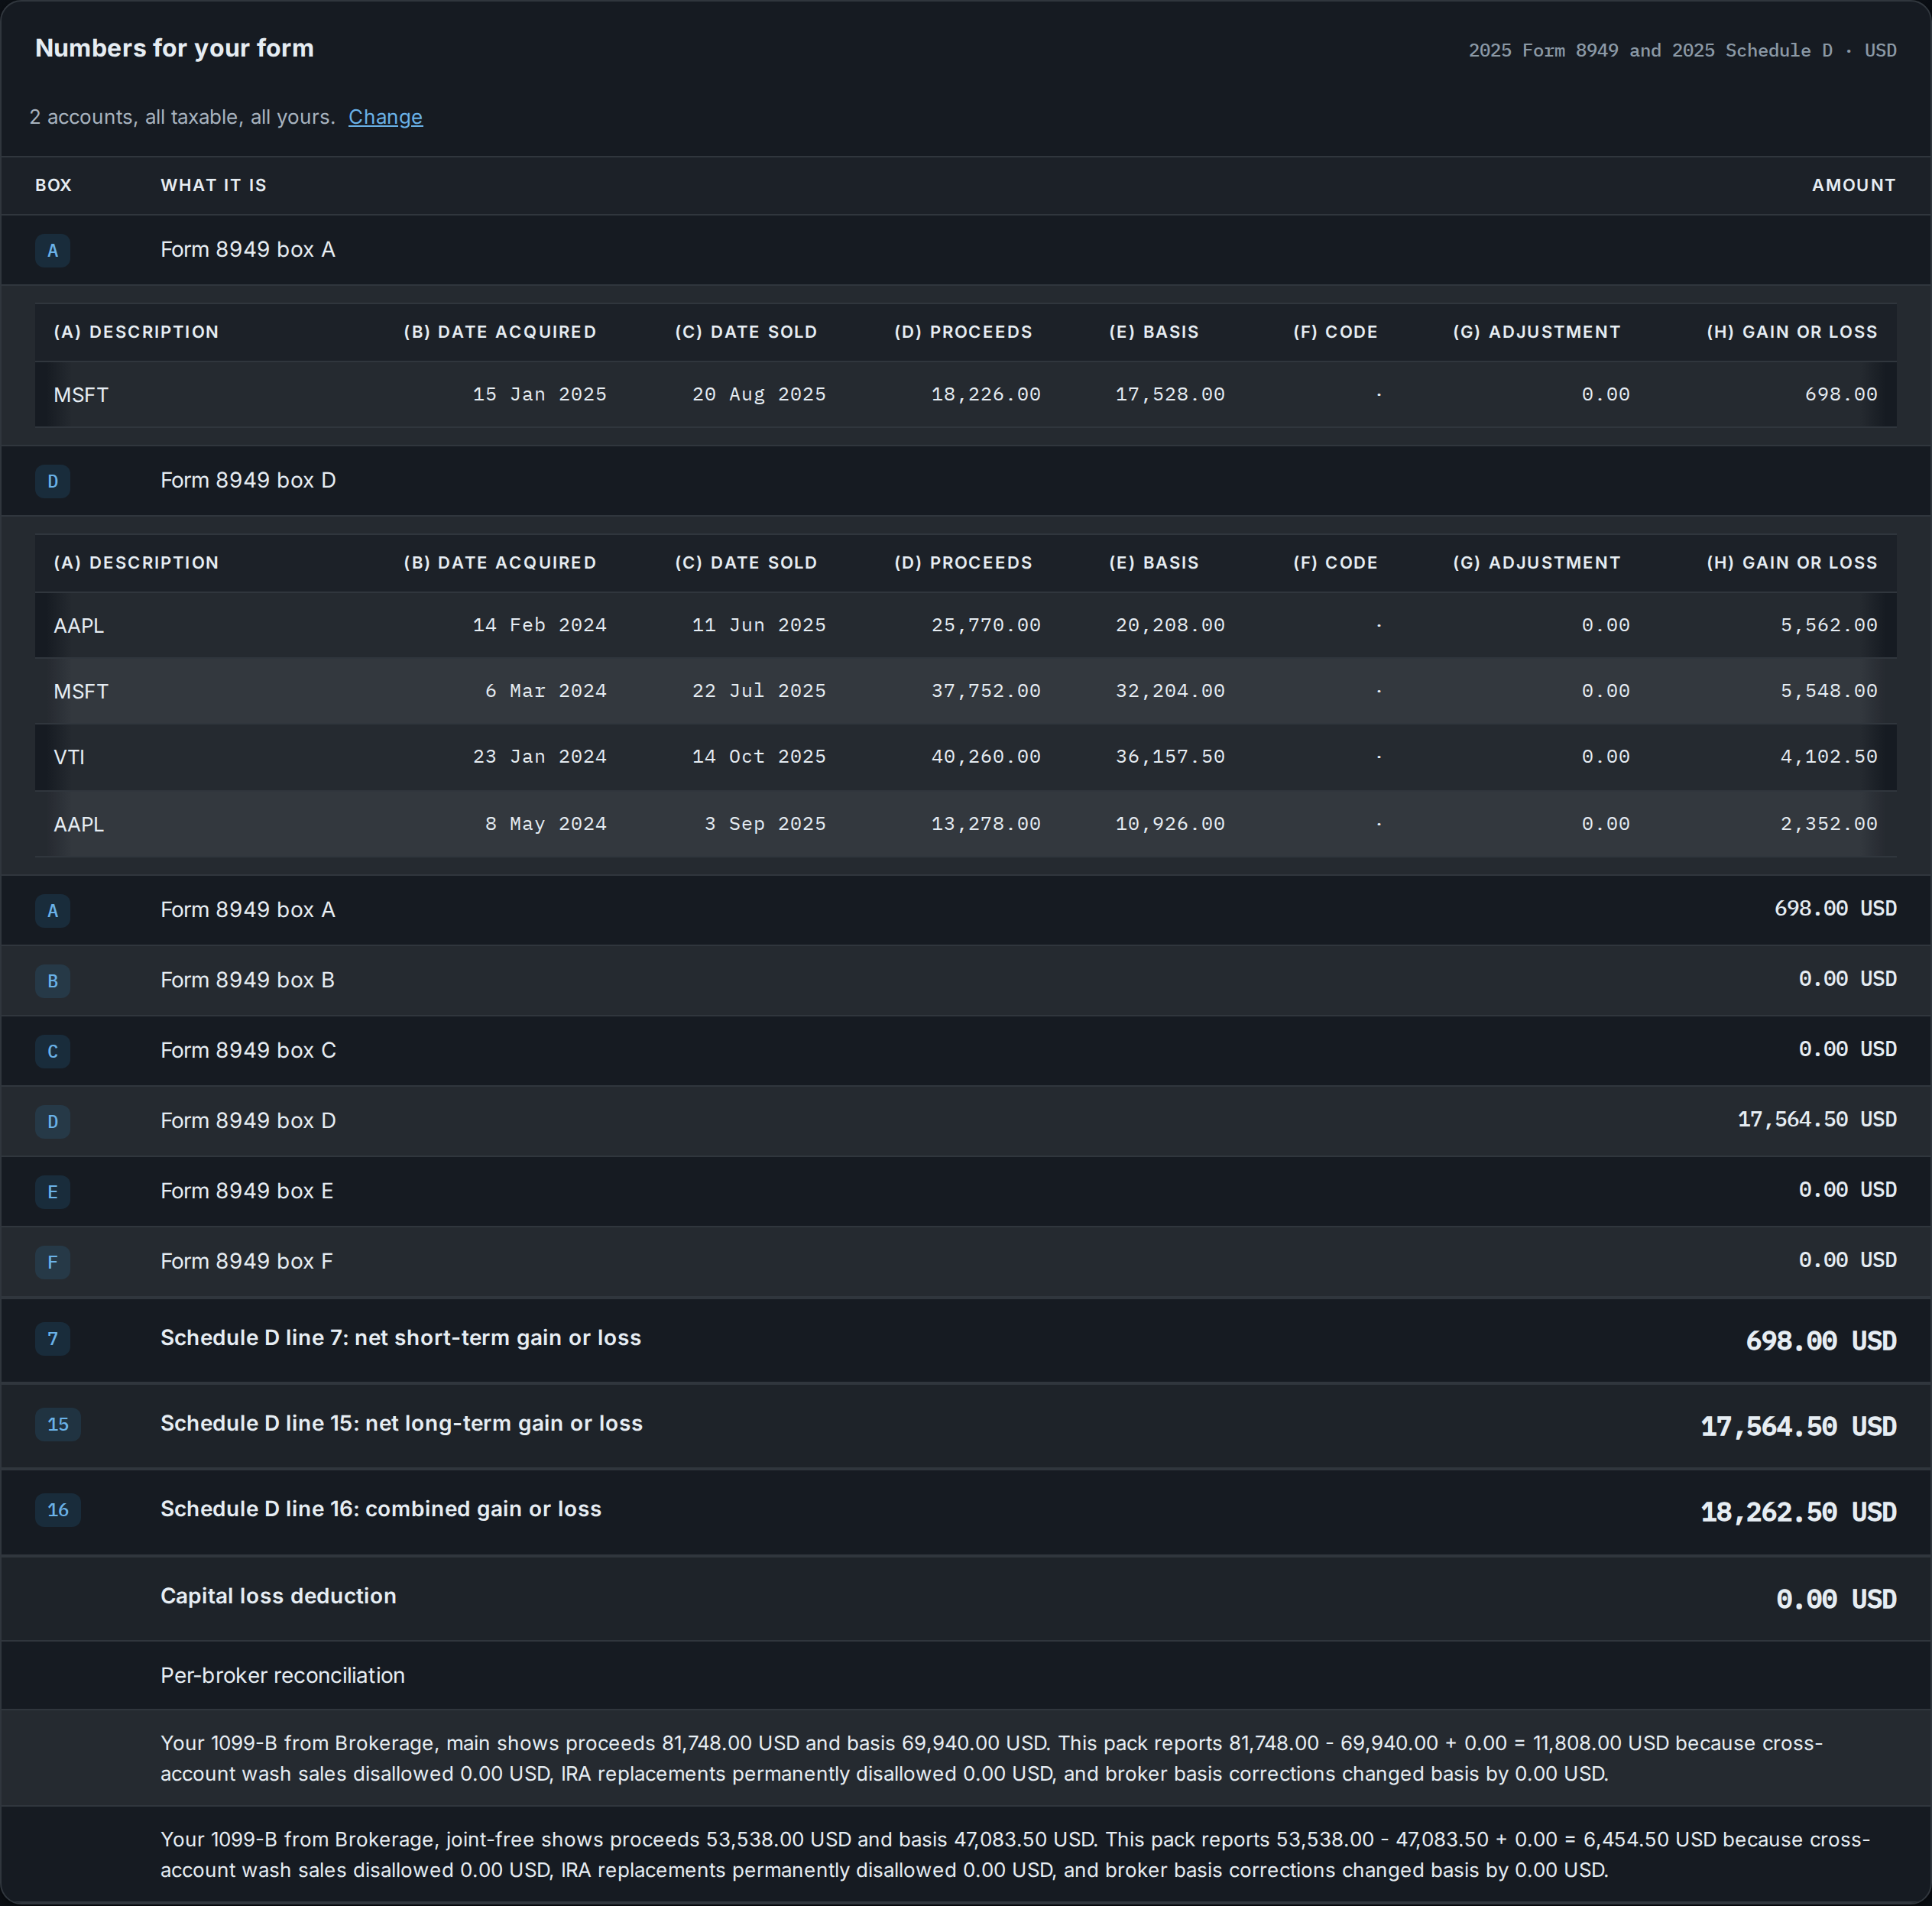
The US pack fills Form 8949 row by row and totals Schedule D from your stock and ETF sales. A loss you take at one broker and buy back at another within 30 days is flagged as a wash sale, which a single broker's 1099-B can't see.
See the US tax report
AllInvestView
Every trade from every broker in one record, options included
Connect Schwab, Interactive Brokers, Webull, tastytrade and more, or upload their history. AllInvestView keeps each lot at its cost, tracks your options and dividends, shows your return for any dates and works out the capital gains tax.
Questions about TradingView alternatives
What is the best free alternative to TradingView?
For charts, your broker's own platform: thinkorswim is free with a Schwab account and no minimum, and Webull and IBKR Desktop are free with theirs. Without a broker account, StockCharts and Koyfin have free charts. For keeping a record of your trades, AllInvestView is free for one portfolio of 10 holdings.
Is TradingView free?
Yes. Basic is free with ads, one chart per tab, two indicators per chart, three price alerts and one portfolio of 20 holdings. Paid plans are $14.95, $34.95, $69.95 and $239.95 a month, or $12.95 to $199.95 a month billed yearly. US stock prices on the free plan are real-time from Cboe; data from Nasdaq and NYSE is extra.
Which TradingView alternative finds chart patterns for me?
TrendSpider draws trendlines and Fibonacci levels for you, spots chart and candlestick patterns and backtests strategies without code. Standard is $89 a month, or $54 a month billed yearly. TradingView has auto chart patterns too, on Premium and Ultimate.
Can TradingView track options?
TradingView Portfolios holds stocks, funds, forex and crypto, not options, and it leaves out short sales and margin positions. AllInvestView tracks options with their Greeks, premium and wheel cycles, and you can try it for 14 days without a card.
Can I move my TradingView portfolio to AllInvestView?
Yes. The best file to bring is your broker's trade history, since it has the options and short sales TradingView Portfolios can't hold. Connect the broker from Starter, or upload its file on any plan. Your charts can stay in TradingView.
Can I keep charting in TradingView and track my trades in AllInvestView?
Yes. Plenty of traders chart in TradingView and keep the record of what they actually bought, sold and earned in AllInvestView, where every broker ends up in one place with the tax worked out.
Sources
Checked on 24 October 2026.
- TradingView pricing, plan prices, limits and portfolio sizes
- TradingView market data coverage, exchange data prices
- TradingView Help: Is US stock market data free by default?, Cboe real-time data
- TradingView Help: Portfolios overview, what Portfolios tracks
- TradingView Help: Why can't all asset types be added, supported asset classes
- TradingView Help: Types of transactions, short sales and margin
- TradingView Portfolios, broker linking through Plaid
- Schwab: thinkorswim, free with an account, no minimum
- Schwab: paperMoney, $100,000 virtual buying power
- Webull: subscription and fees, Premium price
- Webull charts and paper trading, free charts and simulator
- Interactive Brokers: IBKR Desktop, free platform
- Interactive Brokers: IBKR Desktop download, Windows, Mac and Linux
- Interactive Brokers: market data pricing, free Cboe One and IEX quotes
- TrendSpider pricing, Standard plan, outside promotions
- TC2000 pricing, Basic, Premium and Premium+
- StockCharts pricing, free charts and paid plans
- Koyfin pricing, plans, billed yearly
- Finviz Elite, Elite price and portfolios
- NinjaTrader pricing, free, monthly and lifetime plans
- MetaTrader 5 download, free platform and supported systems
Prices are in US dollars before tax and can differ in other countries and in the app stores. Features and prices change; each vendor's own page is the final word.