Best Finviz Alternatives in 2026
A Finviz portfolio takes your buys and sells and follows what the prices do. AllInvestView keeps those same positions as a financial record: cost basis per lot, realized and unrealized gain, the dividends actually received, and the return between any two dates you pick. Screening stays in Finviz. The record lives here.
About Finviz
Finviz is a stock screener and market visualisation site, known for its heat maps, its filter-heavy screener and a free tier that most traders reach for before anything else.
Who it suits: Traders and researchers who screen for candidates and want the positions they buy to become a proper record.
The alternatives

AllInvestView
Every buy and sell you log in a Finviz portfolio fits here, typed or imported. Those rows then give a cost basis per lot, each dividend paid to you and a year-end tax figure, with bonds and options alongside.
TradingView
TradingView covers the charts Finviz users reach for next, and since June 2025 it keeps Portfolios too. You import or type buys, sells and deposits, then compare against an index with beta, Sharpe and Sortino. There's no broker connection yet.
Stock Rover
Stock Rover sits between a Finviz screen and a tracker. The deep screener is on the paid tiers, and even a free account connects to your brokerage, so the positions you buy keep themselves current.
Koyfin
Koyfin is the step up from Finviz for fundamentals, estimates and macro data, laid out in dashboards you configure. My Portfolio takes holdings by hand or by CSV, and advanced portfolio analytics are on Premium.
Snowball Analytics
For Finviz users who screen on dividend yield, Snowball Analytics keeps the record of what was actually paid. Each payer's dividends land on a calendar, next year's income is projected, and a rating scores the dividend on 13 fundamental indicators.
| Platform | Key Features | Pricing |
|---|---|---|
|
|
One of the strongest free stock screeners anywhere, Market heat maps by sector and industry, Insider trades and SEC filings in the same place, One portfolio of up to 20 holdings on the free plan (Elite: 100 portfolios of 500) | Free plan with delayed data; Elite at $39.50/month or $299.50/year |
|
AllInvestView
|
Automatic portfolio tracking, AI-powered insights, Tax optimization & reporting, Fixed income tracking, Options pricing & analytics, Dividend tracker & forecasting, Broker sync integration, Multi-currency support, Community-driven development | Free plan available, plans from $6.99/month (Lifetime deal available) |
|
|
Best-in-class charting, Social trading community, Screeners and alerts, Multi-asset support, Paper trading | Free Basic with ads; Essential $14.95/month, Plus $34.95, Premium $69.95, Ultimate $239.95 |
|
|
Advanced stock screener, Comprehensive fundamental data, Portfolio analytics and rebalancing, Dividend tracking and projections, Brokerage integration | Free plan; paid from $29/month ($348/year), up to $149/month |
|
|
Deep global fundamentals, estimates and macro data, Dashboards and charting you configure yourself, Portfolio holdings on desktop and mobile, synced, Generous free tier for research | Free plan; Plus $39/month, Premium $79/month, advisor tiers from $209/month |
|
|
Dividend calendar, ex-dates and forecasting, Dividend Rating on 13 fundamentals, Automatic broker sync across more than 1,000 institutions, Fund X-Ray on Analytics since July 2025 | Free tier (1 portfolio, 10 holdings); paid plans from $7.99/month or $79.99/year, up to $24.99/month or $249.99/year |
Asset and reporting coverage. ✓ = full native support · ● = partial or manual · × = not supported.
| Tool | Stocks / ETFs | Bonds | Options | Crypto | Custom assets | Dividend tracking | Multi-currency | Broker sync | CGT reports | Free tier | Mobile app | Advisor features |
|---|---|---|---|---|---|---|---|---|---|---|---|---|
| AllInvestView | ✓ | ✓ | ✓ | ✓ | ✓ | ✓ | ✓ | ✓ | ✓ | ✓ | ✓ | ✓ |
| Snowball Analytics | ✓ | ● | ● | ● | ● | ✓ | ✓ | ✓ | ● | ✓ | ✓ | × |
Our pick, and why
#1 Finviz Alternative
AllInvestView
Portfolio tracking, analysis and tax reports
AllInvestView turns the tickers you found in Finviz into a portfolio with a cost basis, a real return and a tax figure at the end of the year.
Our take: Keep Finviz for screening. It is very good at it and the free plan is generous. Bring the positions you actually buy into AllInvestView, where each lot carries its cost basis, the return is calculated for any period you choose, dividends are recorded as they were paid, and the year ends with a tax report rather than a spreadsheet.
Where that shows up against Finviz
The return, not just the price move
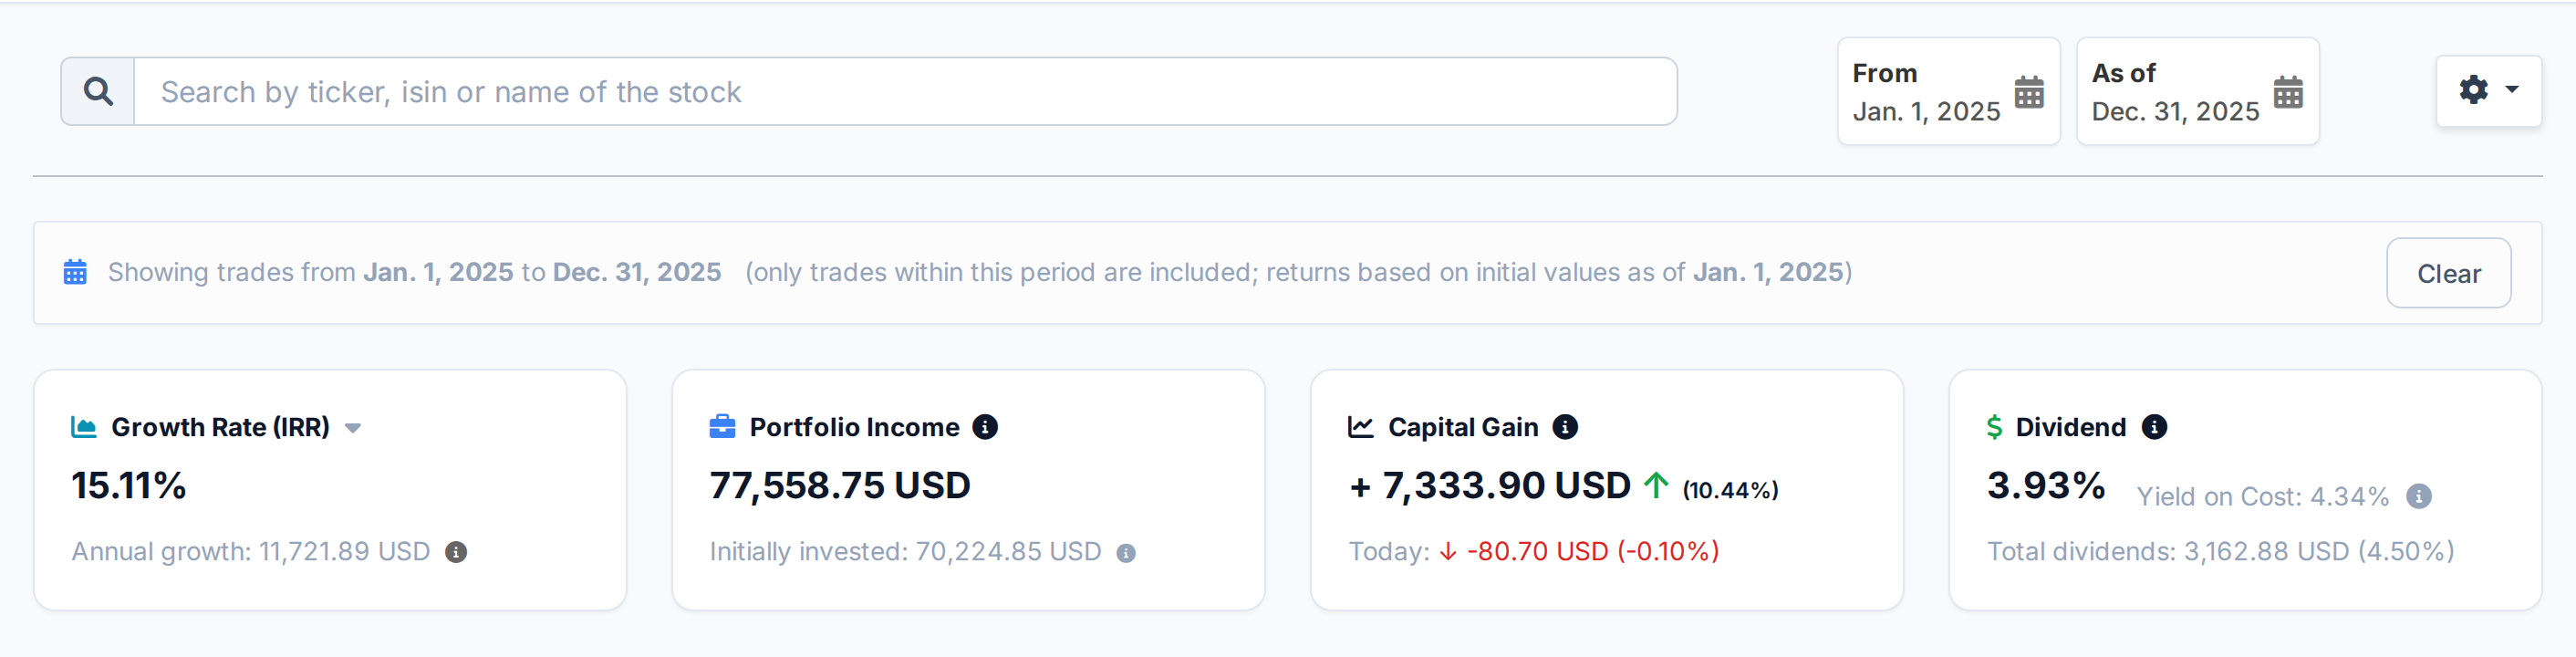
A Finviz portfolio takes the ticker, the date, the price and the share count, then follows the price from there. AllInvestView takes the same rows and answers a different question: what did this actually return, counting the money you put in and took out along the way.
Pick any two dates and the portfolio is recalculated for that window, with a money-weighted return, the capital gain in currency and the dividend yield over the period. You can also value the portfolio as it stood on a past date, using the holdings and weights you had then instead of the ones you have now.
 AllInvestView
What you already own inside the funds
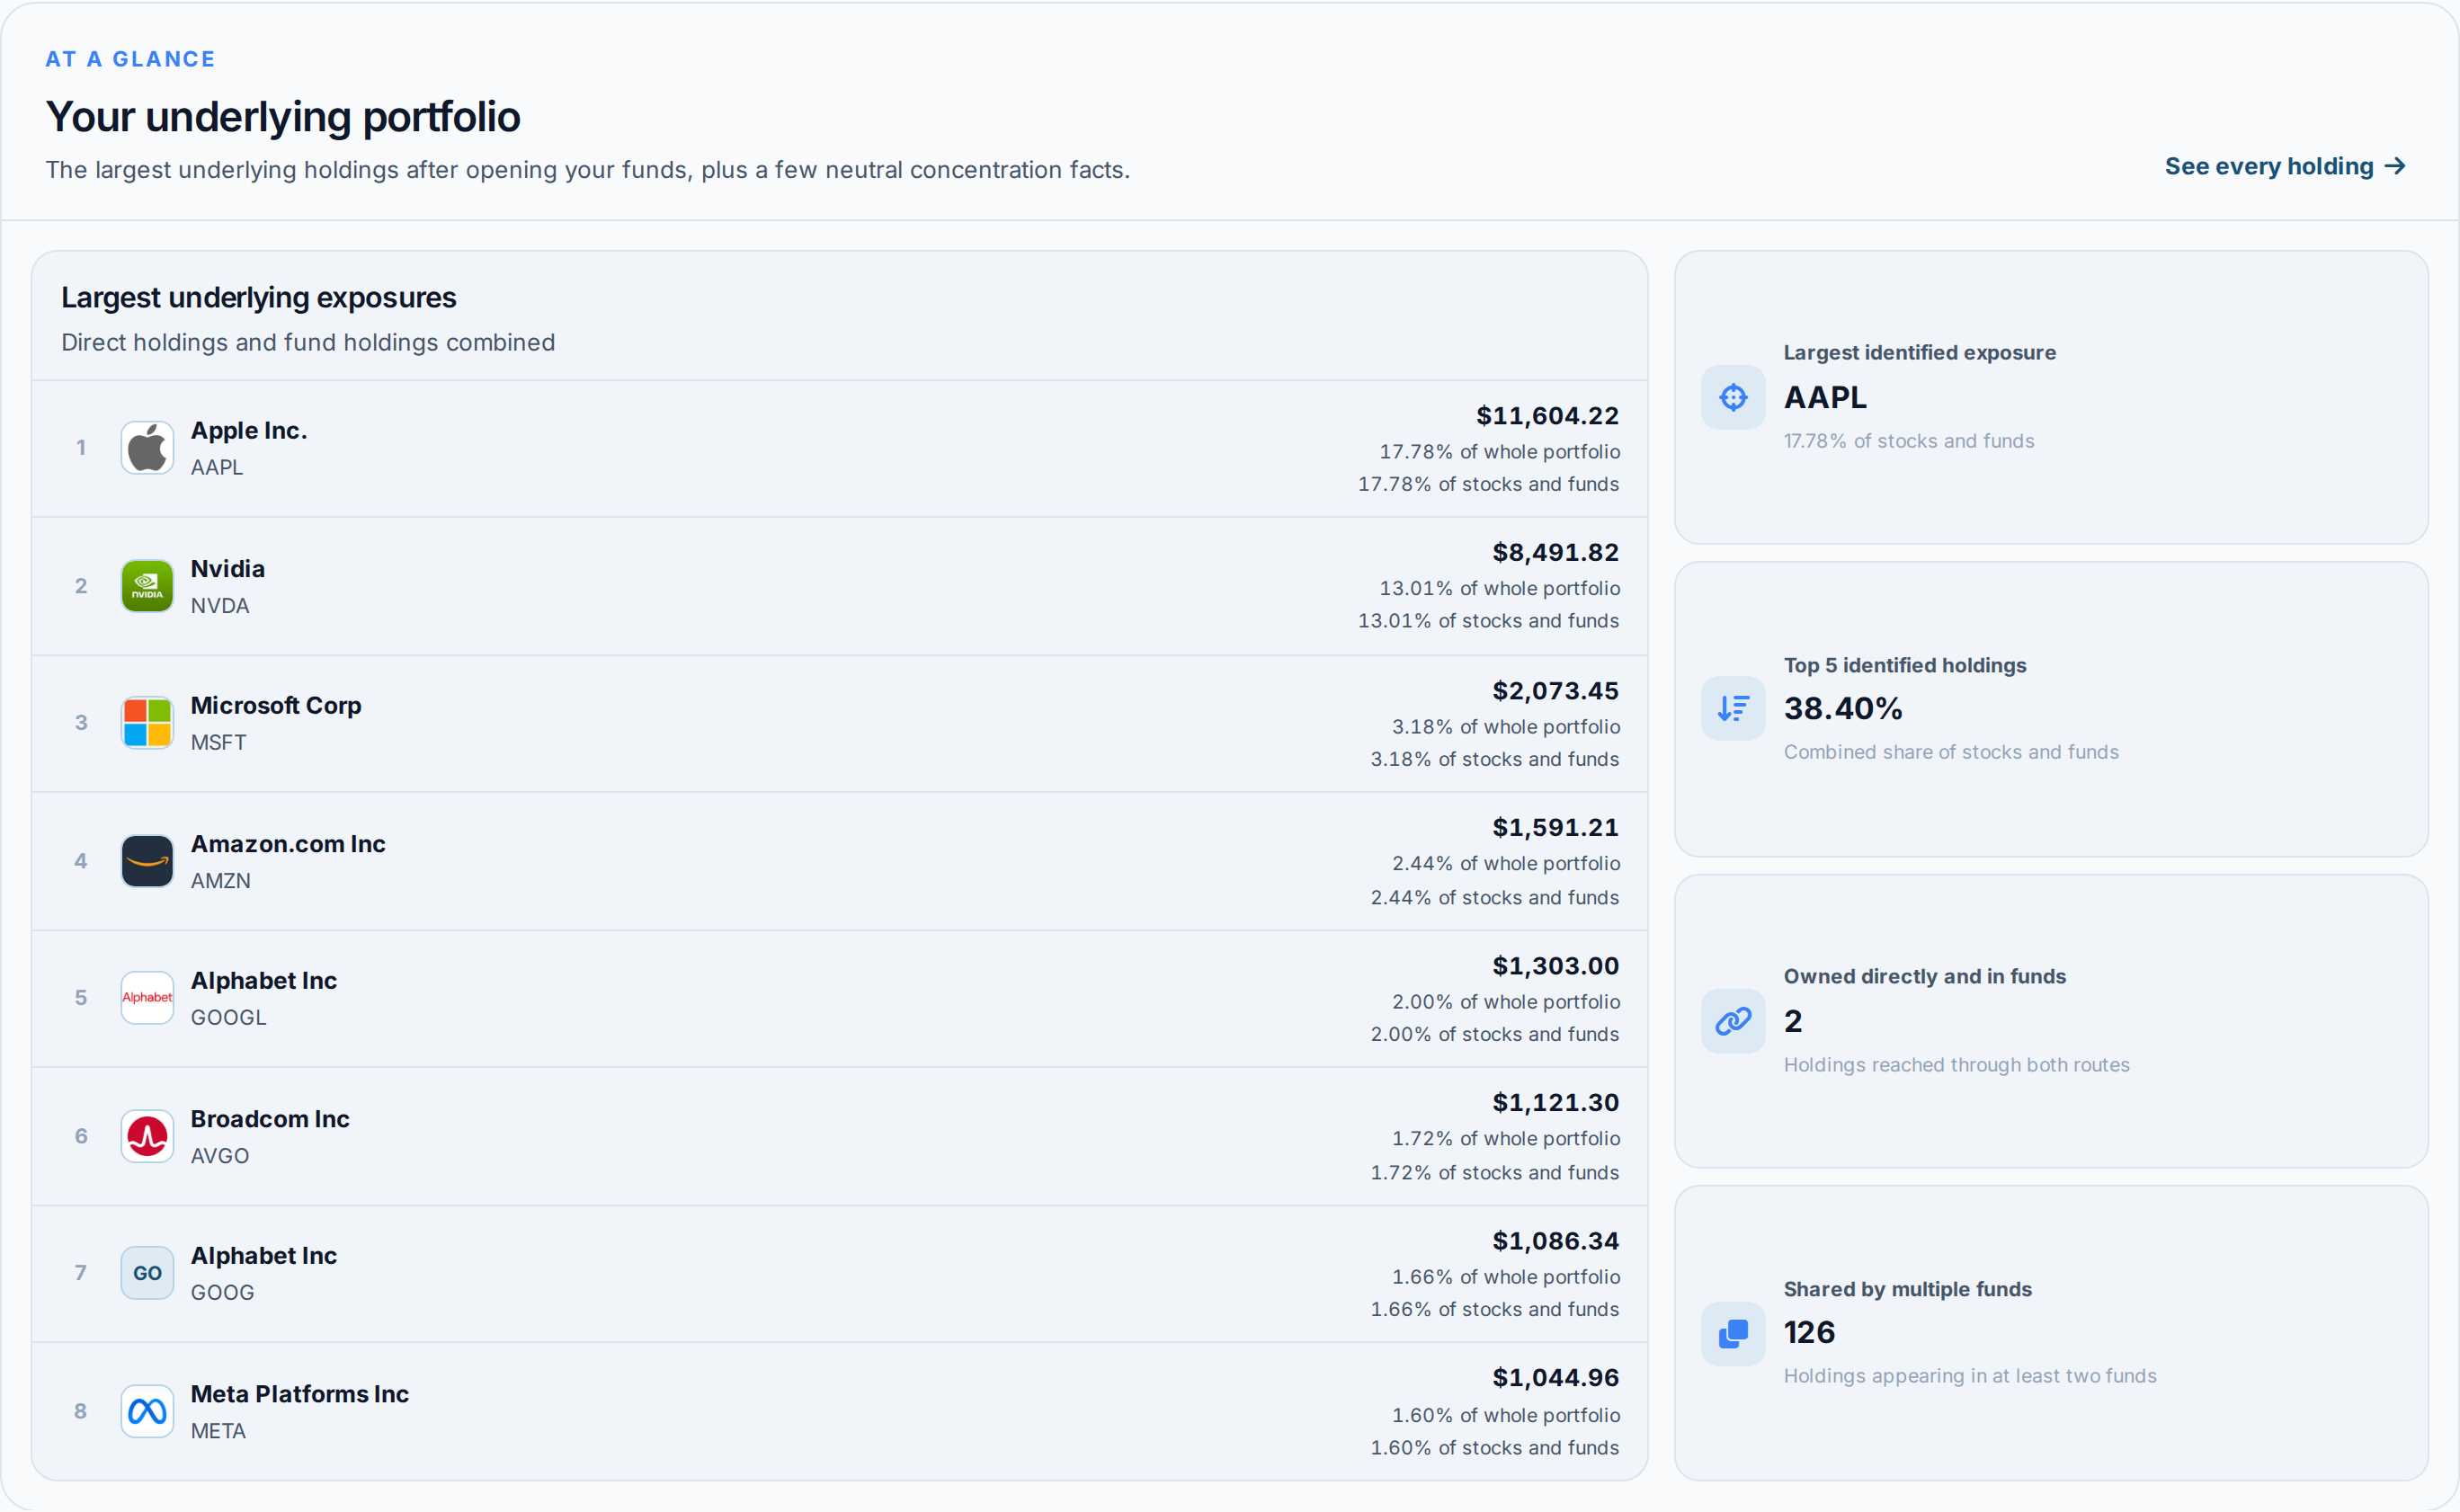
A screener finds you a company. It cannot tell you that you own it three times over already, sitting inside the ETFs in your account. Portfolio X-Ray opens the funds you hold and returns one row per underlying company, combining what you hold directly with what each fund holds for you.
It names the funds behind each position, measures how much those funds overlap one another, and gives the top-five concentration across your stocks and funds. The result exports to CSV. The assistant can screen against it too, so a search for candidates can exclude what you are already exposed to.
 AllInvestView
Every dividend you were actually paid
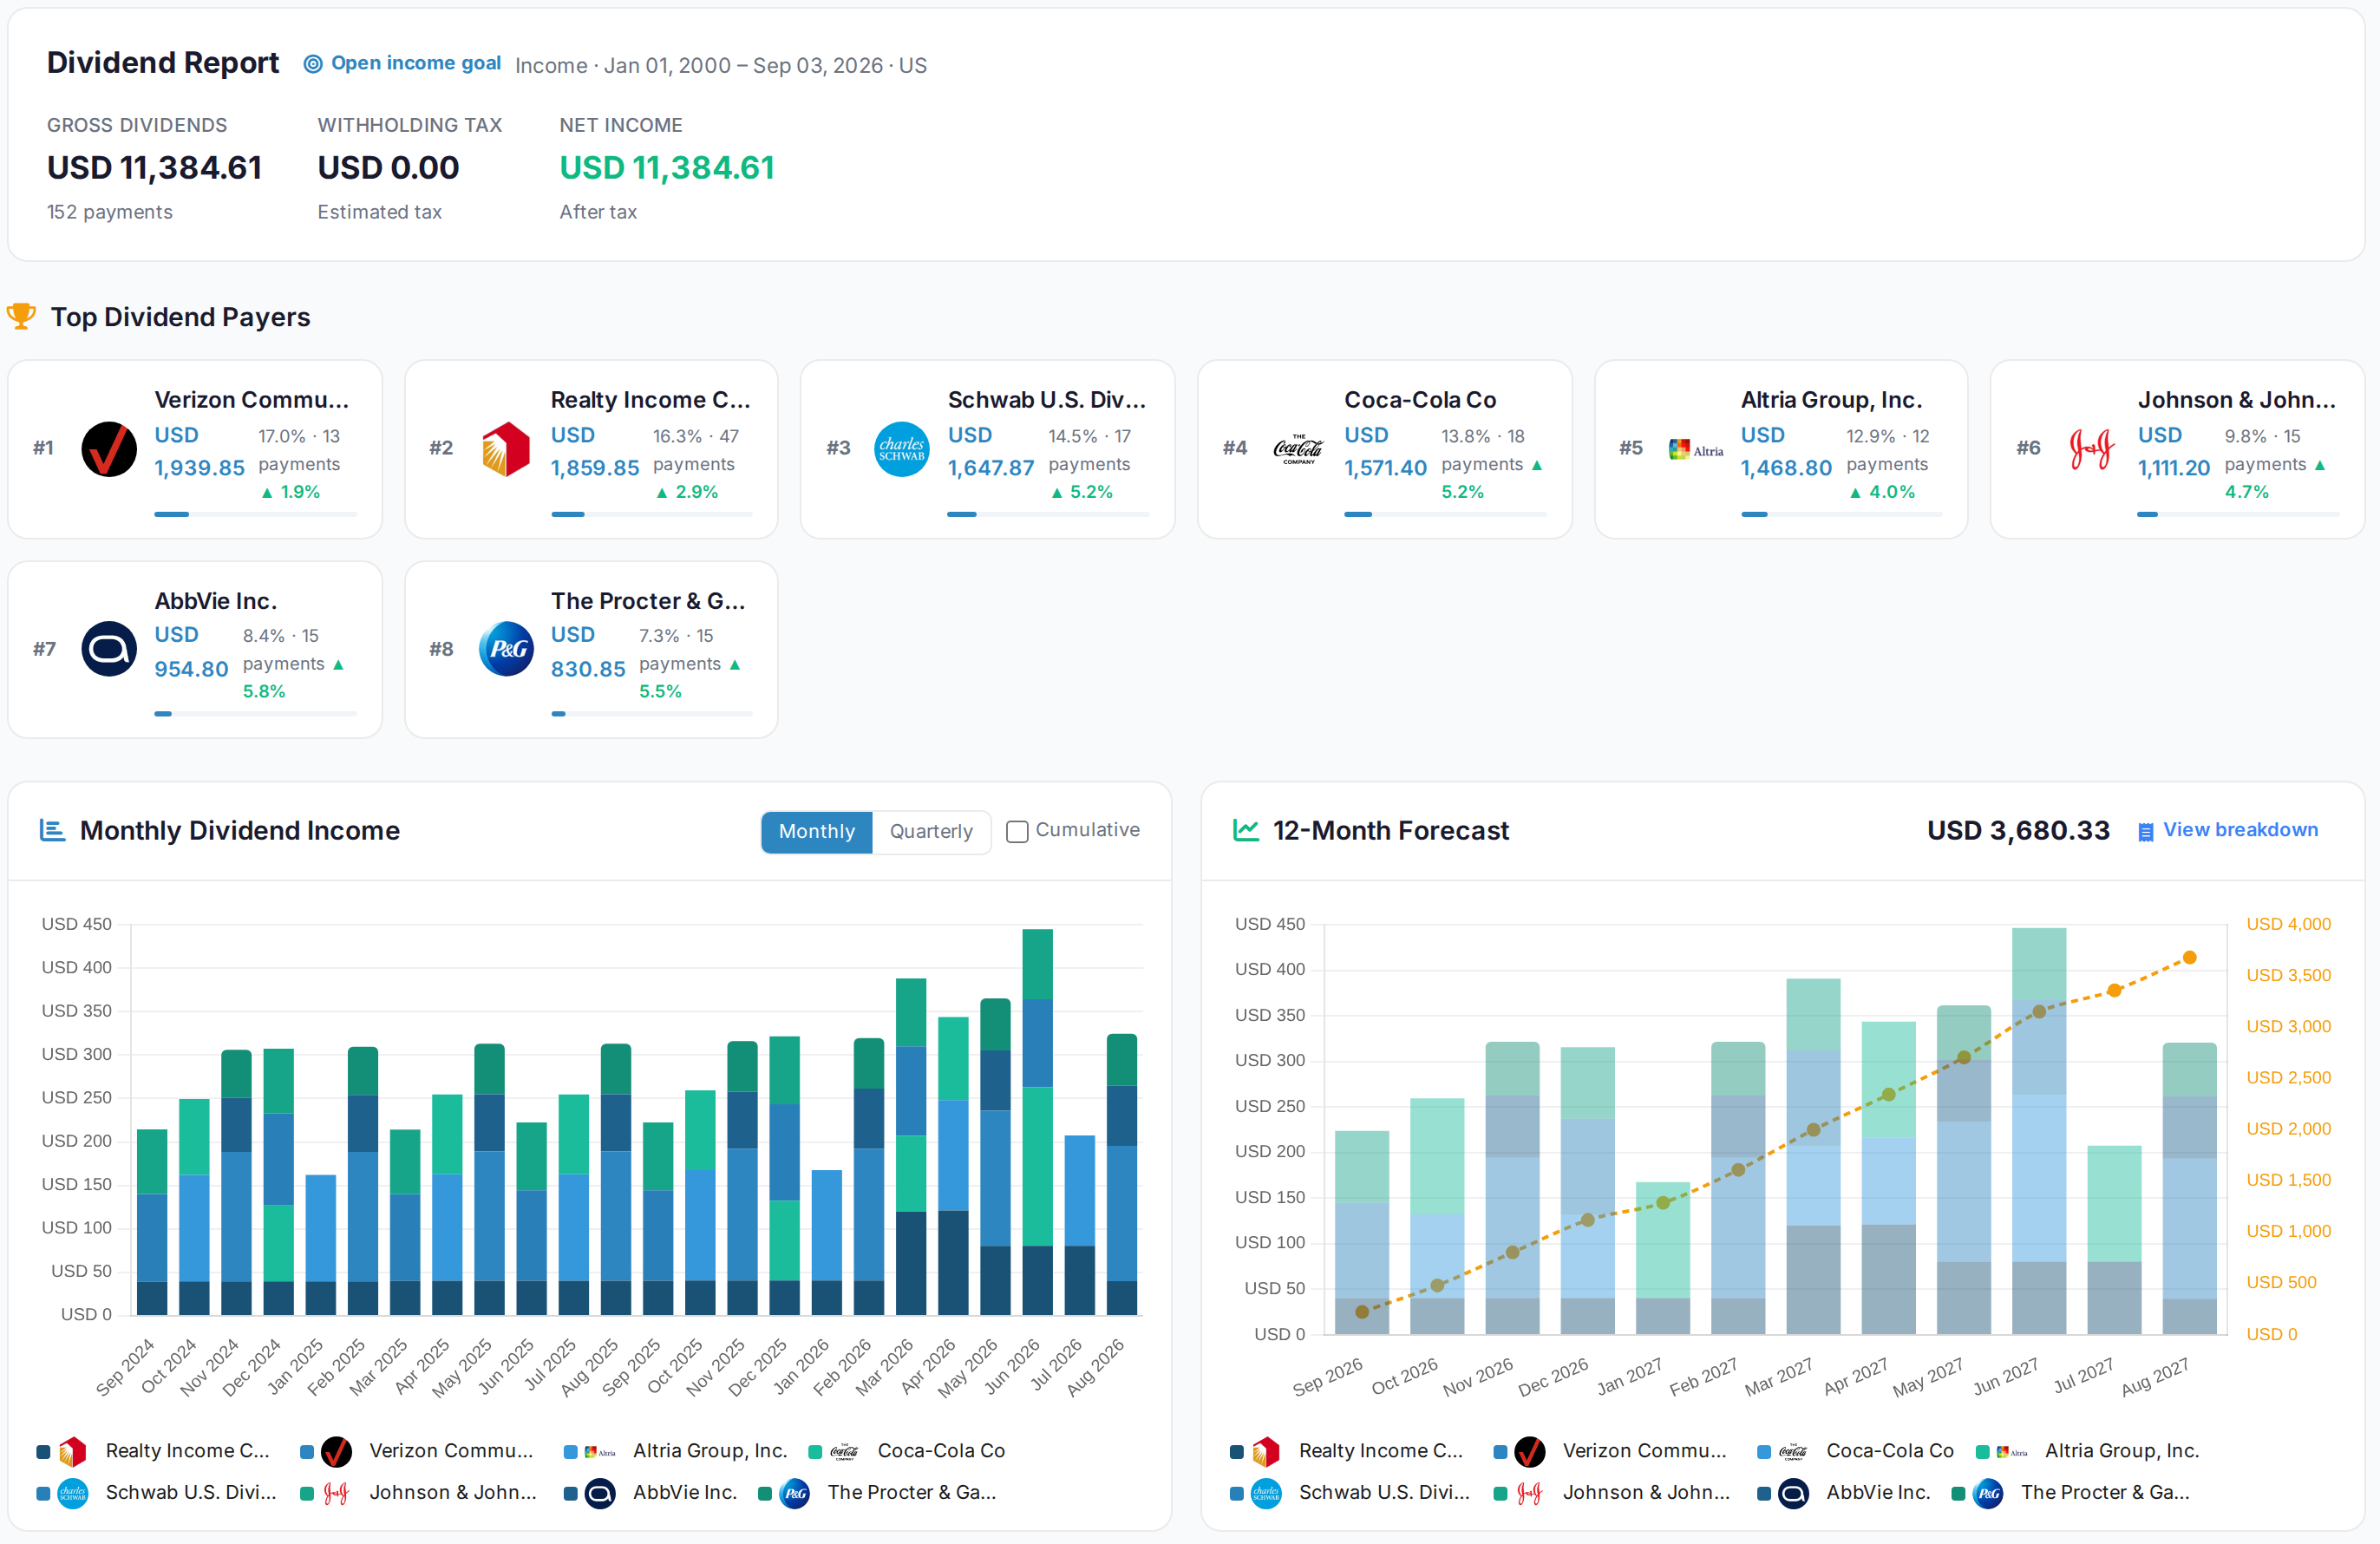
A yield column is a forecast about a company. The dividend report is a history of your own holdings: every payment on its pay date, gross and withholding and net kept apart rather than netted quietly into one number.
Each payer carries its own growth rate. The next twelve months are projected from that history, and the report names the method behind the projection. Upcoming payments land on a calendar so the month ahead is visible before it arrives.
 AllInvestView
Free plan, no credit card. Starter at $6.99/month, or own it once with the lifetime deal.
Create a free accountMove your history
Your buys and sells already exist somewhere: the broker that executed them, a spreadsheet, or a Finviz portfolio you built by hand. Any of those can become the opening record here.
- An Elite account exports its portfolio to file, and that file can come straight across. On the free plan the quicker route is usually the broker itself.
- Accounts you still trade can stay current through direct broker sync, which sends the trades themselves rather than a snapshot of today's positions.
- Odd column layouts, rows pasted straight out of a statement and photographs of a contract note all turn into booked trades. Nothing gets typed in twice.
- If a file fights back, send it to support and someone will sort the mapping out with you.
Support here is a person who reads your account, not a bot working from a script. Someone will reconcile your trades against a broker export, sort out an awkward file, or check a tax figure with you. Rated 4.5 on Trustpilot across 33 reviews.
See how support worksQuestions people ask about Finviz
Can I use Finviz and AllInvestView together?
That is how most people run it. The screener turns up the idea; the position it becomes is kept here.
Does AllInvestView screen for stocks?
Yes, through the assistant, and it can weigh candidates against what your funds already hold for you.
Does AllInvestView have a stock screener?
Yes. Ask the assistant and it filters live instrument data by type, sector, country, exchange, currency, dividend yield, price to earnings, beta and years of price history. It will also screen against your own portfolio, so the results can leave out companies you already hold inside your funds. That last part is something a standalone screener cannot do, because it does not know what you own.
Can I keep using Finviz alongside it?
Most people do. Finviz is where the idea starts and the heat map lives. AllInvestView is where the position goes once you have bought it, with its cost basis, its dividends and its capital gains figure. The two do different jobs and neither one replaces the other.
Finviz gives one free portfolio of 20 holdings. What do I get here?
Ten stock positions in one portfolio, free forever. Bonds, option contracts and custom assets are counted separately, so a ladder or an options book does not eat into the ten. The tax report and the assistant come with it. Paying raises the cap and turns on broker sync, the advanced analytics and Portfolio X-Ray.
What happens to the trades I already typed into Finviz?
They do not need retyping. An Elite export comes across as a file, and so does a broker statement or your own spreadsheet, in whatever layout it happens to use. If the file is unusual, send it to support and someone will map and reconcile it with you before anything is booked.
I hold options and bonds as well as shares. Where do those go?
Each gets its own record. Options carry strike, expiry, the Greeks and eleven strategy templates including a wheel tracker. Bonds are priced off the government yield curve for their currency, with yield to maturity, duration, convexity and the spread over their benchmark. Property and crypto have their own records too, and all of it rolls into the same portfolio total.
Finviz has been sharpening the same screener since 2007, and for turning up candidates quickly it is still the first tab a lot of traders open. The free plan covers screening, the heat maps, insider trades and one portfolio of up to 20 holdings, with quotes delayed and ads on the page. Elite is $39.50 a month or $299.50 a year, and brings real-time data, an ad-free workspace, unlimited alerts, eight years of financial statements and export. Plenty of people screen there and keep the record here, which is a perfectly good way to run things. For the side-by-side detail, read the Finviz vs AllInvestView comparison.
Disclaimer: This comparison is based on independent research conducted in 2026, with pricing verified on 2026-09-17. We are not affiliated with Finviz or any third-party product mentioned. Pricing and features may change. Please verify details on each platform's official website.