 Looking for Snowball Analytics alternatives?
Best Snowball Analytics Alternatives in 2026
AllInvestView shows when your dividends are due, how much income to expect and how that income has grown. Ex-dividend dates determine entitlement, and each forecast names its method. Follow that income into returns between two dates or holdings on a past date, with bonds, options and capital gains reports in the portfolio.
About Snowball Analytics
Snowball Analytics is a dividend-focused portfolio tracker that consolidates stocks, ETFs, funds and crypto from multiple brokers, with a dividend calendar, payout forecasting and a 13-factor Dividend Rating as its signature features.
Who it suits: Dividend investors who follow payment dates, income forecasts and dividend quality across several accounts.
The alternatives

AllInvestView
Best for: Investors who want their income, returns and tax reports together
Track dividend payments and forecasts alongside your whole portfolio. Review returns for any period, revisit past holdings and prepare capital gains reports.

Sharesight
Best for: Investors who want dividend records and tax reports for Australia, Canada or New Zealand
Sharesight is a New Zealand and Australian portfolio tracker built around dividend tracking and tax reports, with a capital gains report for Australian and Canadian tax residents, covering listed shares, ETFs and funds.
Navexa
Best for: Australian investors seeking performance analytics and dividend income tracking
Navexa is a portfolio tracker with detailed performance analytics and income reporting, dividends included.

Wealthica
Best for: Canadian investors who want to aggregate all their financial accounts in one dashboard
Wealthica is a Canadian portfolio aggregator that provides insights by tracking all your investments, bank accounts, and cryptocurrency in one place.

Getquin
Best for: European retail investors who enjoy community-driven investing and portfolio sharing
getquin is a Berlin-built portfolio and net worth tracker with a social layer at its center: public profiles, a community ideas feed, and bank and broker connections on the free tier.

Ghostfolio
Best for: Privacy-conscious, technically skilled investors who prefer self-hosted open-source solutions
Ghostfolio is an open source, AGPLv3 wealth management app for stocks, ETFs and crypto, run either on your own server or on the maintainers' hosted service.

Portfolio Performance
Best for: Detail-oriented German and European investors who want free, powerful desktop software with full control
Portfolio Performance is a free, open-source desktop app for tracking investments and analyzing portfolio returns.
| Platform | Key Features | Pricing |
|---|---|---|
|
Snowball Analytics
|
Dividend calendar, ex-dates and forecasting, Dividend Rating on 13 fundamentals, Automatic broker sync across more than 1,000 institutions, Fund X-Ray on Analytics since July 2025 | Free tier (1 portfolio, 10 holdings); paid plans billed yearly from $79.99/yr, up to $249.99/yr |
|
AllInvestView
|
Real-time portfolio tracking, AI-powered insights, Tax optimization & reporting, Fixed income tracking, Options pricing & analytics, Dividend tracker & forecasting, Broker sync integration, Multi-currency support, Community-driven development | Free plan available, plans from $6.99/month (Lifetime deal available) |
|
Sharesight
|
Capital gains reports for Australia and Canada, FIF reports for New Zealand, Automatic dividend and DRP tracking, 200+ broker connections | Free plan with 10 holdings; paid plans from $9.33/month, unlimited holdings from $24/month |
|
|
Extensive dividend and tax tracking, Cryptocurrency support, Customizable reports | No free plan; 14-day trial, then from 240 AUD/year in Australia or 90 USD/year globally |
|
Wealthica
|
Connects to Canadian banks and brokerages, Daily sync of balances and holdings, Supports cryptocurrency | No free plan; 14-day trial, then from $50/year ($6.25/month) |
|
Getquin
|
Public profiles, following and a community ideas feed built into the core product, 2,000+ bank and broker connections available on the free tier, DeepDive look-through into the composition of ETFs and stocks, iOS, Android and web apps kept in step | Free tier; Premium 89.99 EUR/yr; Wealth 149.99 EUR/yr (annual billing only) |
Asset and reporting coverage. ✓ = full native support · ● = partial or manual · × = not supported.
| Tool | Stocks / ETFs | Bonds | Options | Crypto | Custom assets | Dividend tracking | Multi-currency | Broker sync | CGT reports | Free tier | Mobile app | Advisor features |
|---|---|---|---|---|---|---|---|---|---|---|---|---|
| AllInvestView | ✓ | ✓ | ✓ | ✓ | ✓ | ✓ | ✓ | ✓ | ✓ | ✓ | ✓ | ✓ |
| Snowball Analytics | ✓ | ● | ● | ● | ● | ✓ | ✓ | ✓ | ● | ✓ | ✓ | × |
| Getquin | ✓ | ● | × | ✓ | ● | ✓ | ✓ | ✓ | × | ✓ | ✓ | × |
| Ghostfolio | ✓ | ● | × | ✓ | ✓ | ✓ | ✓ | ● | ● | ✓ | ● | × |
| Navexa | ✓ | ● | × | ✓ | ✓ | ✓ | ✓ | ✓ | ✓ | × | ✓ | ✓ |
| Portfolio Performance | ✓ | ● | × | ✓ | ● | ✓ | ✓ | ● | ● | ✓ | ✓ | × |
| Sharesight | ✓ | ● | × | ✓ | ● | ✓ | ✓ | ✓ | ✓ | ✓ | ✓ | ● |
Our pick, and why
#1 Snowball Analytics Alternative
AllInvestView
Portfolio tracking, analysis and tax reports
Your dividend income connects to the rest of your returns. See what each payer contributed, compare investment periods and recover the holdings behind an earlier portfolio value.
Our take: AllInvestView has the same core dividend tools: a calendar, income by payer, growth rates and per-holding forecasts. It adds custom date ranges, past-date portfolios, bond pricing, options Greeks and capital gains rules for 17 jurisdictions. Snowball Analytics keeps its 13-factor Dividend Rating.
Where that shows up against Snowball Analytics
Dividend calendar
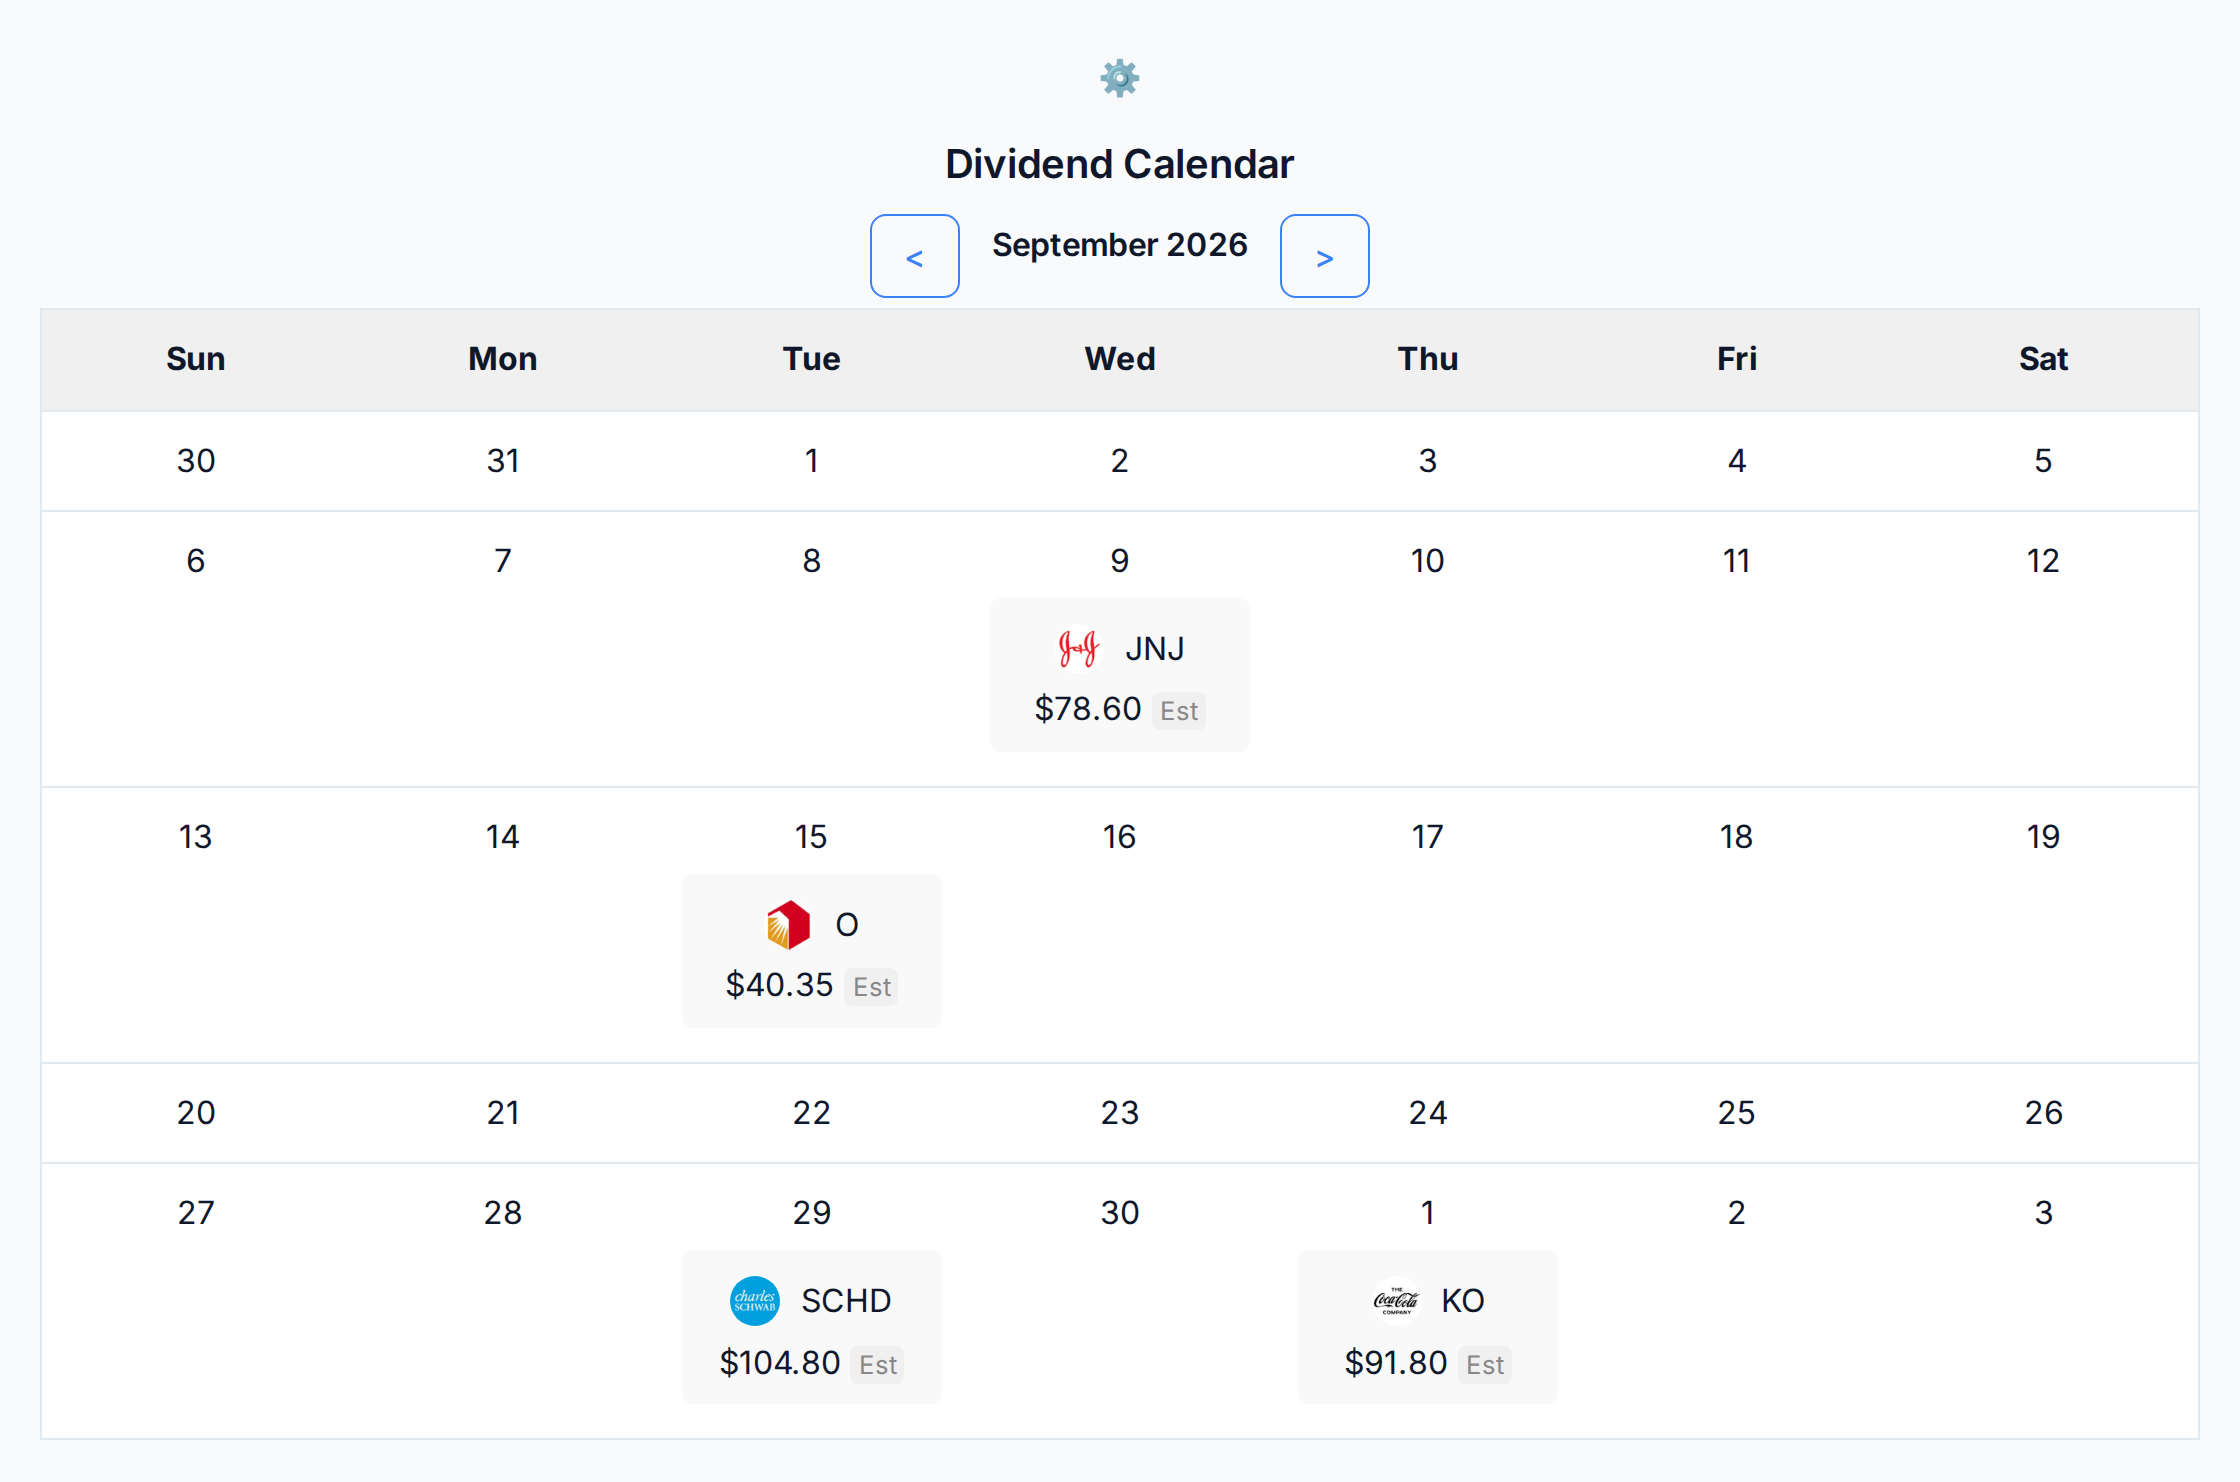
Upcoming payments appear on their pay dates. They use published ex-dividend and payment dates, not a schedule you maintain. Entitlement follows the shares held on the ex-dividend date, so a position opened two days late does not inflate next month's figure. Income is also available by stock, by month and as a growth history.
The calendar, payment record, growth view and forecast cover the same regular checks as Snowball Analytics.
 AllInvestView
Income history and forecasts
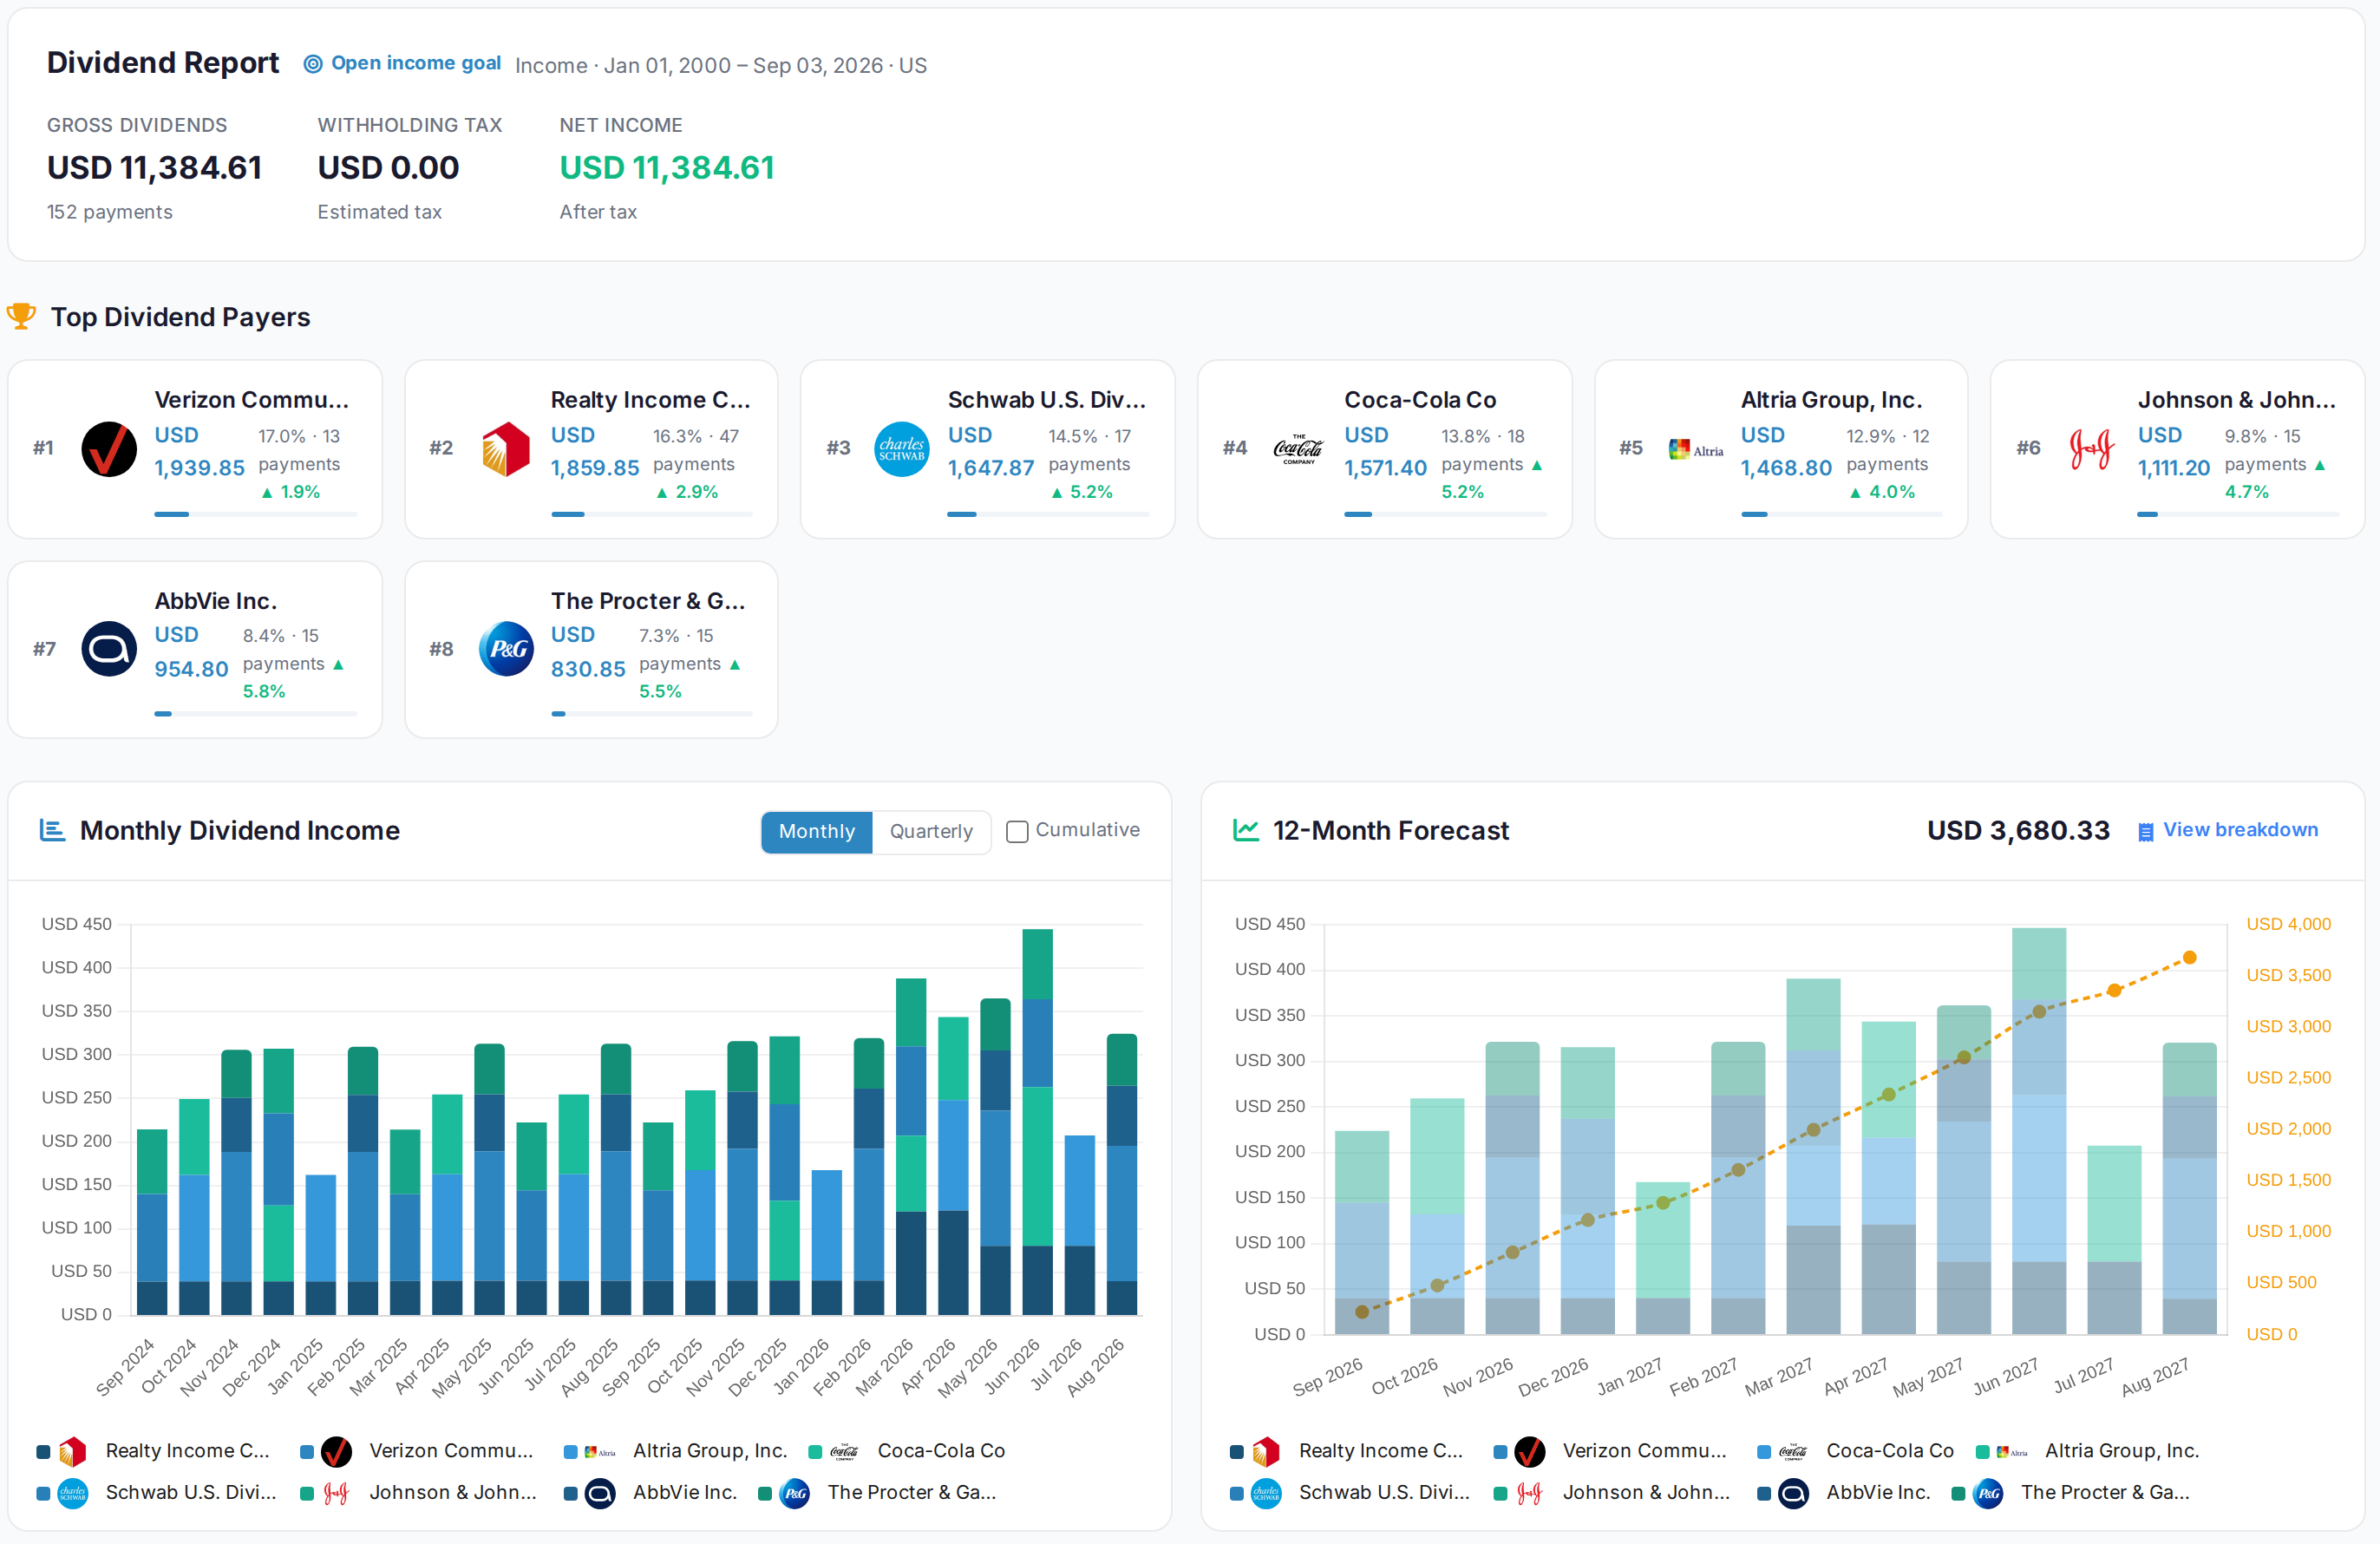
The dividend report starts with gross income, tax withheld and net income. It splits income by payer and gives each payer a growth rate. It also shows monthly history and a twelve-month forecast. Date filtering runs the same report over one tax year or over everything.
The forecast uses five labelled methods. These include declared payments, their annualized extension, the trailing twelve months and a reference dividend rate or yield. Each holding shows the method used. Withholding and Australian franking credits carry through, and it exports to PDF, Excel or CSV.
 AllInvestView
Returns between two dates
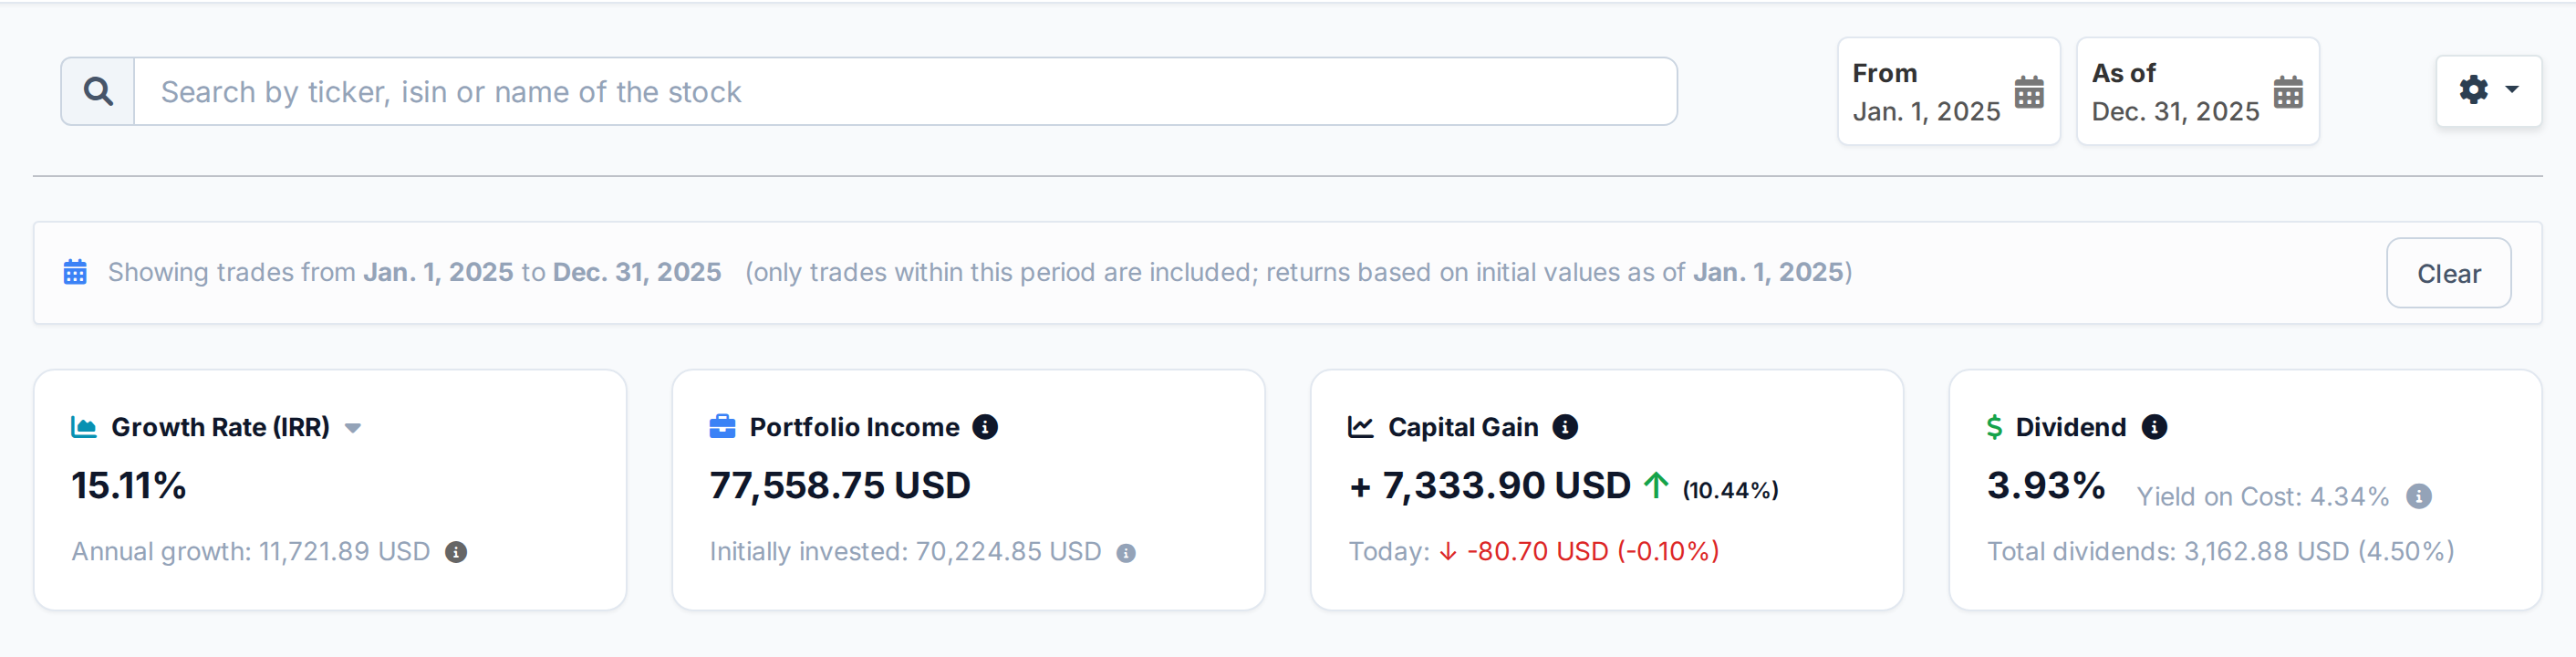
Any start and end date recalculates the dashboard for that period. It shows the capital gain, IRR and dividend yield. A banner names the range. Choosing 2025 gives you results for 2025 only.
 AllInvestView
Free plan, no credit card. Starter at $6.99/month, or own it once with the lifetime deal.
Create a free accountMove your history
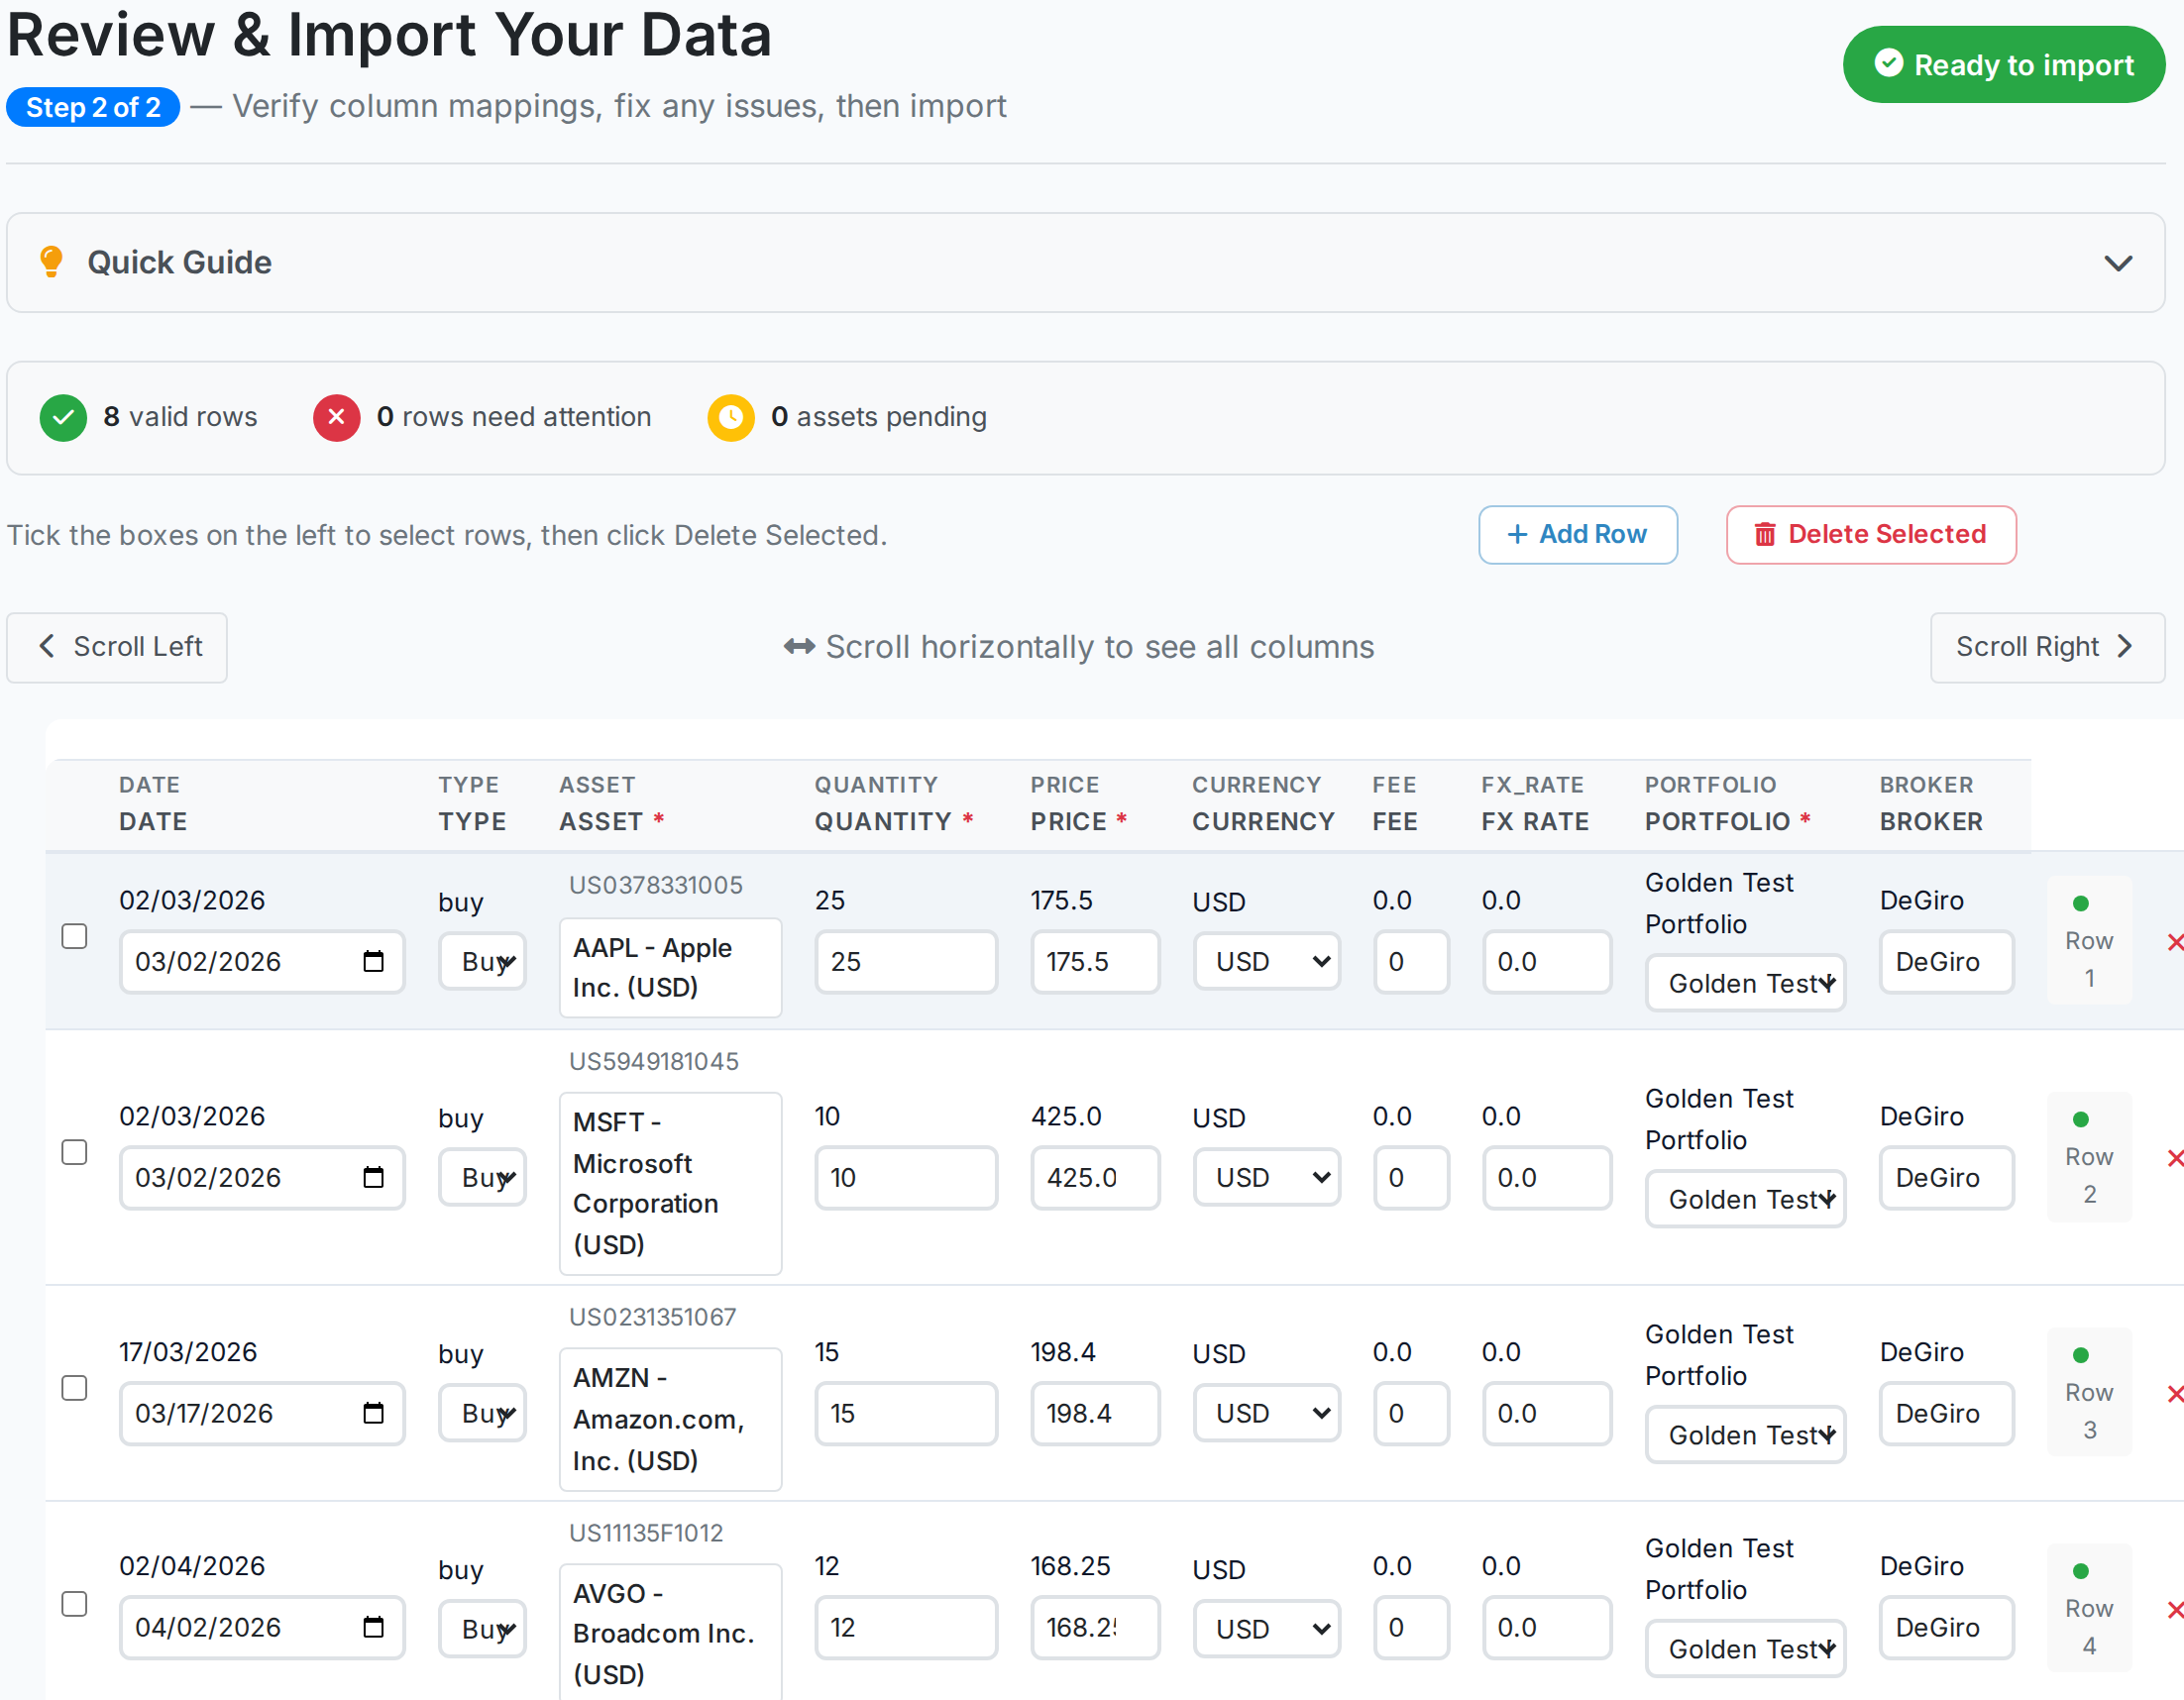
You can bring history from a broker export, old spreadsheet or tracker CSV. A direct broker connection keeps open accounts current. The file brings over older records.
- Broker files, including semicolon-separated exports with foreign headers, bring the complete history across without a prescribed column layout.
- Pasted rows, screenshots and statement photos can fill gaps left by a file and produce history reconciled against the broker's record.
- Personal support can map, reconcile and import a difficult file as part of the standard service.
 AllInvestView
A real person answers. And if you ask, someone who knows your account helps you reconcile your history with your broker statements, sort out an odd file, or check a tax figure. Trustpilot rates us 4.5 out of 5 across 26 reviews.
See how support worksQuestions people ask about Snowball Analytics
Does AllInvestView have a dividend calendar like Snowball Analytics?
Yes. Upcoming payments sit on their pay dates with ex-dividend dates attached, past income splits by month and by payer, and projected annual income is calculated per holding. Entitlement follows the shares held on the ex-dividend date, and the report adds withholding tax, franking credits and export to PDF, Excel or CSV.
Can I bring my Snowball Analytics transaction history with me?
Yes. Export a CSV from the Transactions view with the date filter widened. The complete file comes across without retyping, and personal support can handle an unusual layout for you.
Does Snowball Analytics support bonds and options?
No. A bond in Snowball Analytics is a custom holding with a manual price, and options are not covered. AllInvestView prices bonds in five currencies, Australian dollars included, off the published government curve with an implied credit spread, and gives options Greeks, wheel detection and their own dashboard.
Can I produce a capital gains report for my own country?
AllInvestView ships capital gains rule templates for 17 jurisdictions with the rates, brackets, tax-year boundaries and anti-avoidance rules written in. The same year is priced under FIFO, LIFO, HIFO and average cost, with the estimated tax shown for each. Snowball Analytics has no gains report or cost-basis comparison.
How do the two free plans compare?
Snowball Analytics gives one portfolio and ten holdings at no cost. AllInvestView starts from the same two numbers, with one difference in what counts: the cap applies to distinct equity positions, so bonds, options and custom assets sit outside it, and the assistant is included. Paid plans add broker sync, the X-Ray look-through and advanced analytics.
Is Snowball Analytics a good tracker on its own terms?
Yes. Its calendar, forecasts and Dividend Rating make it a strong dividend tracker. It has no bonds, options or capital gains report, and users rate it 4.6 out of 5 on Trustpilot. It shipped fund look-through in 2025 and a question-answering assistant in 2026.
Snowball Analytics has a Dividend Rating based on 13 fundamentals. AllInvestView does not copy that score. Snowball Analytics also connects to more than 1,000 institutions. The long-form Snowball Analytics vs AllInvestView breakdown goes through the rest feature by feature.
Disclaimer: This comparison is based on independent research conducted in 2026, with pricing verified on 2026-09-03. We are not affiliated with Snowball Analytics or any third-party product mentioned. Pricing and features may change. Please verify details on each platform's official website.