 Looking for Sharesight alternatives?
Best Sharesight Alternatives in 2026
AllInvestView tracks your dividends and calculates capital gains from your trades. Compare four cost basis methods for one tax year and inspect the purchase lots behind each disposal. Your bonds carry yield and duration; your options carry Greeks.
About Sharesight
Sharesight is a New Zealand and Australian portfolio tracker built around dividend tracking and tax reports, with a capital gains report for Australian and Canadian tax residents, covering listed shares, ETFs and funds.
Who it suits: Investors who want dividend records and tax reports for Australia, Canada or New Zealand.
The alternatives

AllInvestView
Best for: Investors who want their income, returns and tax reports together
Track dividend payments and forecasts alongside your whole portfolio. Review returns for any period, revisit past holdings and prepare capital gains reports.

Snowball Analytics
Best for: Dividend investors who follow payment dates, income forecasts and dividend quality across several accounts
Snowball Analytics is a dividend-focused portfolio tracker that consolidates stocks, ETFs, funds and crypto from multiple brokers, with a dividend calendar, payout forecasting and a 13-factor Dividend Rating as its signature features.
Navexa
Best for: Australian investors seeking performance analytics and dividend income tracking
Navexa is a portfolio tracker with detailed performance analytics and income reporting, dividends included.

Wealthica
Best for: Canadian investors who want to aggregate all their financial accounts in one dashboard
Wealthica is a Canadian portfolio aggregator that provides insights by tracking all your investments, bank accounts, and cryptocurrency in one place.

Getquin
Best for: European retail investors who enjoy community-driven investing and portfolio sharing
getquin is a Berlin-built portfolio and net worth tracker with a social layer at its center: public profiles, a community ideas feed, and bank and broker connections on the free tier.

Ghostfolio
Best for: Privacy-conscious, technically skilled investors who prefer self-hosted open-source solutions
Ghostfolio is an open source, AGPLv3 wealth management app for stocks, ETFs and crypto, run either on your own server or on the maintainers' hosted service.

Portfolio Performance
Best for: Detail-oriented German and European investors who want free, powerful desktop software with full control
Portfolio Performance is a free, open-source desktop app for tracking investments and analyzing portfolio returns.
| Platform | Key Features | Pricing |
|---|---|---|
|
Sharesight
|
Capital gains reports for Australia and Canada, FIF reports for New Zealand, Automatic dividend and DRP tracking, 200+ broker connections | Free plan with 10 holdings; paid plans from $9.33/month, unlimited holdings from $24/month |
|
AllInvestView
|
Real-time portfolio tracking, AI-powered insights, Tax optimization & reporting, Fixed income tracking, Options pricing & analytics, Dividend tracker & forecasting, Broker sync integration, Multi-currency support, Community-driven development | Free plan available, plans from $6.99/month (Lifetime deal available) |
|
Snowball Analytics
|
Dividend calendar, ex-dates and forecasting, Dividend Rating on 13 fundamentals, Automatic broker sync across more than 1,000 institutions, Fund X-Ray on Analytics since July 2025 | Free tier (1 portfolio, 10 holdings); paid plans billed yearly from $79.99/yr, up to $249.99/yr |
|
|
Extensive dividend and tax tracking, Cryptocurrency support, Customizable reports | No free plan; 14-day trial, then from 240 AUD/year in Australia or 90 USD/year globally |
|
Wealthica
|
Connects to Canadian banks and brokerages, Daily sync of balances and holdings, Supports cryptocurrency | No free plan; 14-day trial, then from $50/year ($6.25/month) |
|
Getquin
|
Public profiles, following and a community ideas feed built into the core product, 2,000+ bank and broker connections available on the free tier, DeepDive look-through into the composition of ETFs and stocks, iOS, Android and web apps kept in step | Free tier; Premium 89.99 EUR/yr; Wealth 149.99 EUR/yr (annual billing only) |
Asset and reporting coverage. ✓ = full native support · ● = partial or manual · × = not supported.
| Tool | Stocks / ETFs | Bonds | Options | Crypto | Custom assets | Dividend tracking | Multi-currency | Broker sync | CGT reports | Free tier | Mobile app | Advisor features |
|---|---|---|---|---|---|---|---|---|---|---|---|---|
| AllInvestView | ✓ | ✓ | ✓ | ✓ | ✓ | ✓ | ✓ | ✓ | ✓ | ✓ | ✓ | ✓ |
| Sharesight | ✓ | ● | × | ✓ | ● | ✓ | ✓ | ✓ | ✓ | ✓ | ✓ | ● |
| Getquin | ✓ | ● | × | ✓ | ● | ✓ | ✓ | ✓ | × | ✓ | ✓ | × |
| Ghostfolio | ✓ | ● | × | ✓ | ✓ | ✓ | ✓ | ● | ● | ✓ | ● | × |
| Navexa | ✓ | ● | × | ✓ | ✓ | ✓ | ✓ | ✓ | ✓ | × | ✓ | ✓ |
| Portfolio Performance | ✓ | ● | × | ✓ | ● | ✓ | ✓ | ● | ● | ✓ | ✓ | × |
| Snowball Analytics | ✓ | ● | ● | ● | ● | ✓ | ✓ | ✓ | ● | ✓ | ✓ | × |
Our pick, and why
#1 Sharesight Alternative
AllInvestView
Portfolio tracking, analysis and tax reports
Your dividends and disposals feed one investment record, with country-specific tax rules and each sale traced to its purchase lots.
Our take: AllInvestView includes capital gains per lot, tax-year presets, ASX franking, DRP and the full dividend record. It compares FIFO, LIFO, HIFO and average cost for the same year. Seventeen jurisdictions have capital gains rules included. It can also show the account as it stood on a date you choose. Bonds, options and Modelo 720 stay in the same portfolio. Sharesight has served Australian and New Zealand investors since 2008.
Where that shows up against Sharesight
Tax reports by lot
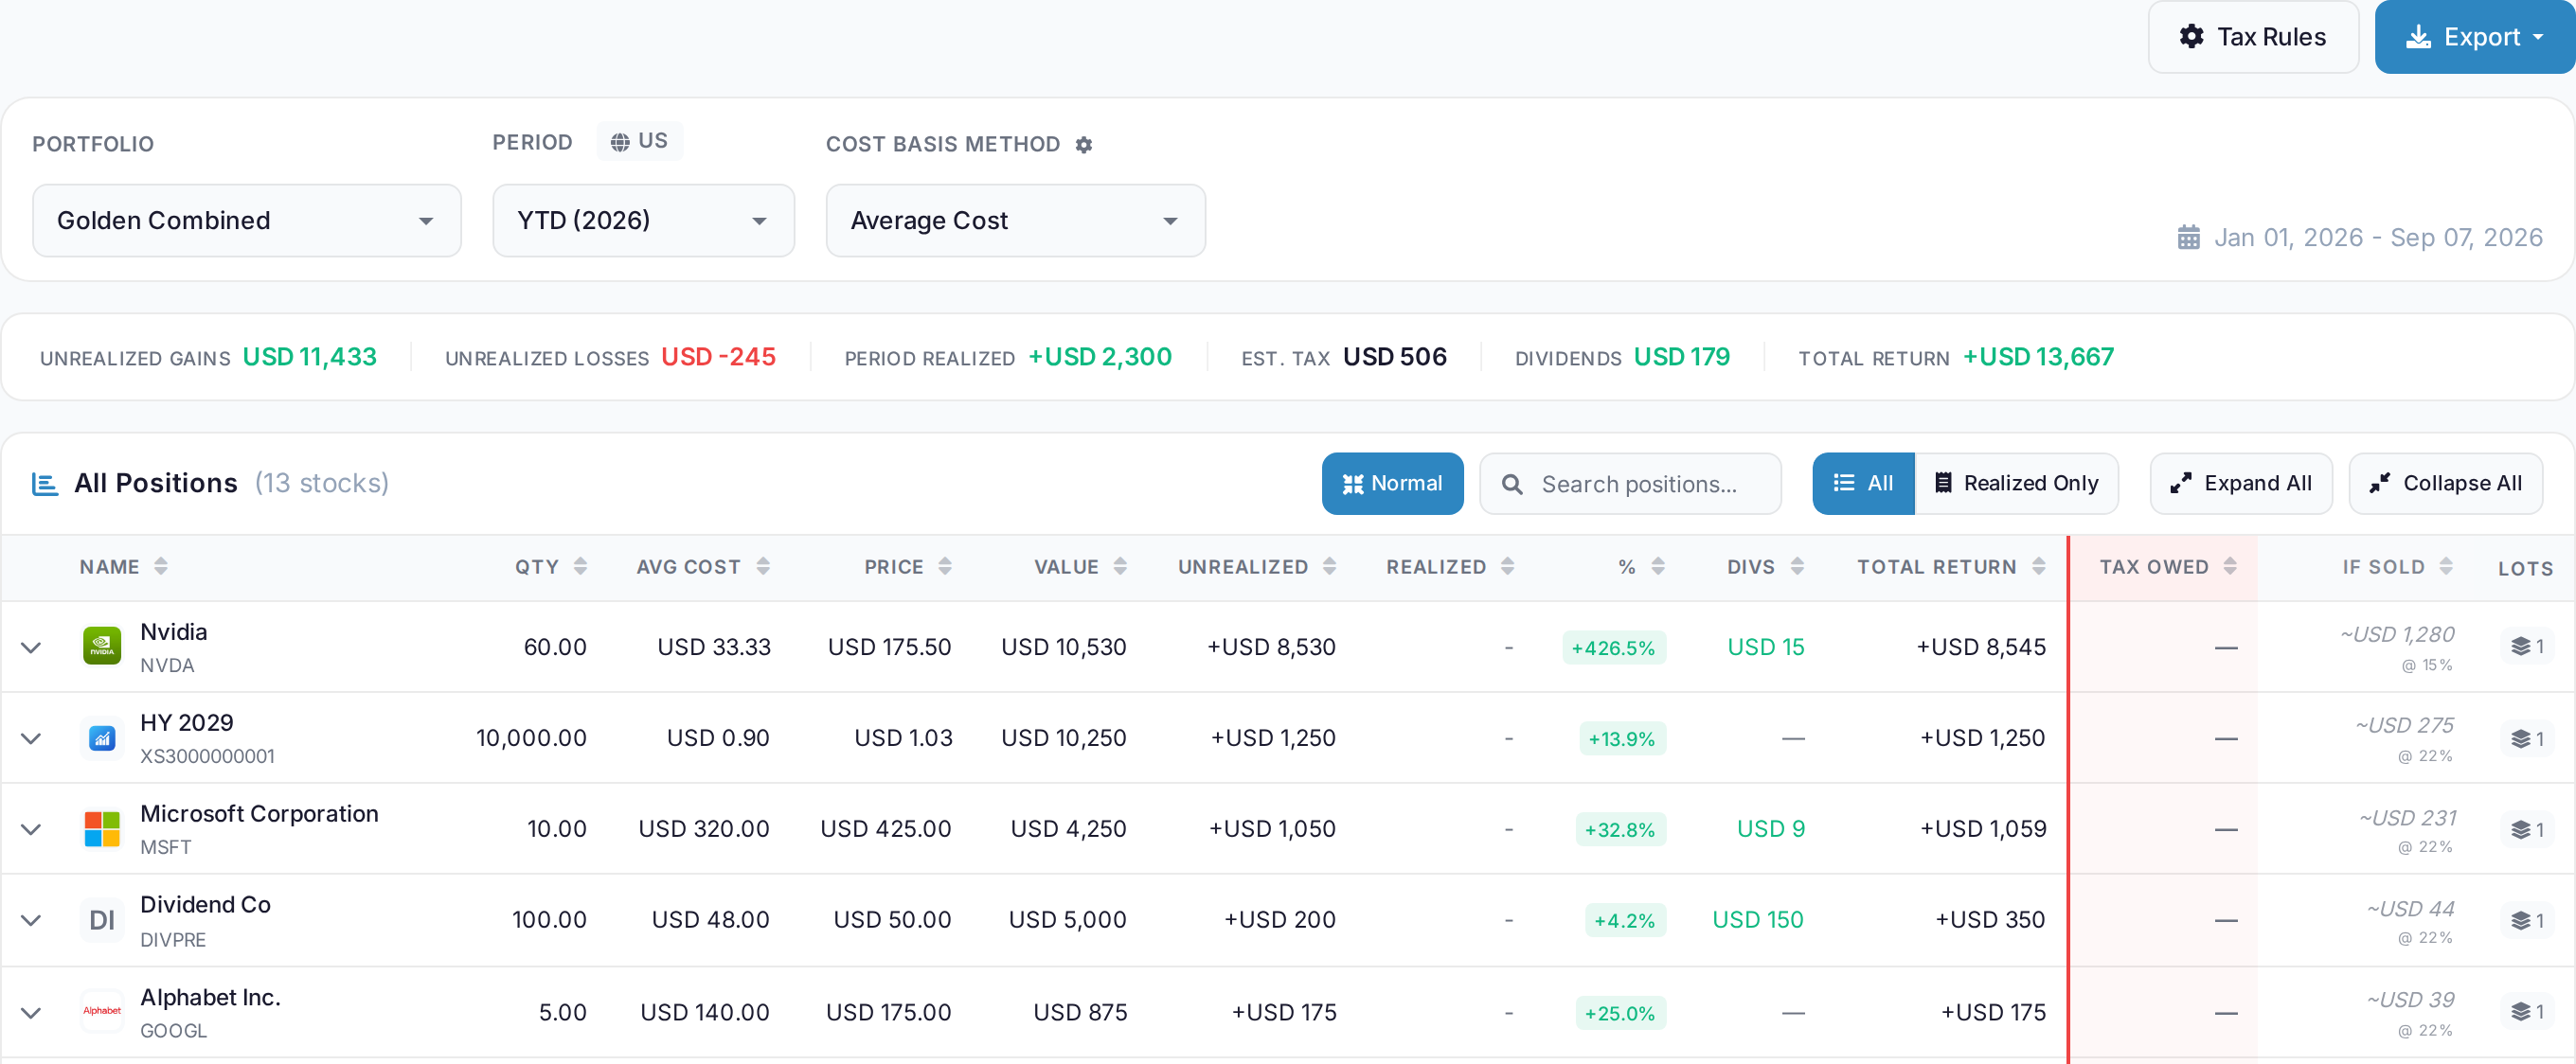
Every disposal in a tax year or custom period comes back as its own line: buy date, sell date, cost basis, proceeds, gain or loss. Realized and unrealized gains are in the same report. Open positions show an estimate for selling before year end. Export is PDF, Excel or CSV.
The same tax year is recalculated four ways, with each cost-basis method's estimated bill compared beside the others. Currency is split out per lot, including the buy and sell rates. This shows whether a USD holding made a gain in EUR.
 AllInvestView
Country tax rules
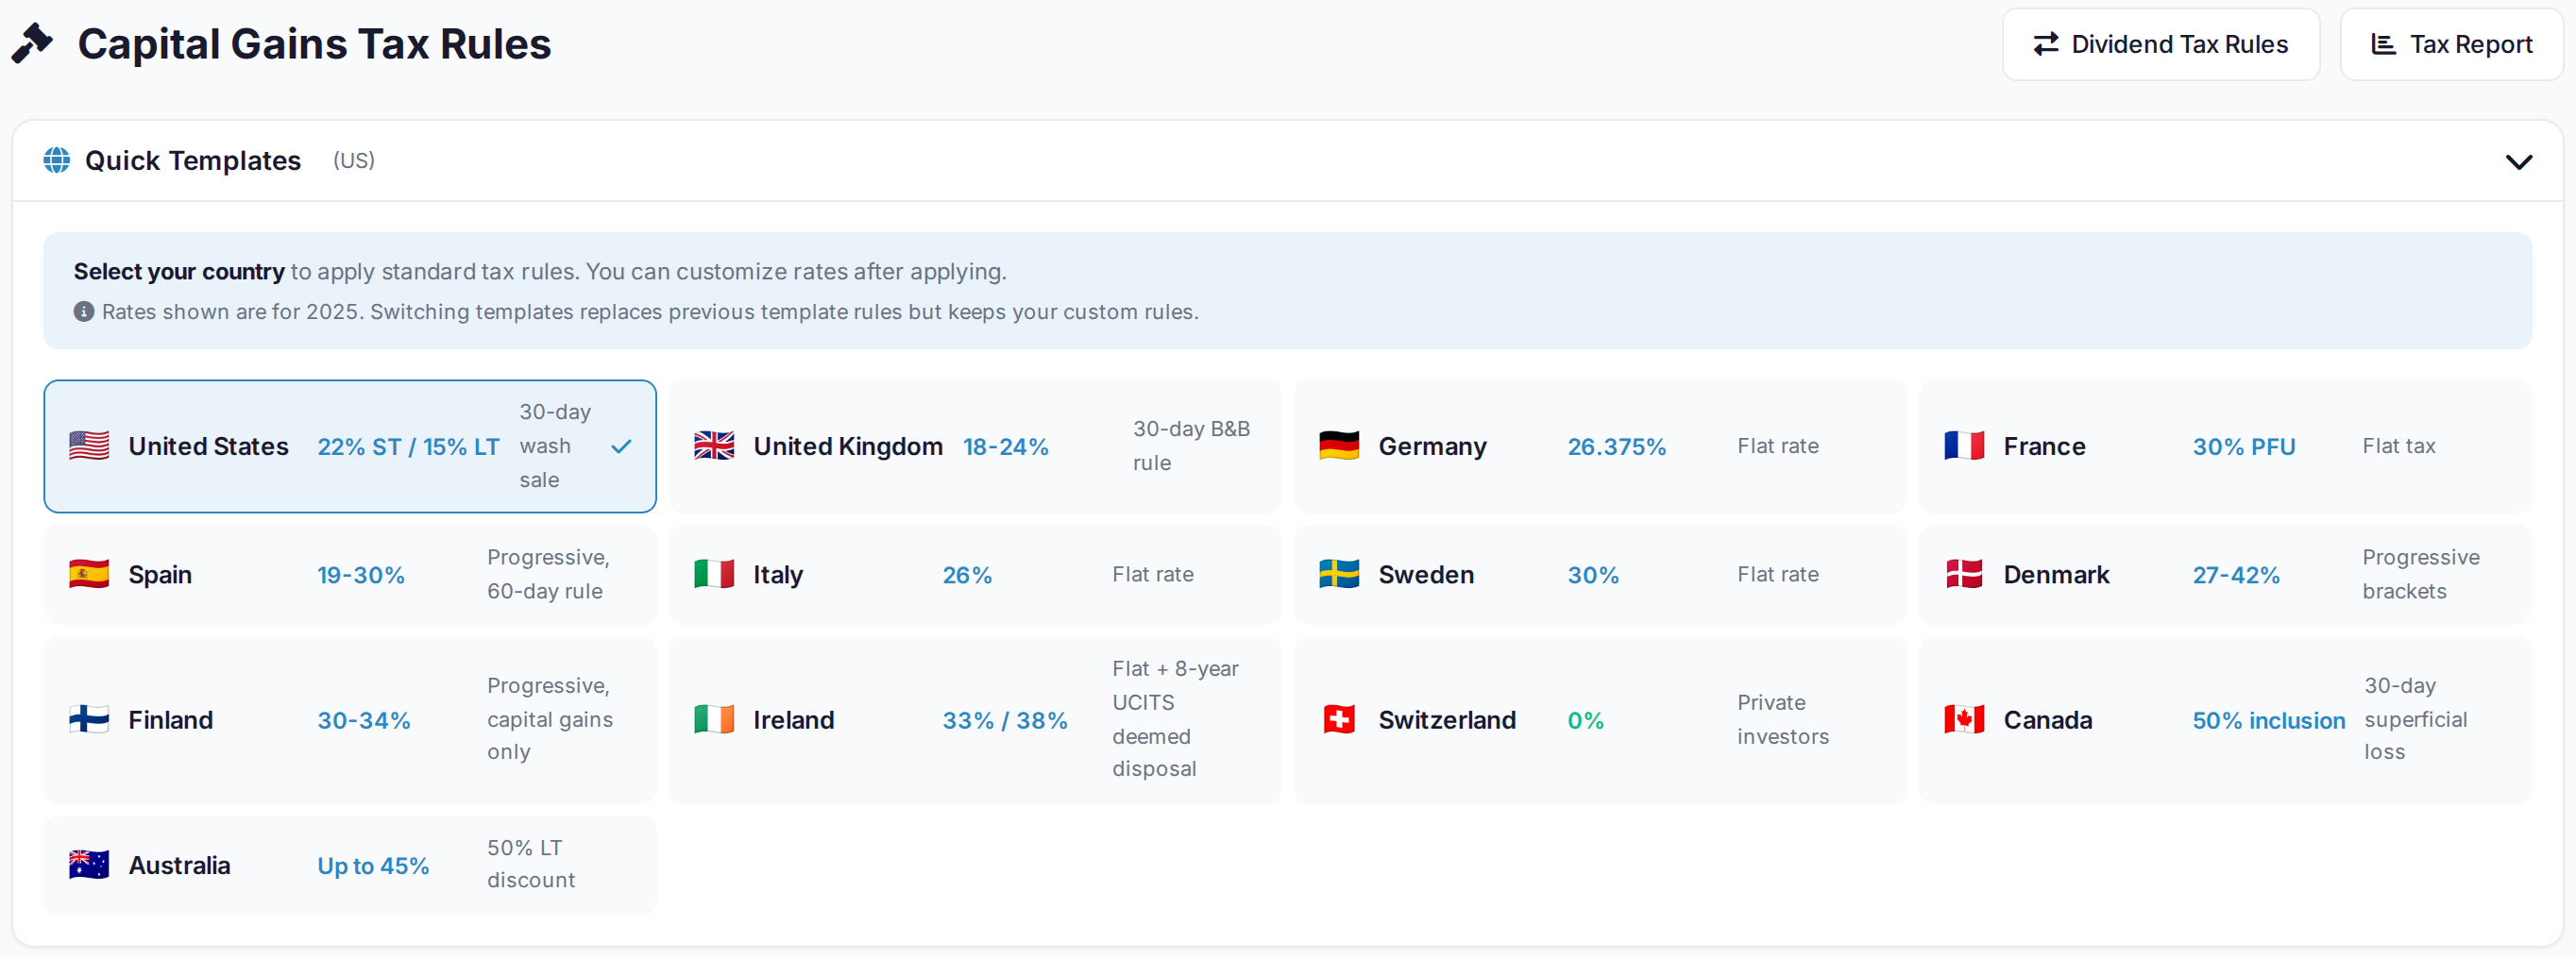
Country-specific rate bands, holding-period treatment and wash-sale windows come ready to use. Seventeen presets cover the US, UK, Canada, Australia and New Zealand, and twelve more across Europe, from Germany, France and Spain to Poland, Portugal and the Netherlands. Every rule remains editable.
Spain gets more than a rate table: Modelo 720 for the foreign-asset declaration, valued at ECB rates as Spanish law requires, exportable in BOE format. Withholding is a separate set of rules per country, with gross and net both carried through the dividend figures rather than netted silently.
 AllInvestView
Dividends with franking credits
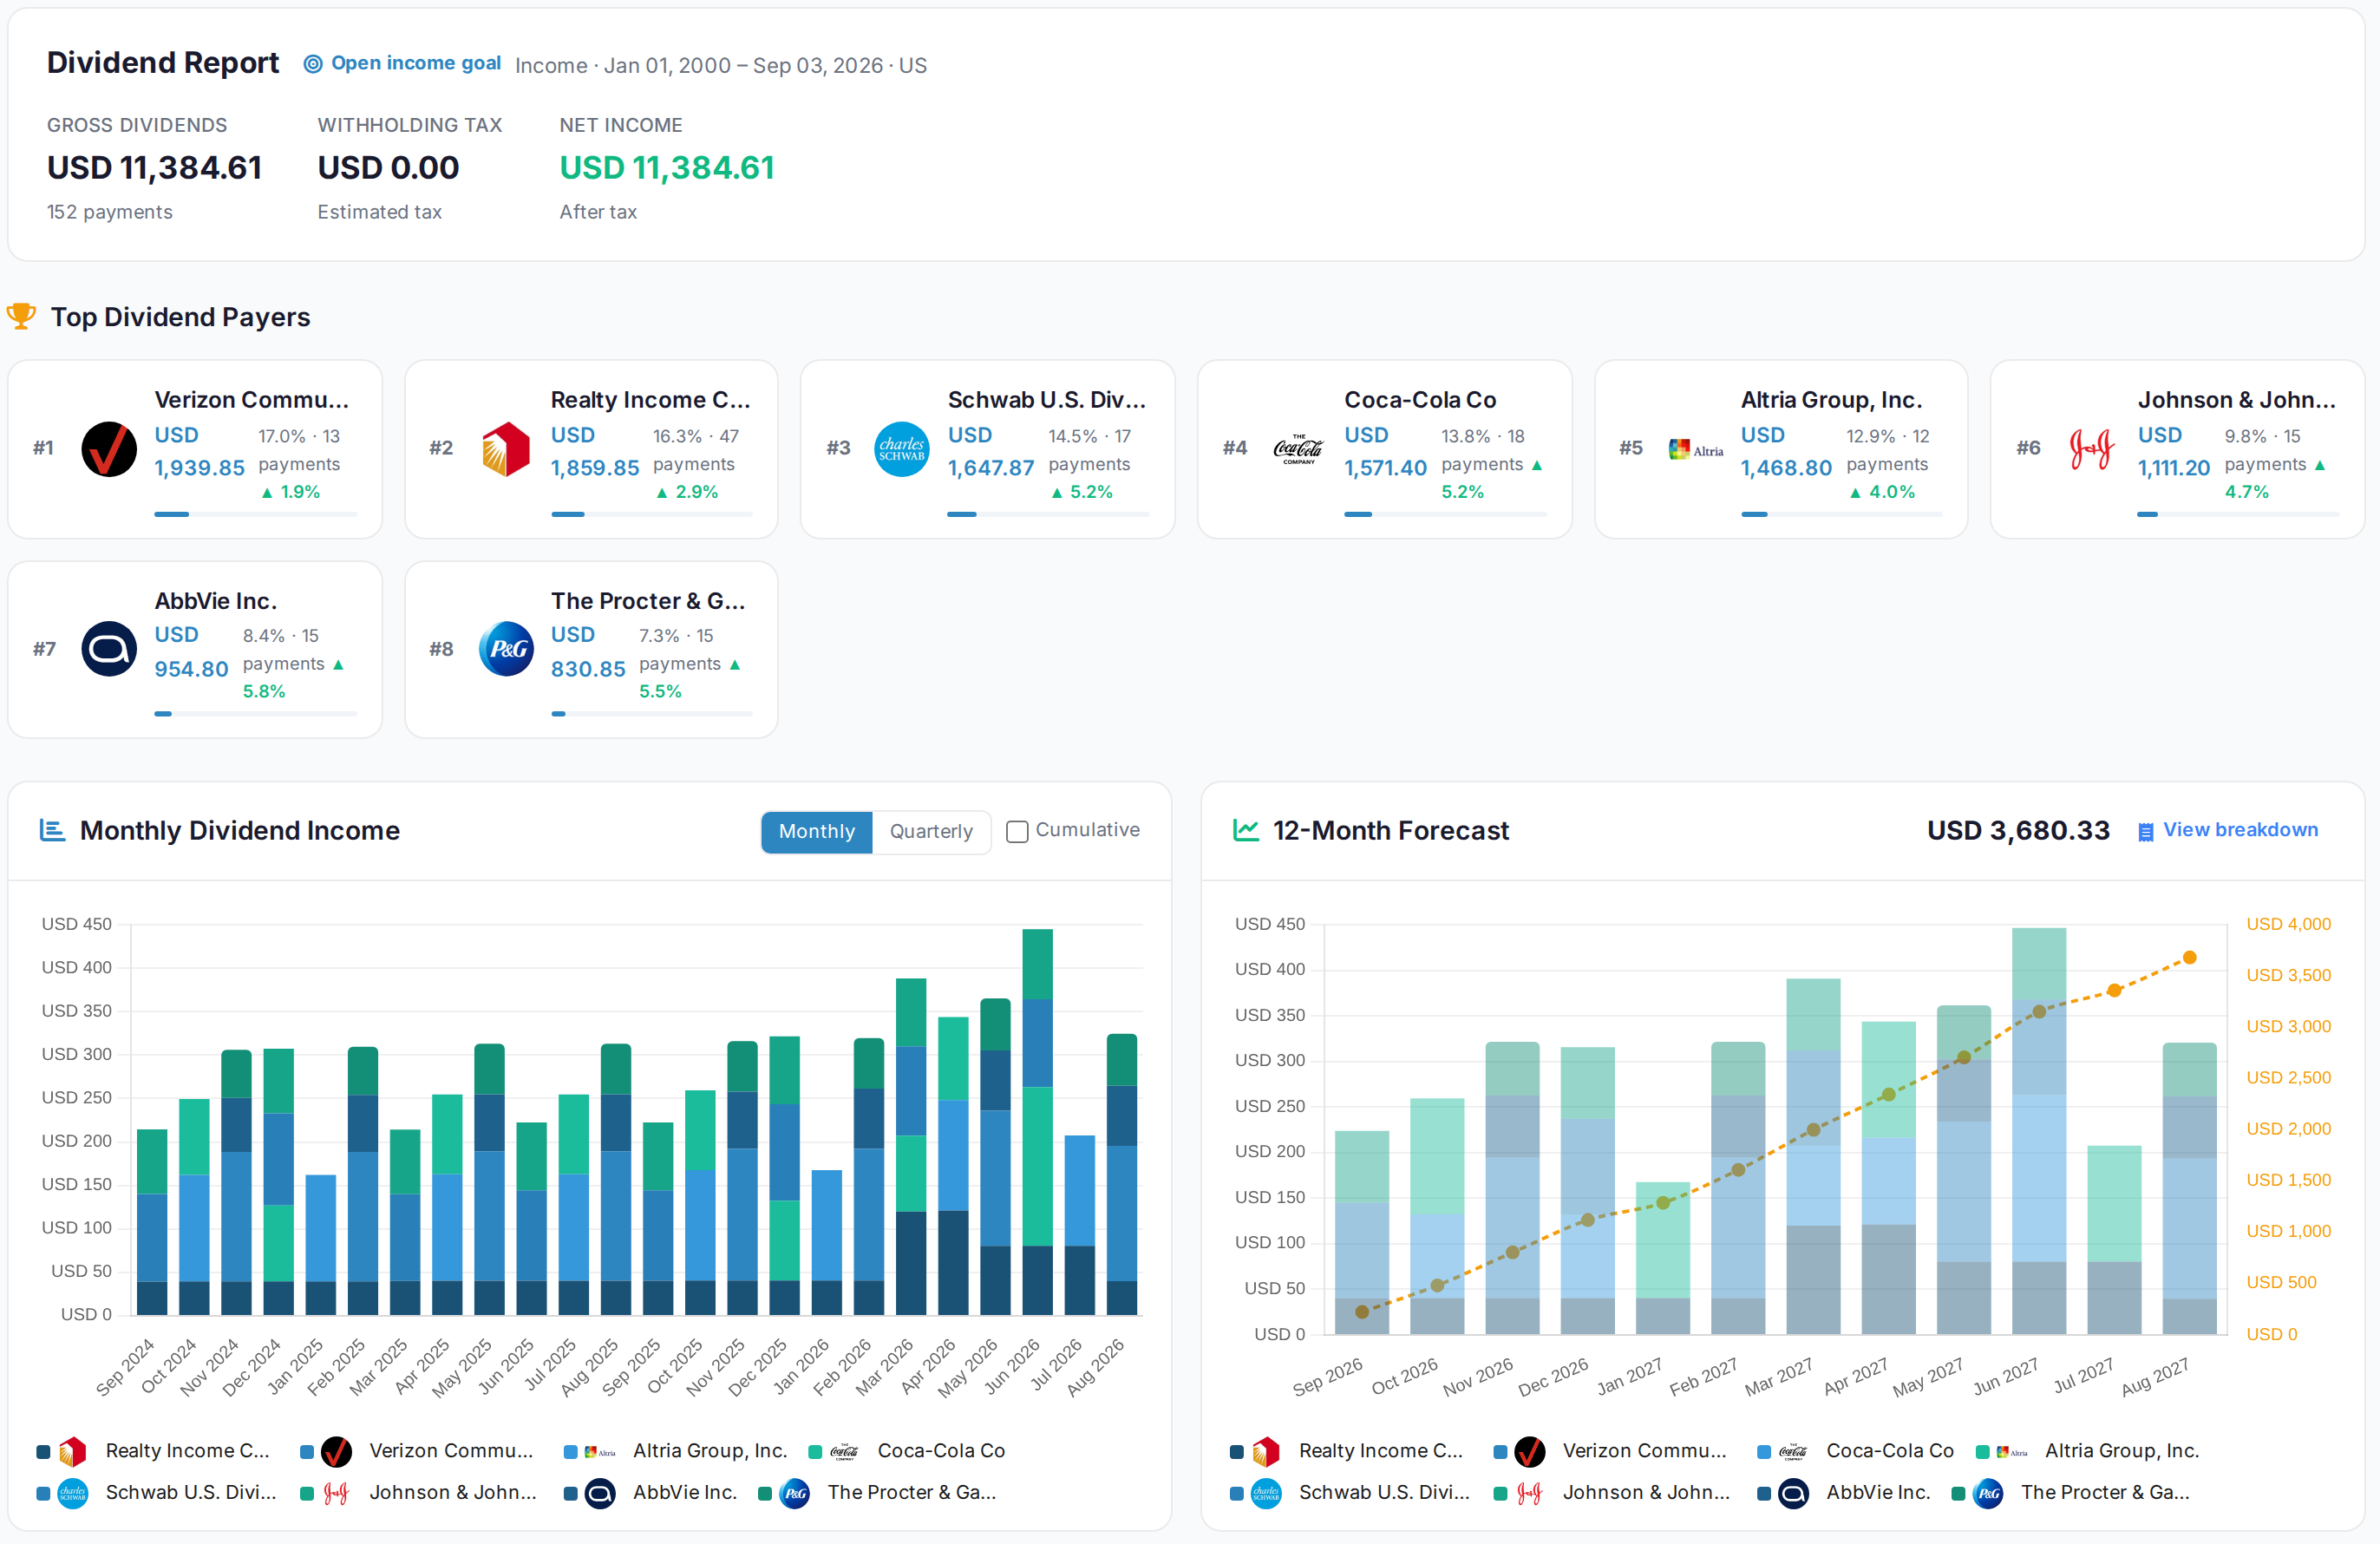
The dividend report uses real ex-dividend dates instead of an assumed schedule. It shows payment history and growth by payer. The forecast also names the method used.
Australian holdings behave the way an ASX investor expects. Franking is recorded per dividend, fully franked income is grossed up, and the report separates the credit from cash received. Dividend files retain that franking history when they come across.
 AllInvestView
Free plan, no credit card. Starter at $6.99/month, or own it once with the lifetime deal.
Create a free accountMove your history
You can import history from a broker, Sharesight workbook, another tracker or your own spreadsheet. Open accounts can stay current through broker sync. The file covers older history.
- Export from Sharesight: Tax tab, All Trades Report, set the date range, then Export and Spreadsheet (.xlsx). Cash movements come out the same way from the Cash Account page. That workbook brings the trade history across in its existing layout.
- Unusual spreadsheets, pasted records and statement images can still become a reconciled trade history without being retyped.
- Personal support can also map, reconcile and import the file for you.
AllInvestView support is a person, not a bot. If you want it, someone who knows your account reconciles your trades against the broker export, sorts out a difficult file, or checks a tax number with you. Rated 4.5 on Trustpilot across 26 reviews.
See how support worksQuestions people ask about Sharesight
Does Portfolio X-Ray show the companies inside my ETFs?
Yes. Portfolio X-Ray returns one row per company, combining the shares you own directly with the amount held inside each ETF. It names the contributing funds, measures overlap between them, and exports the result to CSV. The Sharesight Exposure Report looks through listed ETFs but not managed funds, such as Australian unlisted funds and UK, Irish or Luxembourg domiciled funds identified by ISIN.
Does AllInvestView calculate maximum drawdown?
Advanced analytics includes maximum drawdown, Sharpe and Sortino ratios, value at risk, a correlation matrix, the efficient frontier, Monte Carlo projections and crisis scenarios that replay the portfolio through a historical crash. Advanced analytics is a paid feature.
Can AllInvestView produce an Australian tax report with franking credits?
Yes. Australia is one of the seventeen jurisdictions with a ready-made rule template. It includes the rates and holding-period treatment. Franking is tracked per dividend on ASX holdings, grossed-up income and a franking summary. The report exports as PDF, Excel or CSV.
What happens to years of trade history, and to the cost basis built on it?
Export the All Trades Report as a spreadsheet. Its trades rebuild cost basis rather than carrying over a summary figure, which is why the full history matters more than a positions list. Personal support can map an unusual workbook for you.
Is there a free plan, and what does it actually include?
One portfolio and ten holdings, where a holding means a distinct stock position. A bond ladder, an options book and any custom assets sit outside that ten. Tax reports and the assistant are included. Broker sync, advanced analytics and Portfolio X-Ray are on the paid plans.
Sharesight has served Australian and New Zealand investors since it went online in 2008, and its reports for the ATO and Inland Revenue are shaped to those authorities rather than exported and reshaped. Some brokers name Sharesight in their third-party access lists, so check yours against both. Starter costs $9.33 a month for 30 holdings. Standard costs $24 and removes the holding cap. Premium costs $31 and adds the deeper reports. Prices are shown locally in Australia, New Zealand, the UK, Canada and Europe. For the tax reporting detail specifically, read the Sharesight vs AllInvestView comparison.
Disclaimer: This comparison is based on independent research conducted in 2026, with pricing verified on 2026-10-24. We are not affiliated with Sharesight or any third-party product mentioned. Pricing and features may change. Please verify details on each platform's official website.