Platform Overview
Simply Wall St launched in 2014 from Sydney, Australia, founded by Al Bentley and Nick Van Den Berg. The platform now reports seven million investors and coverage of 120,000 global stocks. Its core innovation is the "Snowflake" diagram, a visual representation of stock health across five dimensions.
AllInvestView tracks the holdings and transactions across every account. It supports bonds with yield-to-maturity calculations, options with current Greeks, and fourteen national rule sets for capital gains.
Simply Wall St
Visual stock analysis with Snowflake diagrams. Strong research tools for equity investors who prefer infographics over spreadsheets.

AllInvestView
Our PickTracks stocks, funds, bonds, options, crypto and liabilities, with tax reports under fourteen country rule sets.
Simply Wall St stock research
Simply Wall St built its reputation on the Snowflake diagram–a five-point visualization that instantly communicates a stock's profile:
- Value: Valuation from cash-flow and comparable-company analysis
- Future: Growth expectations from analyst forecasts
- Past: The company's historical performance
- Health: Balance-sheet strength and debt
- Dividends: Payment history and sustainability
This visual approach helps beginners understand complex financial data quickly. Color-coded indicators show strengths (green) and weaknesses (red) without requiring deep financial knowledge.
Simply Wall St excels at: Quick stock research for visual learners. You can assess a company's overall health in under 5 minutes using their infographic-style reports.
AllInvestView takes a different approach. Rather than analyzing individual stocks, it focuses on tracking your actual portfolio performance, calculating real returns including dividends and currency gains, and preparing tax-ready reports. If you need stock research, AllInvestView integrates with your existing research tools rather than replacing them.
Supported Asset Types
Equities are handled well on both. Simply Wall St provides in-depth research reports with valuation models; AllInvestView tracks the positions themselves with accurate cost basis, dividend income and performance attribution.
Bonds are not supported. The platform focuses exclusively on equities.
A dedicated bond calculator with yield-to-maturity, duration metrics, coupon schedules and accrued interest. Corporate, government and municipal bonds are all tracked with proper analytical tools.
Options and other derivatives are not covered.
Tracks multi-leg positions with Delta, Gamma, Theta and Vega, a theoretical price that moves with the underlying, and expiration dates.
Cryptocurrency tracking is not available.
Real-time crypto prices with imports from any exchange or wallet. Bitcoin, Ethereum and other coins are tracked with the rest of the portfolio.
Liabilities cannot be tracked, so the figure shown is assets only, not true net worth.
Mortgages, loans, margin debt and other liabilities are tracked, so net worth accounts for what you owe alongside what you own.
The difference: Simply Wall St starts with company research. AllInvestView starts with the portfolio you already own and the history behind it.
Portfolio Tracking Capabilities
Links brokerages on its Premium and Unlimited plans, or positions are entered by hand. A linked account brings over holdings, with the average cost and the number of shares, and not the full transaction history.
Returns are calculated including dividends, currency gains and internal rate of return. Data updates daily rather than in real time, which makes it unsuitable for active traders.
- Multiple Portfolios: Separate taxable, retirement, and other accounts
- Accurate Cost Basis: FIFO, LIFO, or Average Cost tracking
- Performance Attribution: See what's driving your returns
- Dividend Tracking: Complete history with tax-lot matching
- Rebalancing Tools: Target allocation vs current allocation
- Mobile Access: Native apps for iOS and Android, plus a responsive web app
Tax Reporting Tools
Tax reporting represents one of the largest gaps between these platforms.
Dividend income is tracked. There are no capital gains tax calculations, so these are not there:
- Capital gains and loss reports
- Cost basis method selection (FIFO/LIFO/ACB)
- Wash sale detection
- Tax-loss harvesting identification
- Multi-jurisdiction support
- Country Rules: Fourteen jurisdiction presets are ready to use
- Cost Basis Options: FIFO, LIFO, HIFO and Average Cost
- Progressive Brackets: Automatic calculations showing tax at each bracket level
- Wash Sale Detection: Configurable windows for jurisdictions that apply these rules
- Loss Carryforward: Track unused losses across multiple tax years
- Export Formats: PDF, Excel, and CSV reports ready for accountants
For UK investors: AllInvestView supports Section 104 pooling (Average Cost Basis) as required by HMRC. Simply Wall St does not provide this calculation.
How the Tax Math Stays Accurate
A Transactions portfolio in Simply Wall St reconstructs trade history under FIFO. AllInvestView reconciles each synced buy and sell to its broker activity, identifies disagreements and keeps a removed trade removed after later syncs. The resulting lots can then run under FIFO, LIFO, HIFO or average cost and the chosen country's rules.
Data Import Methods
Connects to brokerages on its Premium and Unlimited plans, syncing daily. When your broker is supported, syncing is automatic. Manual entry is available but tedious for large portfolios.
- Direct broker sync: Supported portfolios held with Interactive Brokers, Charles Schwab, Fidelity, Public, Wealthsimple, and other major platforms synchronize each night
- Flexible files: CSV, XLSX and copied spreadsheet rows in unfamiliar layouts become transaction history
- Broker-Specific Templates: Pre-configured formats for Trading 212, Fidelity, ING, and 50+ other platforms
- Manual Entry: Quick transaction forms for positions from any source
Inside AllInvestView
Company exposure inside funds
At Simply Wall St a fund with no earnings per share figure stays out of every calculation that needs one, and its value still counts toward the portfolio total. An investor whose core is three broad ETFs with a few individual names around them gets an accurate number for what the account is worth, and the company-level read covers the shares held directly.
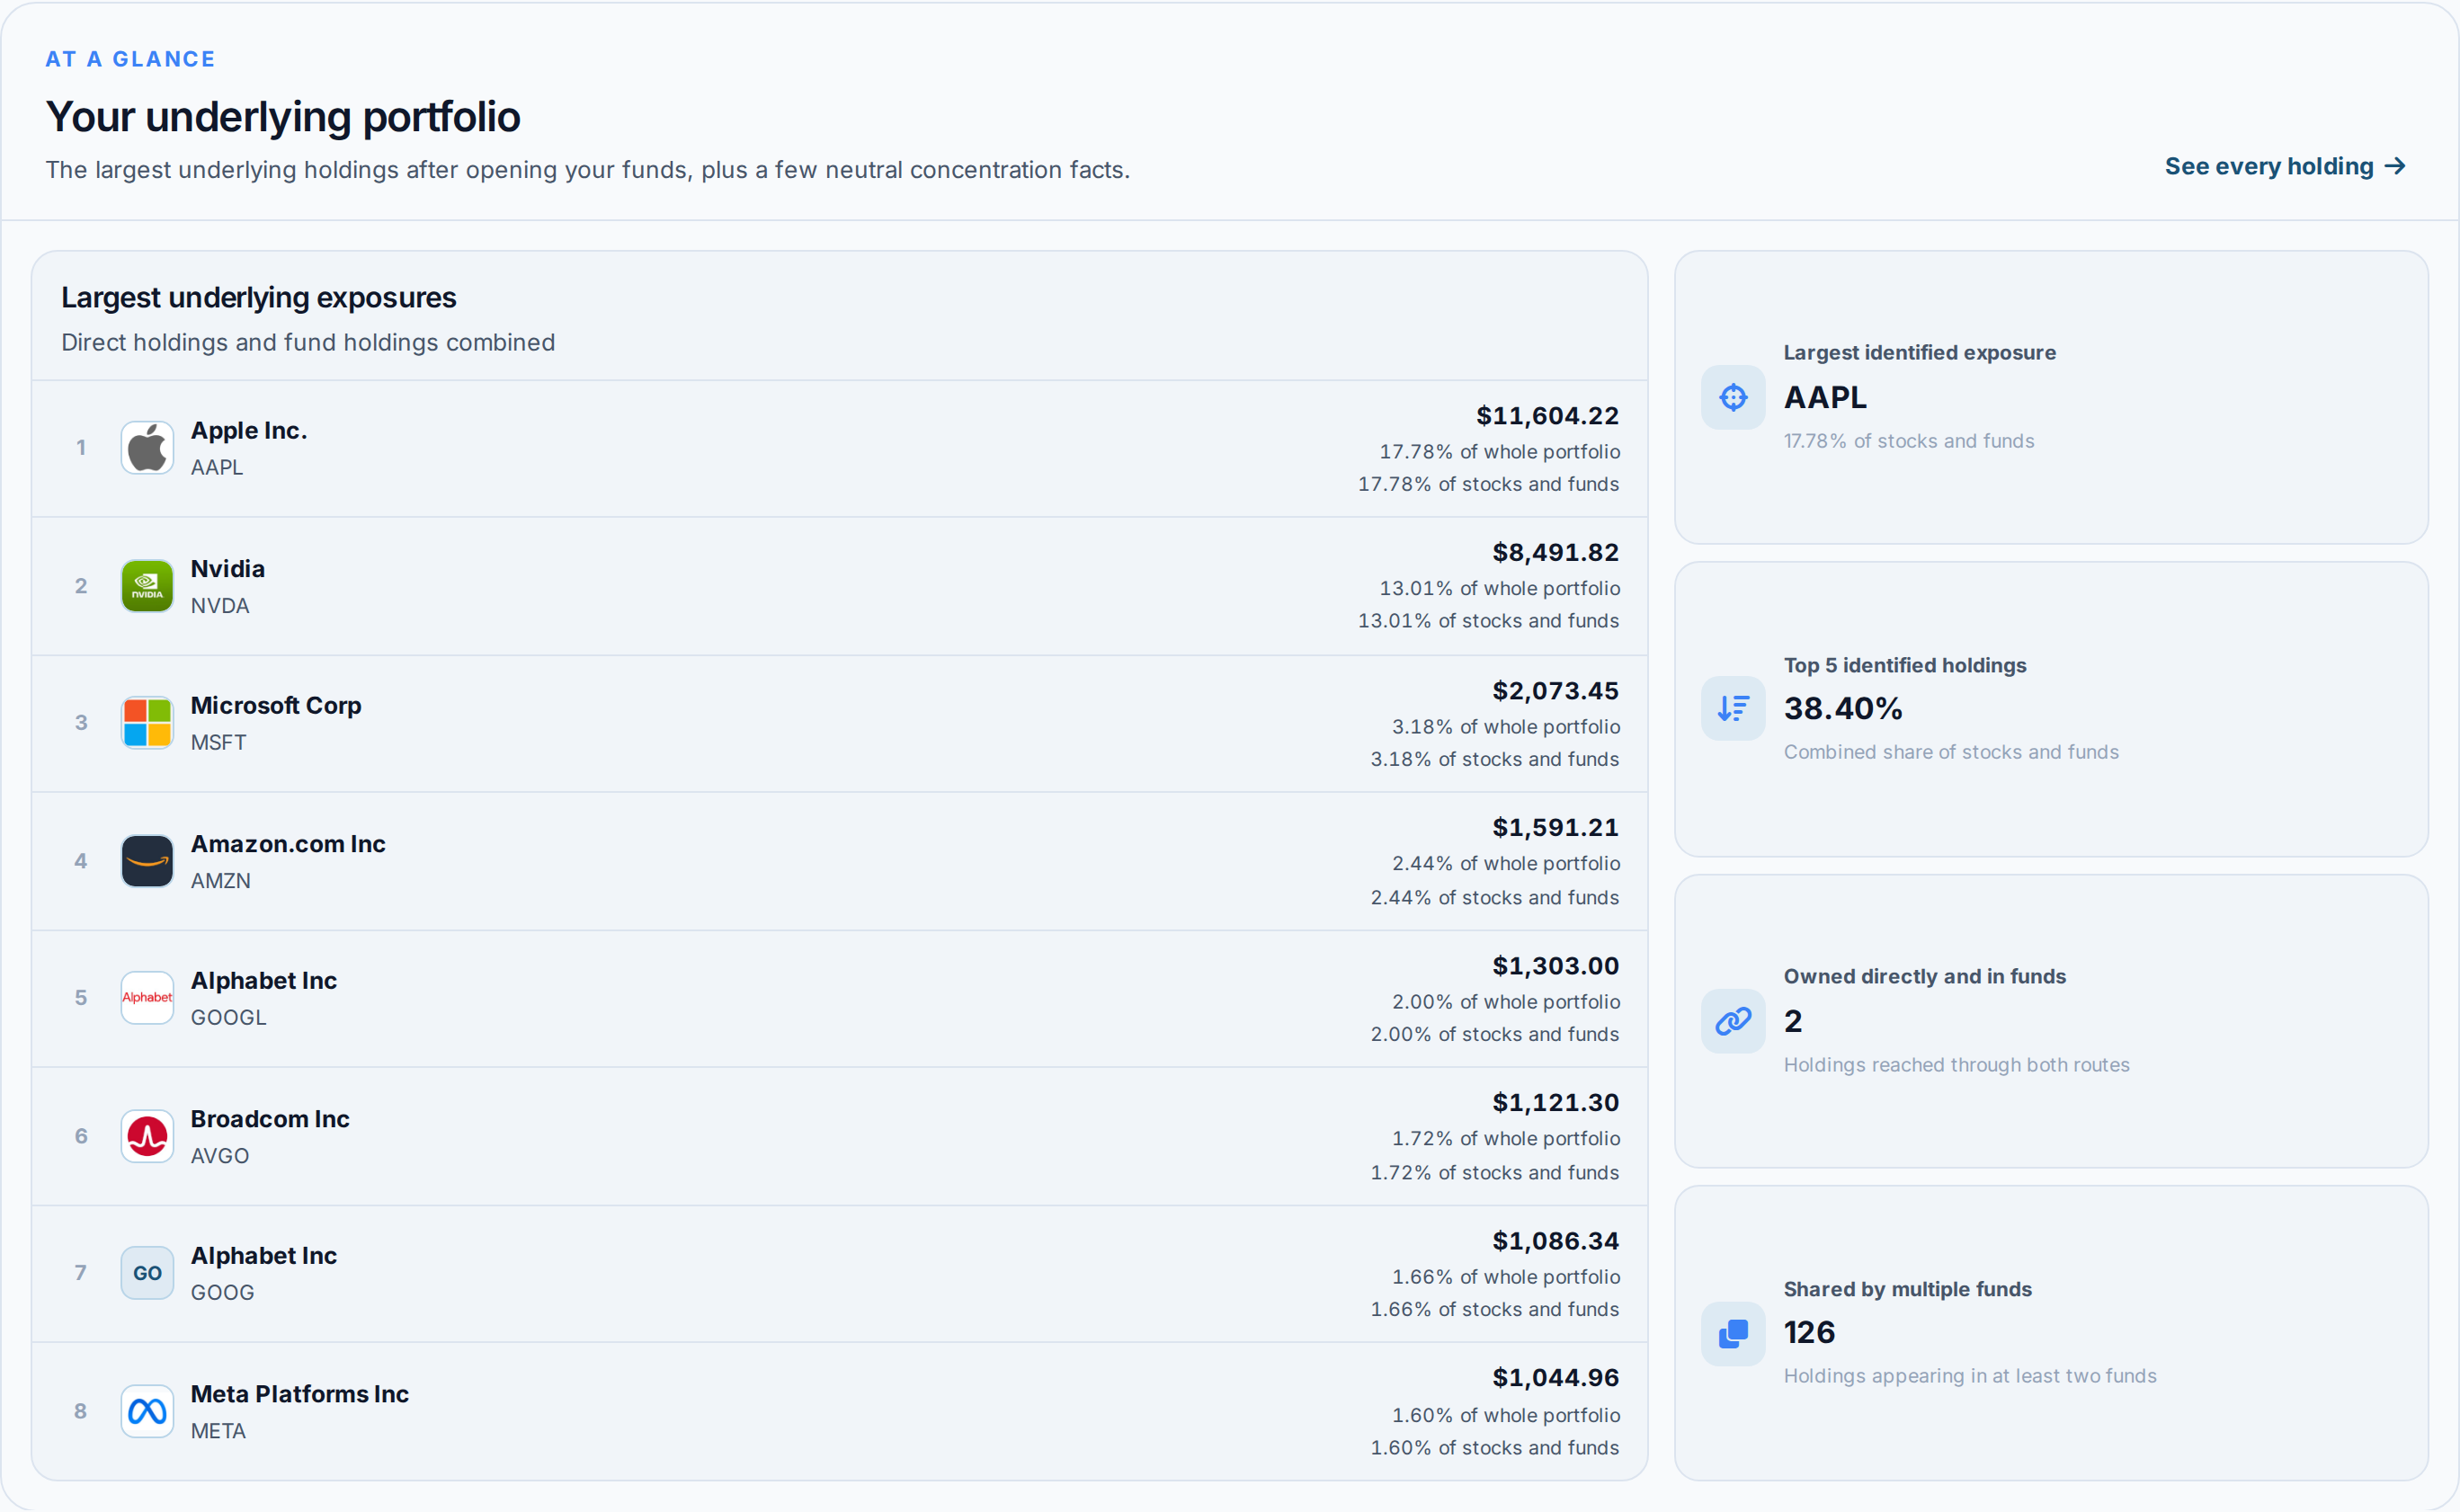
Portfolio X-Ray breaks each fund into its holdings and adds any shares you own directly. It ranks the largest underlying companies and shows top-five concentration. It also counts companies held both ways and those found in multiple funds. This portfolio has 126 companies in at least two funds.
 AllInvestView
Returns for a chosen period
The Returns report at Simply Wall St accepts a date range instead of only a preset. For a Transactions portfolio, it shows realised gains, dividend return and internal rate of return for that period. It is also where their CSV download sits, and that download covers Transactions portfolios only: a broker-linked account and a manually entered Holdings account do not get the file.
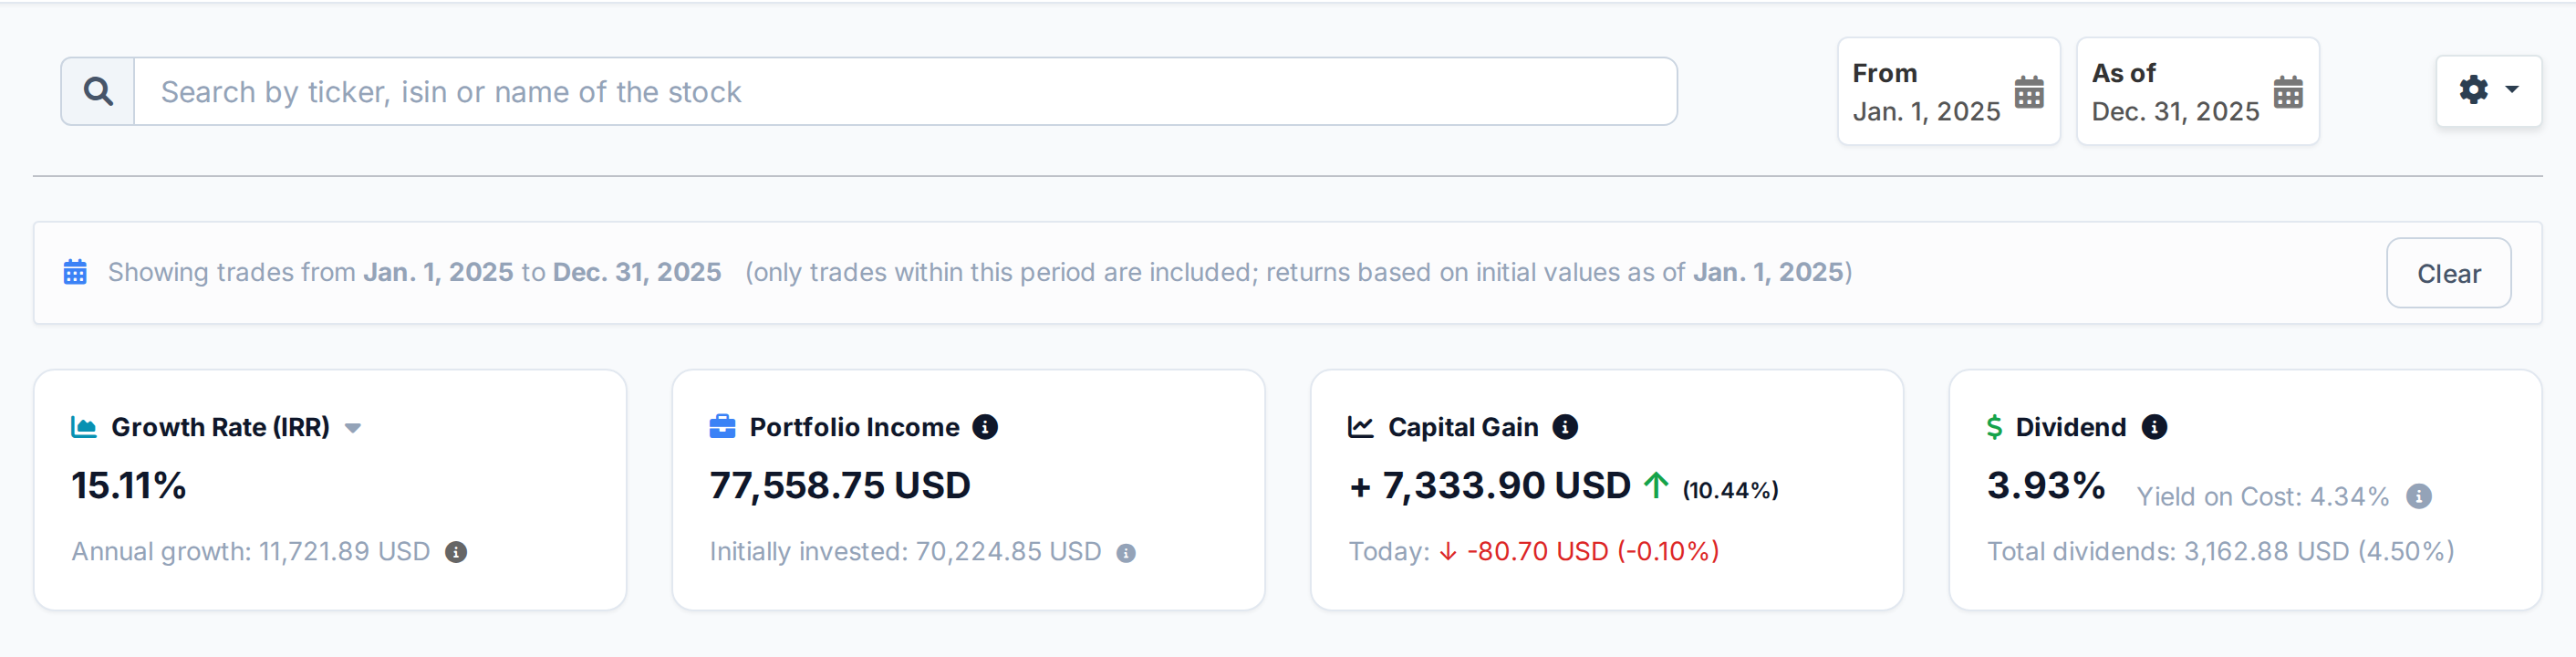
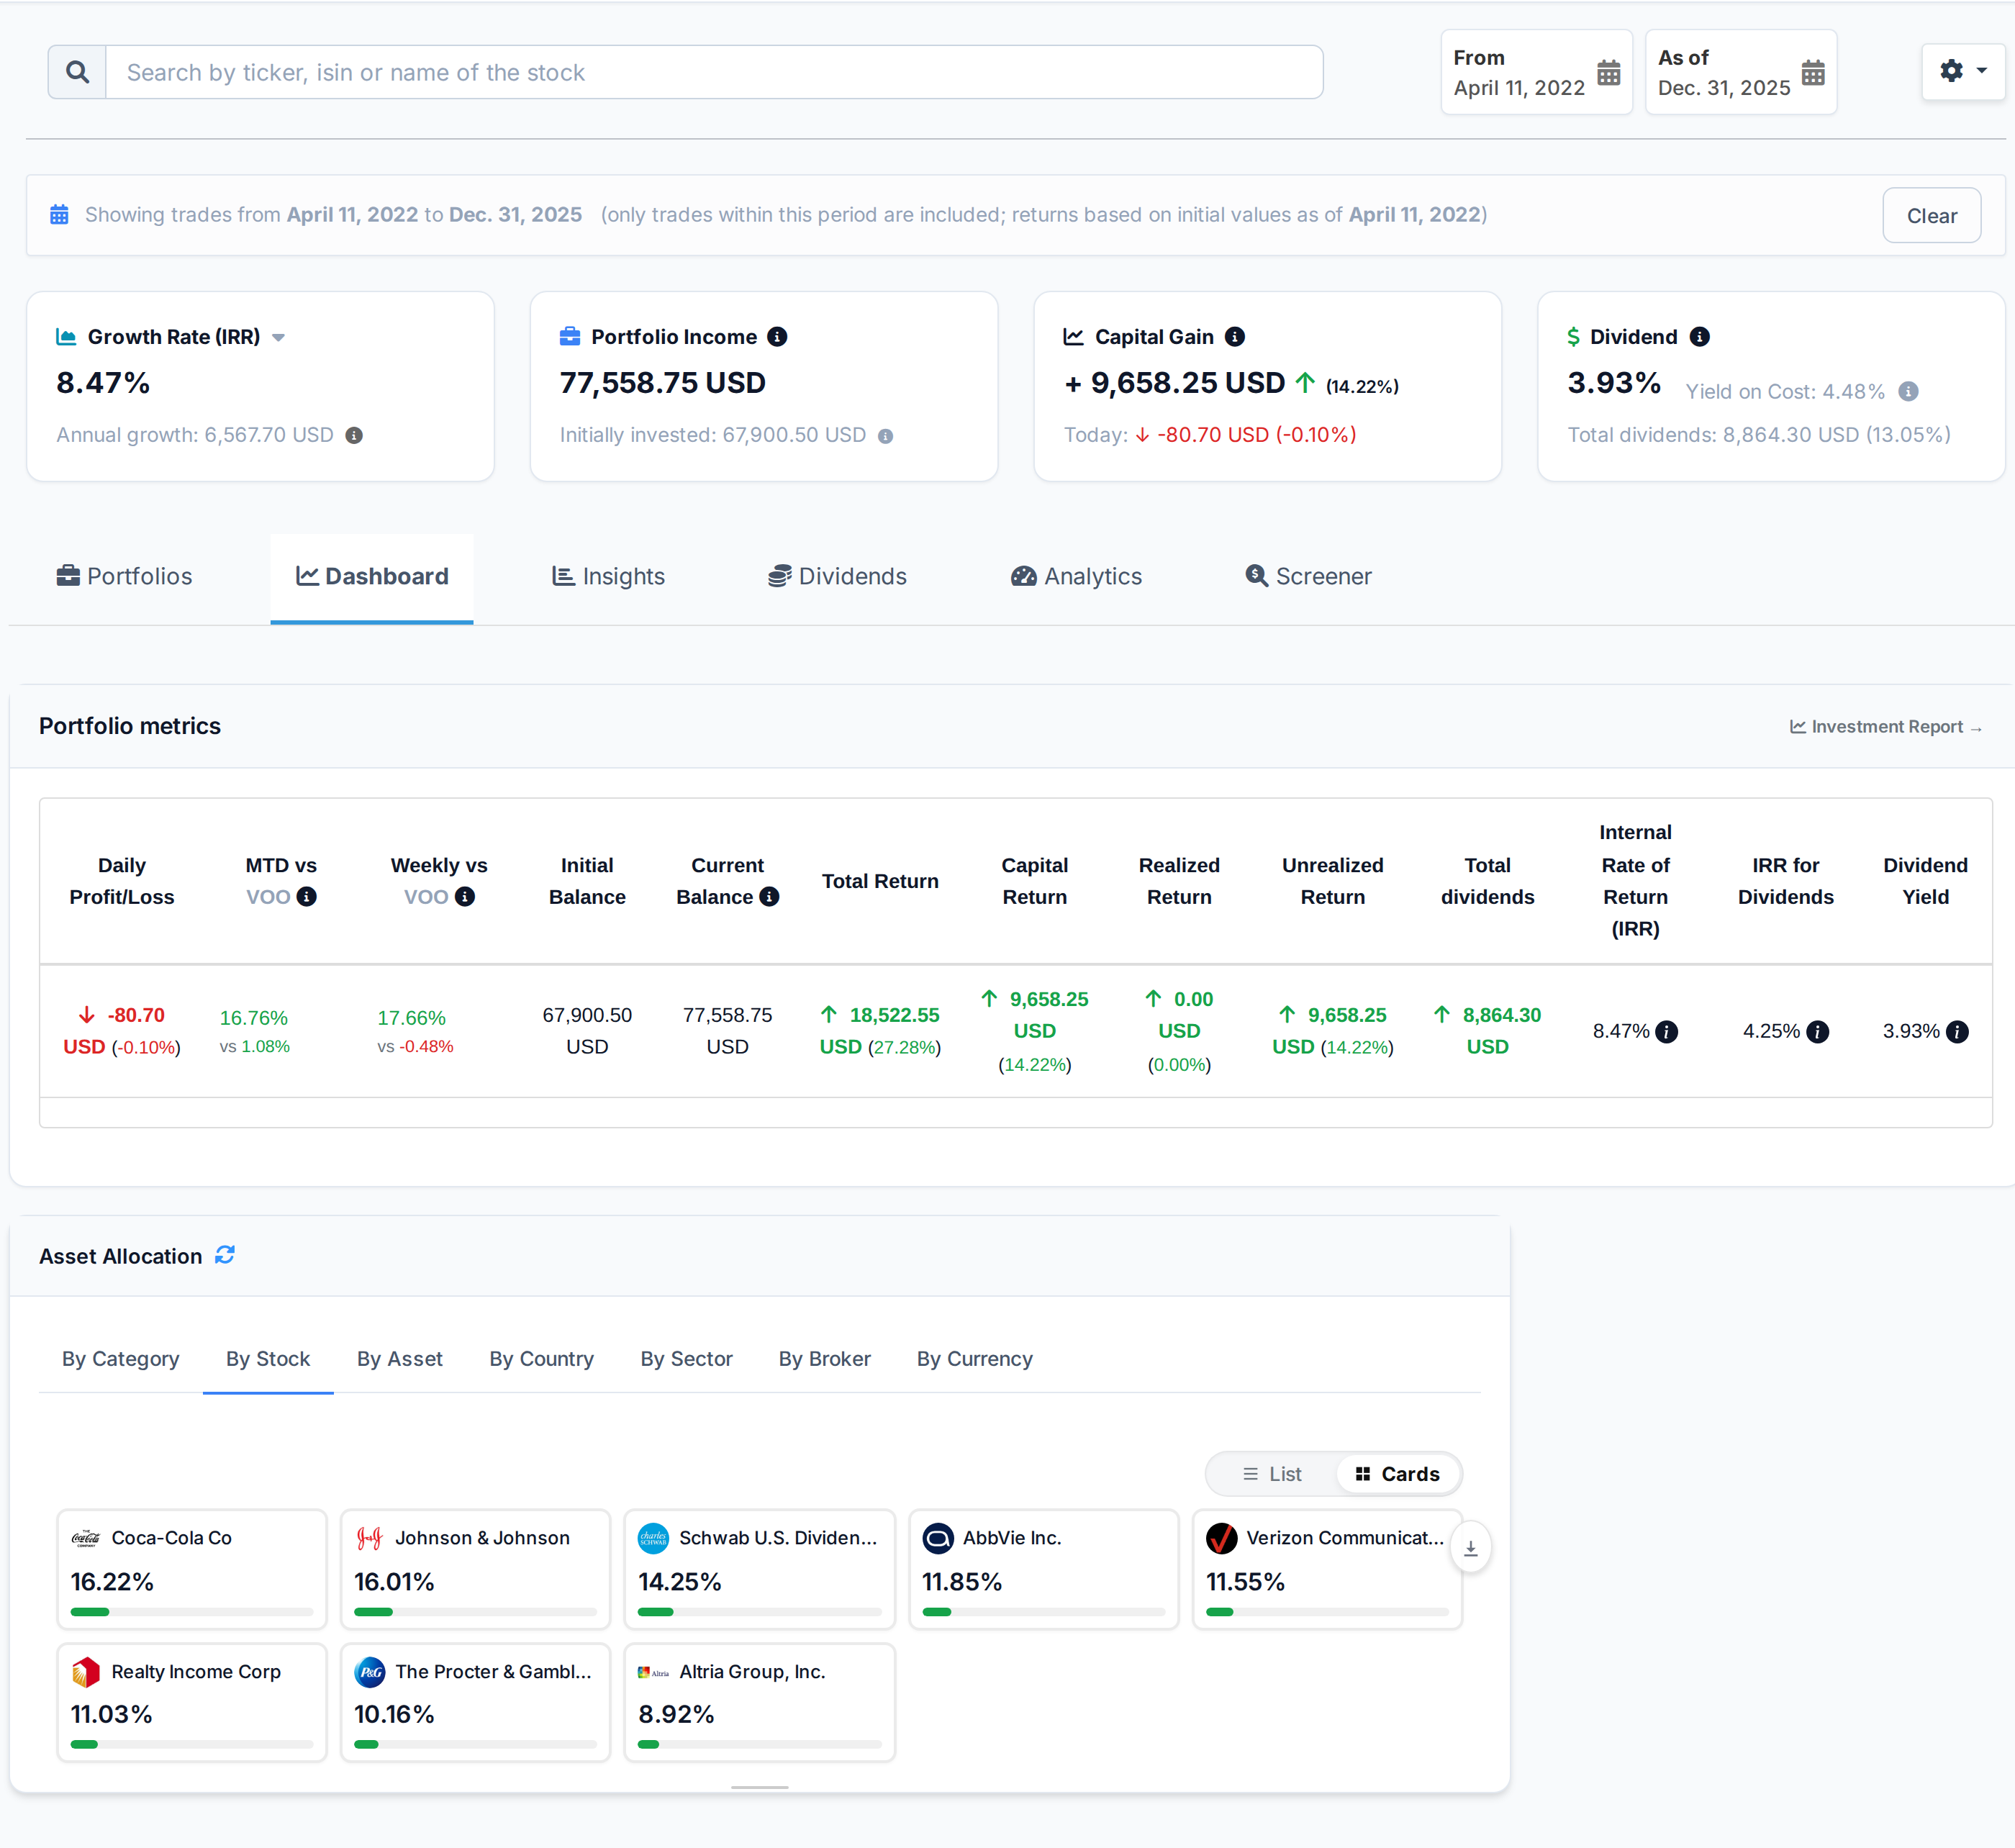
A chosen period recomputes the whole dashboard from the trades between 1 January 2025 and 31 December 2025. Every figure covers that period only. Internal rate of return 15.11 percent, capital gain 7,333.90 USD, dividend yield 3.93 percent. The same measures can cover the full investing history instead.
 AllInvestView
Cost basis and tax reports
Simply Wall St reconstructs trade history on a Transactions portfolio and adjusts for shares sold on a first in, first out basis. That is the one method it offers, and it produces a return rather than a capital gains report: no country rules, no figure for tax owed, no second method to compare the first against. It calculates returns, not the tax you owe.
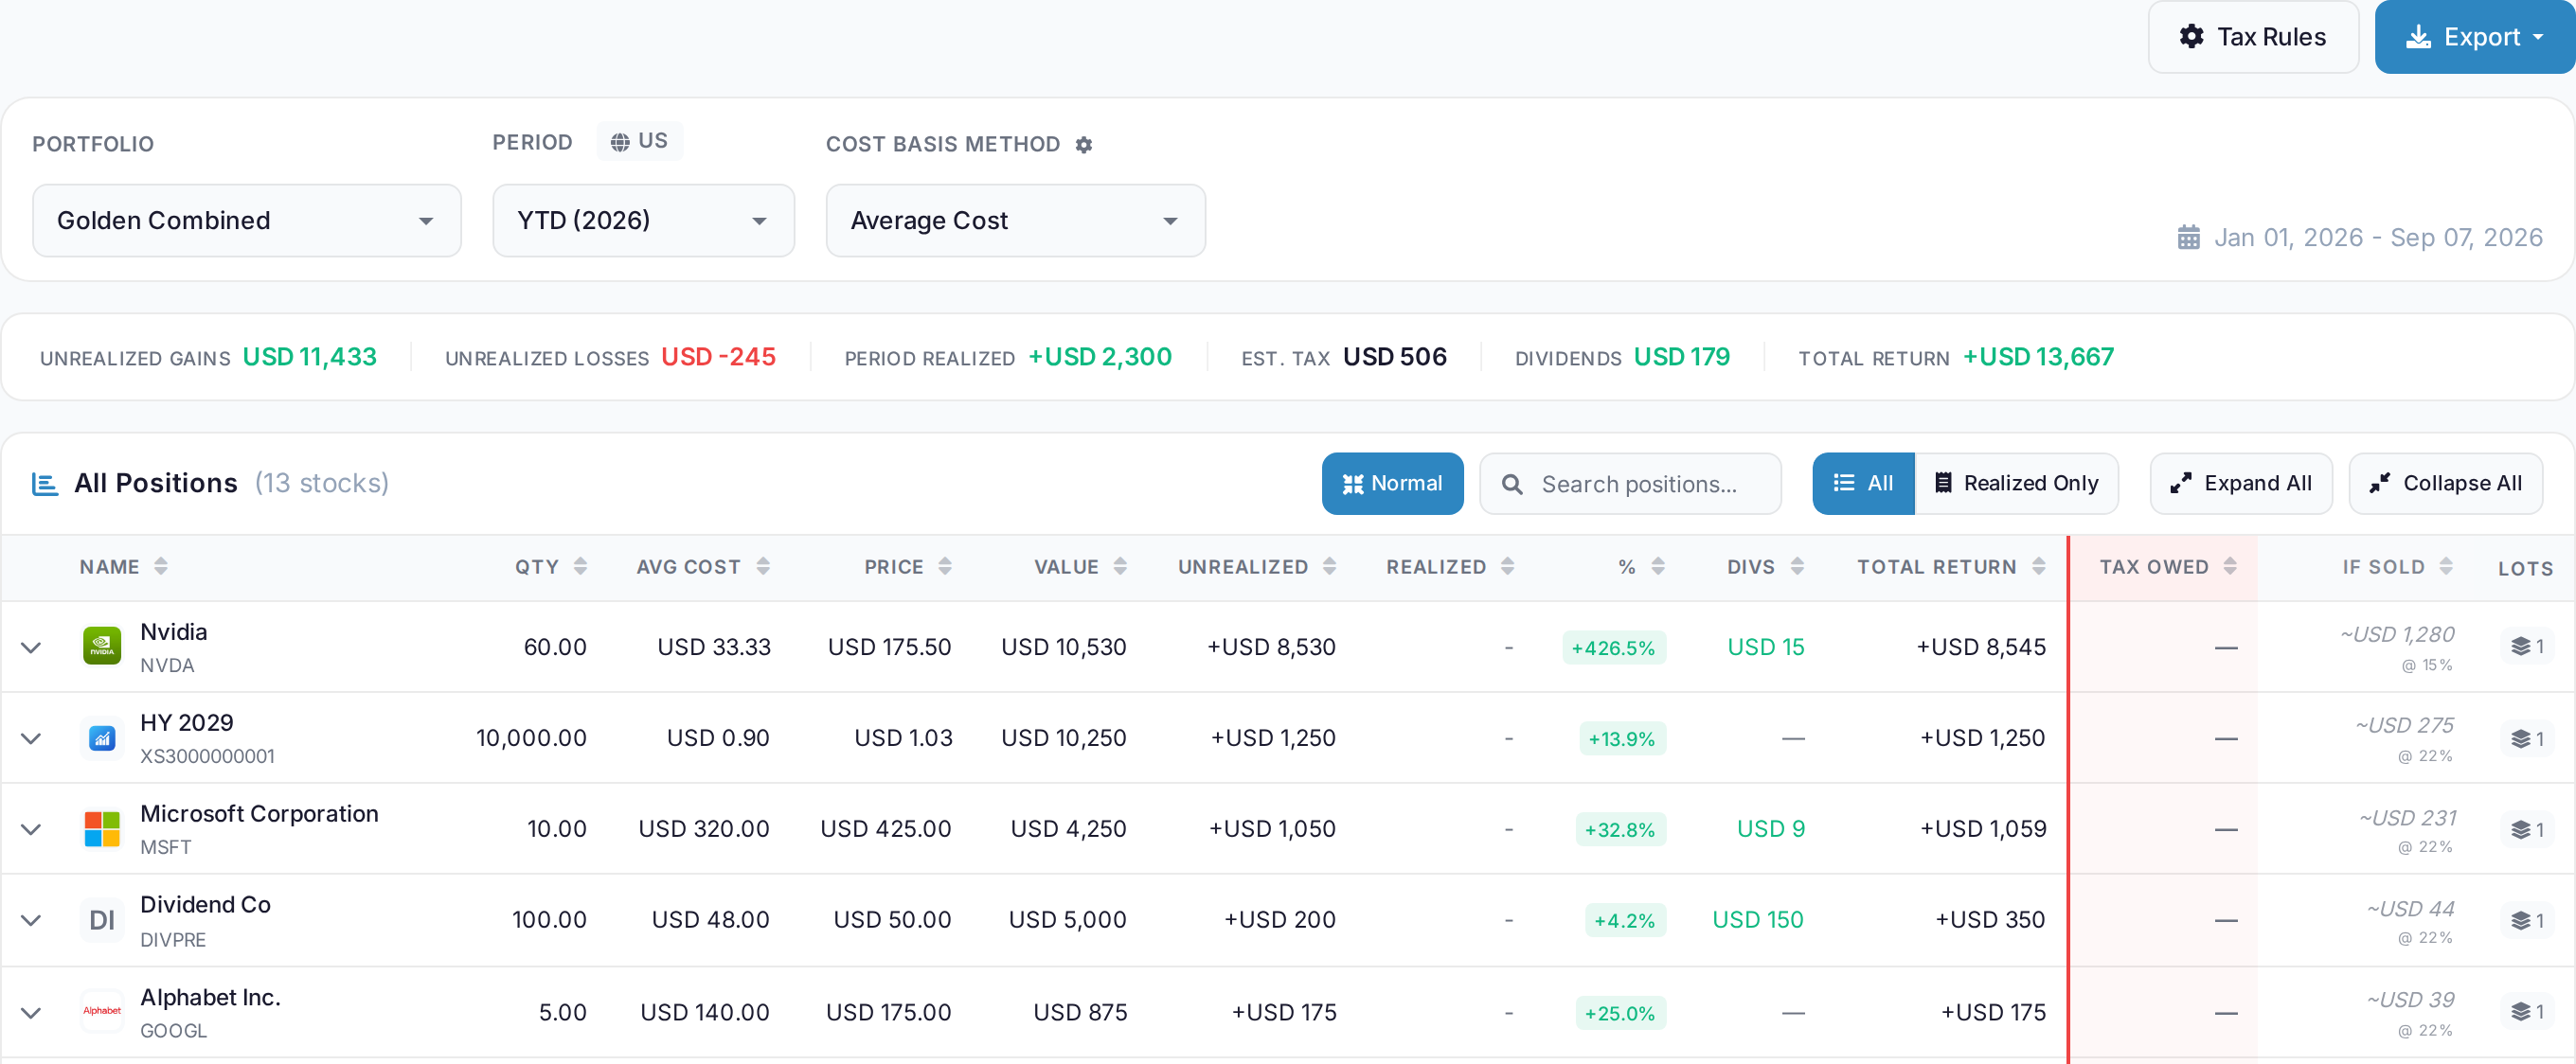
The capital gains report covers one portfolio and period under a chosen cost basis method. FIFO, LIFO, HIFO and average cost each run over the same trades. The report shows the result for each before you choose a method. The jurisdiction supplies the applicable rules, US in this example. There are rules for fourteen countries. Thirteen appear as presets, with New Zealand completing the set. Closed sales make up the realised tax totals. The open rows put a dash in Tax Owed and price the tax impact of a sale today in the If sold column.
 AllInvestView
Assets beyond listed shares
Simply Wall St is an equities product. Cash balances, cryptocurrencies, derivatives and options and mutual funds are unavailable on it, and its analysis covers listed companies. It does not track bonds or cash balances.
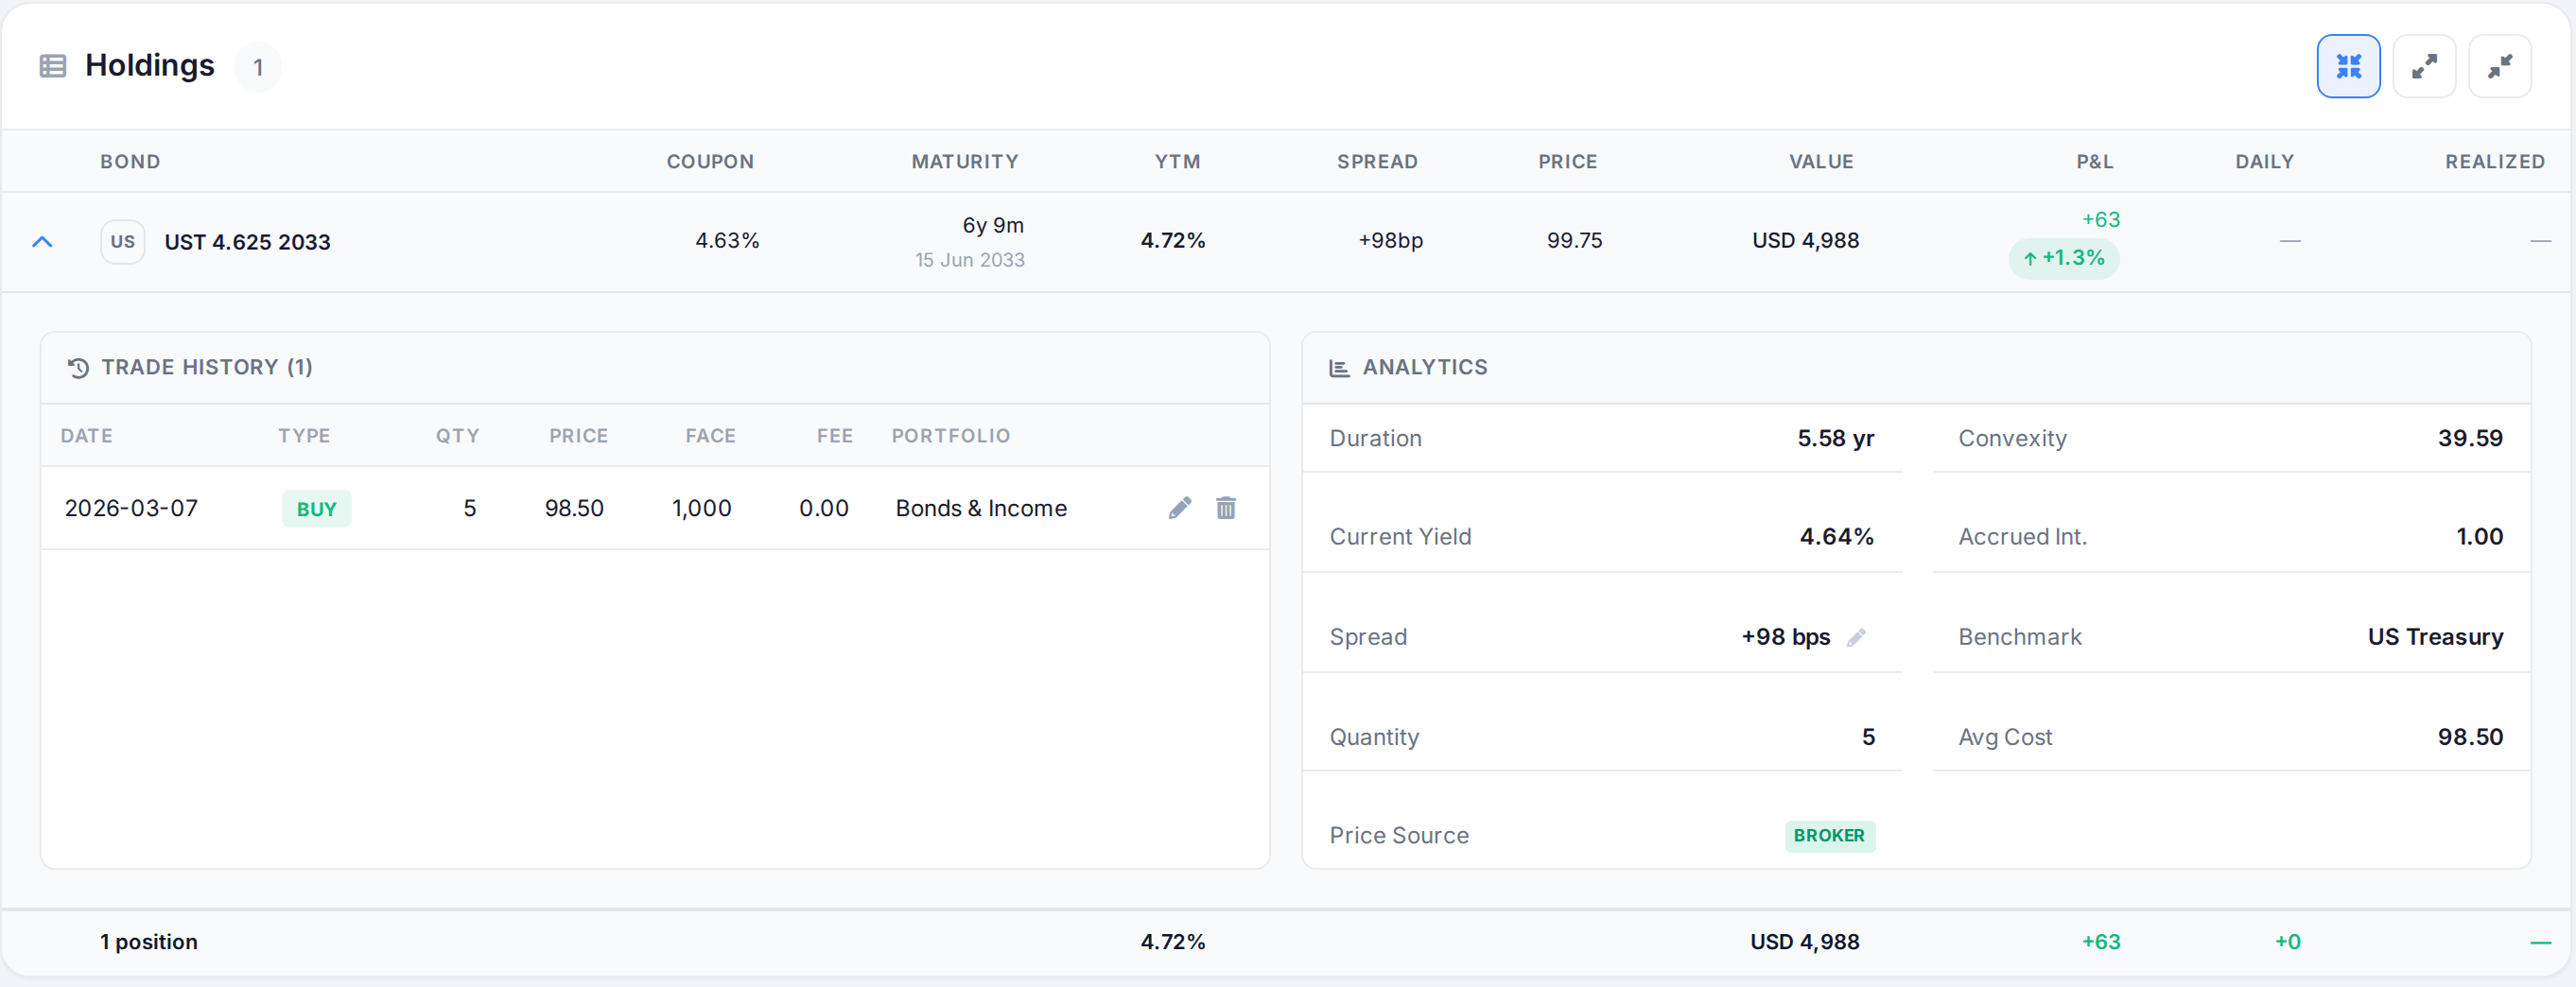
AllInvestView has a dedicated bond record. Each instrument has an ISIN, maturity and coupon, and the bond is priced off the government yield curve in that currency, then reuses the spread for later valuations. The broker price shown here is 99.75. The yield to maturity is 4.72 percent and the spread over the benchmark is 98 basis points. The same row shows accrued interest, current yield, convexity, duration and the benchmark used for calibration. Five currencies price this way: the US dollar off the Treasury curve, plus euro, sterling, Canadian and Australian issues.
 AllInvestView
Dividend history and forecasts
Simply Wall St projects three years of dividends for each holding. It starts with declared payments, then uses the last twelve months and analyst consensus. Ex-dividend dates and pay dates are included. Very few products project that far.
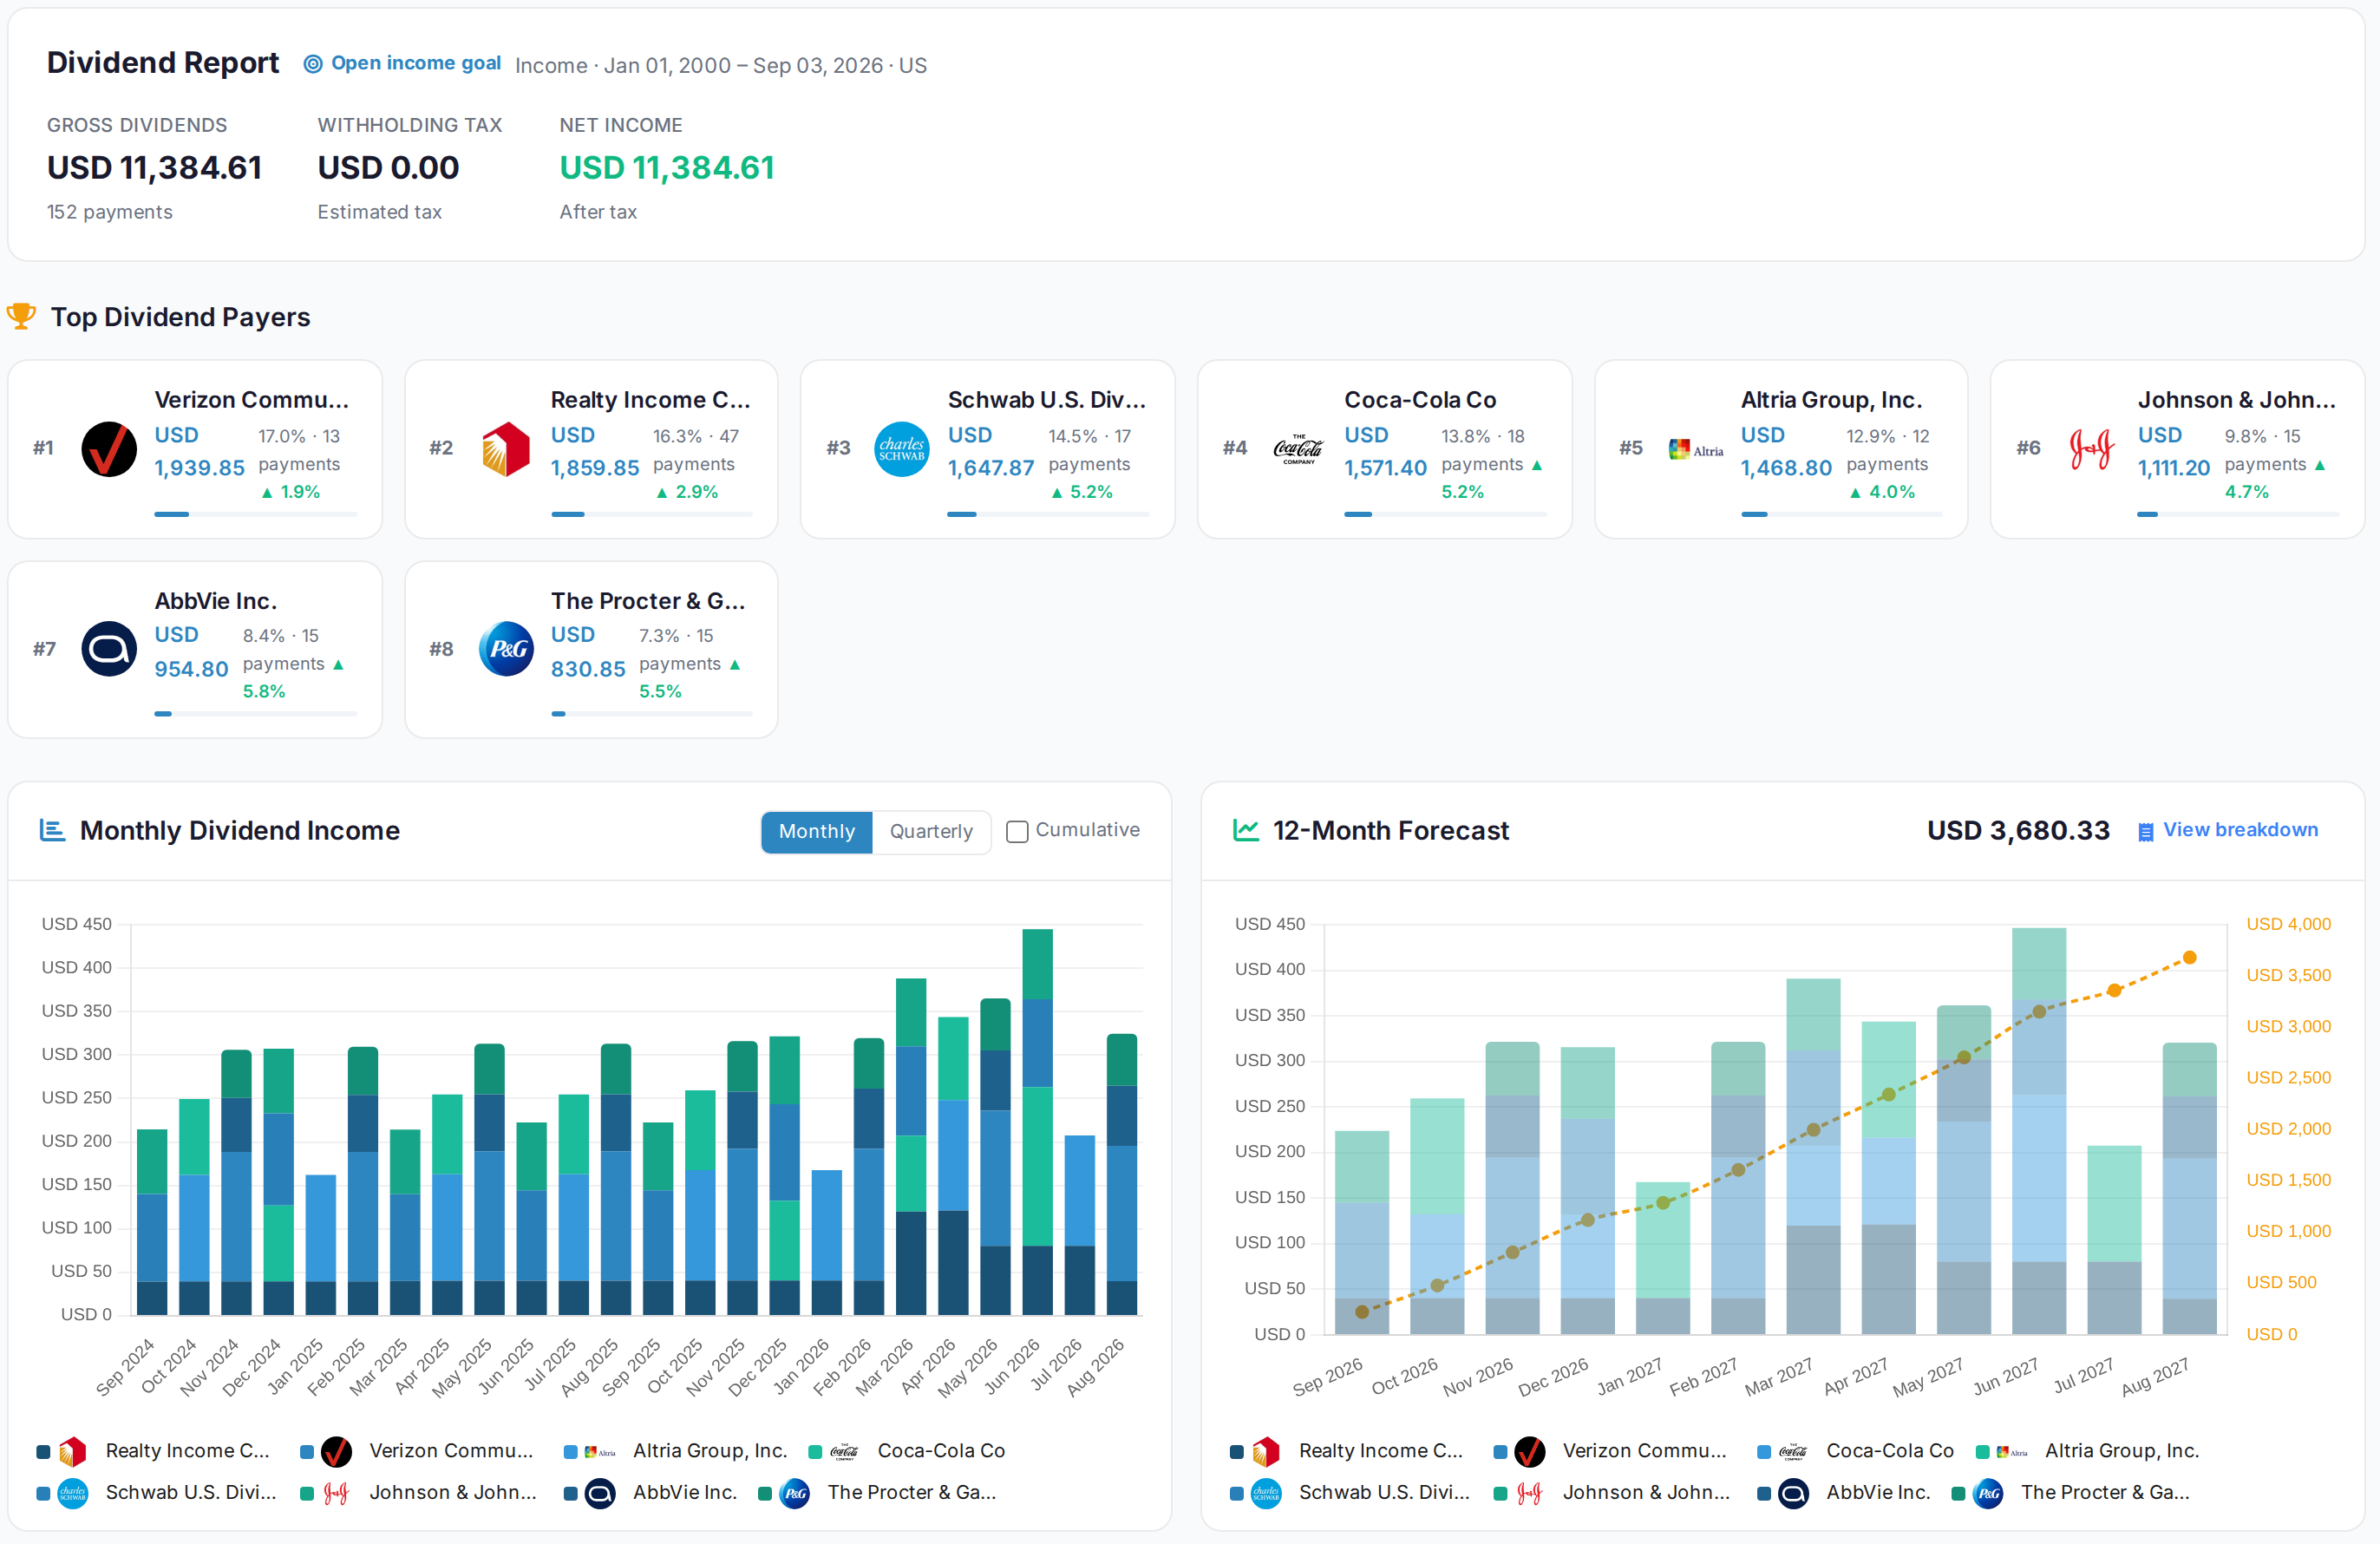
AllInvestView starts with what you actually received. This report totals 152 payments and splits each one three ways: gross, withholding, net. A non-resident holder of American shares receives the third amount because the first never reaches the account. Every large payer also has its own dividend growth rate. The monthly history is broken out by who sent the money, and the year ahead comes to 3,680.33 USD. Each projected payment is labelled with the forecast method the product assigned to it.
 AllInvestView
Your portfolio on a past date
Simply Wall St shows history as a Value Over Time chart. The fixed ranges are one month, three months, year to date, one year, two years and all time. The last two need a paid plan. The chart shows how the value moved across a preset stretch.
The past-date view can show 31 December 2025 instead of today. Its balances, dividends, total return and IRR all stop on that date. The allocation below shows every holding at its weight then. Positions opened afterwards are absent, positions closed before it are back. It supplies the year-end position an accountant needs and works on any date the portfolio existed. AllInvestView covers the portfolio features too. Simply Wall St still provides the Snowflake company research. AllInvestView adds exposure inside funds, returns for dates you choose and past portfolio values. It also holds priced bonds, option contracts and a jurisdiction tax report over all of them.
 AllInvestView
Feature Comparison Table
| Capability | Simply Wall St | AllInvestView |
|---|---|---|
| Stocks & ETFs | ||
| Visual Stock Analysis (Snowflake) | ||
| Bond Analytics (YTM, Duration) | ||
| Options with Greeks | ||
| Cryptocurrency Tracking | ||
| Liability Tracking | ||
| Capital Gains Tax Reports | ||
| Trade-Level Reconciliation | ||
| Removed trades stay removed after sync | ||
| FIFO/LIFO/ACB Methods | ||
| Multi-Jurisdiction Tax | ||
| CSV Import for Any Layout | ||
| Brokerage Sync | ||
| Global Market Coverage | ||
| Native Mobile Apps | ||
| Offline Mode | ||
| Lifetime Pricing | ||
| Free Plan |
Pricing Breakdown
Simply Wall St requires annual billing for paid plans:
| Plan | Price | Key Features |
|---|---|---|
| Free | $0 | 1 portfolio, 10 holdings, 5 company reports a month, no saved screeners |
| Premium | Annual billing | 3 portfolios, 30 holdings each and broker linking |
| Unlimited | $259.99/year on the App Store | 5 portfolios, unlimited reports, Excel and PDF export, full features |
AllInvestView offers flexible options:
| Plan | Price | Key Features |
|---|---|---|
| Free | $0 | Full tracking, limited holdings |
| Advanced | $11.99/month | Unlimited holdings, tax reports, flexible file import |
| Lifetime | One-time payment | All Advanced features forever, no recurring fees |
Simply Wall St Unlimited is listed at $259.99 a year in the App Store. AllInvestView Advanced costs $143.88/year.
Add a Complete Ledger to the Stock Research
AllInvestView handles bonds, options and crypto, and provides capital gains reports that Simply Wall St does not.
Which tool to choose
AllInvestView covers the portfolio view you use Simply Wall St for: holdings, values, allocation and returns stay together across every account.
AllInvestView finds companies held through more than one fund. You can also set the dates for returns, view past holdings and prepare capital gains under local rules.
It also tracks bonds, options, crypto and liabilities in the same net worth record. Simply Wall St has the stronger Snowflake company research.
Common Questions
Does Simply Wall St support bonds and options?
No. Simply Wall St focuses on stocks and ETFs. AllInvestView holds bonds priced from the government yield curve and option contracts with current Greeks.
Which platform has better tax reporting?
Simply Wall St applies FIFO to a Transactions portfolio. AllInvestView compares FIFO, LIFO, HIFO and average cost, with capital gains reports under rules for fourteen countries.
Can I track my net worth including mortgage on Simply Wall St?
Simply Wall St tracks assets rather than liabilities. AllInvestView records mortgages, loans and margin debt beside the assets to calculate net worth.
How do I move my data from Simply Wall St to AllInvestView?
Simply Wall St exports the Returns report of a Transactions portfolio as CSV. That file or a broker export can rebuild the history in AllInvestView.
Is Simply Wall St data real-time?
No. Simply Wall St updates its company data daily. AllInvestView maintains current market prices for the positions in the portfolio.