Glossary · returns

Total Return: Formula, Calculator and Price Return vs Total Return

Total return is everything an investment made you: the change in its price plus the dividends or interest it paid, as a percentage of what you put in. The formula is (end value − start value + income) ÷ start value. A share price chart only shows the first half, which is why a stock that paid you well for ten years can look like it went nowhere.

$10,000 in SPDR S&P 500 ETF Trust (SPY), 26 October 2016 to 26 October 2026

Price only$35,808+258.08%
Price plus $2,861 of dividends kept as cash$38,669+286.69%
Dividends reinvested$41,959+319.59%
Total return, dividends reinvested319.59%15.42% a year, against 13.61% a year on price alone
Dividends reinvestedDividends kept as cashPrice only

Same fund, same ten years, three answers. The price chart says $35,808. Add the 40 quarterly dividends and it's $38,669. Reinvest each one at the close on its ex-dividend date and it's $41,959: $6,151 more than the price alone, about a fifth of the whole gain.

Total return calculator

Enter what you put in, what it's worth now and the income it paid. It splits the result into price and income, and gives the yearly rate.

$
$
$
$
$
Total return
+286.69%

Price return +258.08%Income return +28.61%
Gain in money+$28,669
A year14.48%

If you reinvested the dividends, tick the box: the shares they bought are already in the value now, or in the shares you hold now. Fees when buying count as part of what you put in; fees when selling come off what you got. With dates, the years are the days between them ÷ 365.25.

How to calculate total return

Total return is two returns added together: what the price did, and what the investment paid you. SPY, with the dividends kept as cash.

Total return = (End value − Start value + Income) ÷ Start value

Price return

$35,808 − $10,000 = $25,808, divided by the $10,000 you started with.

258.08%

Income return

The $2,861 of dividends the fund paid over the ten years, divided by the same $10,000.

28.61%

Total return

($25,808 + $2,861) ÷ $10,000. In money, you made $28,669.

286.69%

With the dividends reinvested

Reinvested dividends buy more shares, so they end up inside the end value and the income term is zero: ($41,959 − $10,000) ÷ $10,000 = 319.59%. The extra 32.9 points over the cash version is what those reinvested dividends earned on top.

To turn either one into a yearly rate, take (1 + total return)1/years − 1. 4.19591/10 − 1 is 15.42% a year, the CAGR.

In Excel or Google Sheets

Start value in A2, end value in B2, income in C2, years in E2, and the first formula in D2.

=(B2-A2+C2)/A2Total return. 286.69% for the SPY example, formatted as a percentage.
=(B2-A2)/A2Price return alone, 258.08%.
=(1+D2)^(1/E2)-1The yearly rate, with the total return in D2: 14.48% a year.

Price return vs total return

Ten years, 26 October 2016 to 26 October 2026, as a yearly rate, with dividends reinvested. Sorted by how much the dividends added.

Verizon's share price fell over the decade, from $47.63 to $43.10, yet $10,000 in it with the dividends reinvested became $15,616. Altria's price barely moved and its total return was 127.62%. At the other end, QQQ pays so little that its two lines nearly touch. For a high-yield stock like those two, the price chart misses most of the return.

S&P 500 total return by year

The S&P 500 quoted on the news is the price index. S&P also runs a total return index with every dividend reinvested.

YearPrice onlyWith dividendsTotalDividends addedAdded
2016+9.54%+11.96%
+2.42 pts
2017+19.42%+21.83%
+2.41 pts
2018−6.24%−4.38%
+1.86 pts
2019+28.88%+31.49%
+2.61 pts
2020+16.26%+18.40%
+2.14 pts
2021+26.89%+28.71%
+1.82 pts
2022−19.44%−18.11%
+1.33 pts
2023+24.23%+26.29%
+2.06 pts
2024+23.31%+25.02%
+1.71 pts
2025+16.39%+17.88%
+1.49 pts
2026 to 26 Oct+12.14%+13.18%
+1.04 pts
10 years+258.82%+323.18%
+64.36 pts

One to almost three points a year, every year

From 2016 to 2025 the dividends added between 1.33 and 2.61 points to the index's return each year. In a falling year like 2022 they softened the loss, from −19.44% to −18.11%.

Over the ten years to 26 October 2026, that's the difference between +258.82% and +323.18%. When someone compares a fund with "the S&P 500", check which of the two they used: a fund's own return already counts its dividends.

SPY returned 319.59% over the same dates, a little under the index's 323.18%. That's about 0.1 point a year, close to the fund's 0.0945% yearly fee, which an index doesn't pay; the rest is small tracking differences.

S&P 500, price only+258.82%10 years to 26 Oct 2026
S&P 500 Total Return+323.18%same dates, dividends reinvested

Years are 31 December to 31 December; 2026 runs to 26 October, and the 10-year row from 26 October 2016 to 26 October 2026.

Reinvested or taken as cash

Index and fund returns assume every dividend goes straight back in. Yours depends on what you actually did with them.

Reinvesting usually adds up

SPY's dividends kept as cash left you with $38,669 after ten years. Reinvested on their ex-dividend dates, they made it $41,959, because each one bought shares that grew and paid dividends of their own.

Neither is wrong. If you spend the dividends, the cash version is your real total return, and comparing it with a fund's published figure makes you look worse than you did.

+$3,290from reinvesting, SPY 10 years

Not always

iShares 20+ Year Treasury Bond ETF (TLT) fell 38.21% on price over the same ten years. With its interest kept as cash, the total return was −14.56%. Reinvested, it was −17.66%, because every dividend bought more of a fund that kept falling.

Reinvesting is a bet that the thing you own keeps doing well. Over long stretches in stocks it has paid off; it isn't automatic.

−17.66%TLT reinvested, vs −14.56% as cash

Total return on bonds

For a bond, the income is the coupon. It's usually most of the return, and the price can go either way.

A bond fund: AGG over ten years

iShares Core US Aggregate Bond ETF lost 13.81% on price from 26 October 2016 to 26 October 2026, mostly in 2022 when rates jumped. Its interest payments turned that into a total return of +14.81%, 1.39% a year, with them reinvested.

A bond fund's price chart can look like a loss for years while the fund is still paying you. How hard the price falls when rates rise is its duration.

A single bond

Buy a bond at 95 with a 4% coupon, hold it three years and sell at 98. Price return: 3 ÷ 95 = 3.16%. Coupons: 3 × 4 = 12, or 12.63% of what you paid. Total return: 15 ÷ 95 = 15.79%.

Hold it to maturity and the price part is known in advance: it goes to 100. The yield to maturity is the yearly return you'd earn if every payment arrives and you reinvest the coupons at that same yield.

Your own total return

The formula assumes one amount in at the start. A real account is messier.

When you add or take out money

Money you deposit shows up in the end value but isn't a return. Take it out of the gain first, or use a rate that handles it: the time-weighted return for how your investments did, and the IRR for what your own money earned. The rate of return guide works through both with a second deposit.

Taxes and fees

A fund's published total return is after its own costs and before your taxes. Tax withheld on dividends, tax on the gain when you sell, and trading fees all come off your return on top. The calculator above takes the fees; for what you'd owe, the dividend tax calculator and the capital gains tax calculator do the rest.

Your portfolio's total return, counted for you

Every dividend, every sale and every account in one figure, with the price-only figure beside it.

Your portfolio

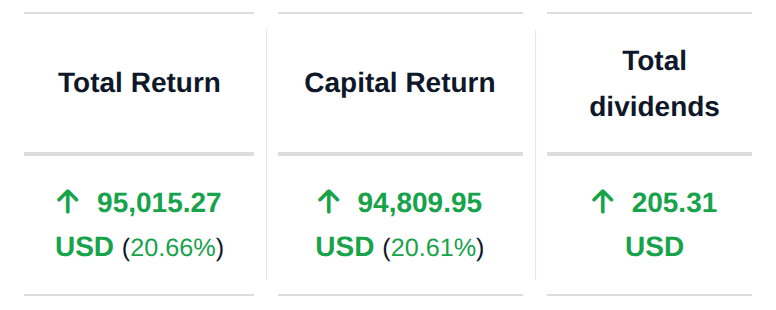
Total Return and Capital Return, side by side

The dashboard's metrics row splits what you've made the same way this page does. Capital Return is the price gain, sold and unsold. Total Return adds every dividend on top. It covers every account in the portfolio, at any broker. For bonds, the bond report does the same with coupons: each bond's total return is its price gain plus the coupons it paid you plus what its sales realized.

See your total return
AllInvestView AllInvestView portfolio metrics for seven accounts held together: Total Return 95,015.27 USD (20.66%), Capital Return 94,809.95 USD (20.61%), Total dividends 205.31 USD AllInvestView portfolio metrics for seven accounts held together: Total Return 95,015.27 USD (20.66%), Capital Return 94,809.95 USD (20.61%), Total dividends 205.31 USD
Three columns of the dashboard metrics row, for a demo portfolio of seven accounts held together. Total Return is the Capital Return plus the dividends. Staged capture.View full-size View full-size
Every broker in one place

See what your investments really returned

Add the accounts you hold and AllInvestView counts the dividends, the coupons and the sales for you, so the return you see is the whole return, next to your benchmark and your IRR.

Dividends in every return Stocks, funds and bonds Free plan available

Questions about total return

What is total return in simple terms?

It's everything an investment made you over a period: the change in its price plus the dividends or interest it paid, as a percentage of what you started with. $10,000 in SPY in October 2016 was worth $35,808 ten years later on price alone, but $41,959 with its dividends reinvested. The second figure, a total return of 319.59%, is what an investor actually ended up with.

How do you calculate total return?

Take the ending value, subtract the starting value, add the income you received, and divide by the starting value. With $10,000 in SPY, $35,808 at the end and $2,861 of dividends kept as cash: (35,808 - 10,000 + 2,861) / 10,000 = 286.69%. If you reinvested the dividends, they are already in the ending value, so the income is zero: (41,959 - 10,000) / 10,000 = 319.59%.

What is the difference between price return and total return?

Price return counts only the change in price. Total return adds the dividends or interest. For a fund like QQQ that pays little, the two are close: 19.66% a year on price over the ten years to October 2026, 20.47% in total. For Altria they were 1.33% and 8.57% a year, and for Verizon the price fell while the total return was 4.56% a year.

Does the S&P 500 return include dividends?

The S&P 500 figure quoted on the news is the price index, without dividends. S&P also publishes a total return index with every dividend reinvested. In 2025 the price index rose 16.39% and the total return index 17.88%; over the ten years to 26 October 2026 they rose 258.82% and 323.18%.

Does total return assume dividends are reinvested?

Index total returns and the returns in fund factsheets do: every dividend is put back into the index or the fund. Your own total return depends on what you did. If you took the dividends as cash, your total return is the price change plus the cash, which for SPY over the last ten years was 286.69% rather than 319.59%.

Is total return the same as annualized return?

No. Total return is the whole gain over the period. The annualized return, or CAGR, spreads it into a steady yearly rate: SPY's 319.59% over ten years is 15.42% a year, because 1.1542 multiplied by itself ten times is 4.1959.

Is total return before or after taxes and fees?

A fund's published total return is after its own expenses but before your taxes and any trading costs. Over the ten years to October 2026 SPY returned 319.59% and the S&P 500 total return index, which pays no fees, 323.18%; the fund's 0.0945% yearly fee is most of that gap. Tax withheld on dividends or paid on the gain comes off your own return on top of that.

Sources

Checked on 29 October 2026.

Fund and stock figures are worked out by AllInvestView from daily closing prices and dividends, 26 October 2016 to 26 October 2026, each dividend reinvested at the close on its ex-date, with no trading costs or taxes. Dividends kept as cash are counted from their ex-dates too, so SPY's $2,861 includes the $88 dividend that went ex on 18 September 2026 and was paid on 30 October. Index figures are the S&P 500 and S&P 500 Total Return closes. None of it is investment advice.