Seeking Alpha and AllInvestView
Seeking Alpha is a research and content platform. AllInvestView is a portfolio tracker. They share basic portfolio features but solve different parts of the investing workflow.
Seeking Alpha
Investment research platform with thousands of crowdsourced articles, proprietary Quant Ratings, earnings call transcripts, and analyst estimates. Strong for individual US stock research.

AllInvestView
FeaturedMulti-asset portfolio tracker with broker sync, bond YTM, options Greeks, crypto, real estate and multi-currency, plus capital-gains rules for fourteen countries.
Seeking Alpha
Seeking Alpha's core strength is the volume and depth of stock research articles, plus the proprietary Quant Ratings system that scores stocks algorithmically across multiple factors.
Where Seeking Alpha Excels
- Thousands of crowdsourced stock analysis articles
- Proprietary Quant Ratings and Factor Grades for US stocks
- Earnings call transcripts and analysis
- Large community of contributing analysts
- Wall Street analyst estimates aggregated
- Stock screener with rating-based filters
What Seeking Alpha does not cover
- Premium plan costs $299/year; Pro costs $2,400/year
- Quality of crowdsourced articles varies wildly between authors
- Broker linking, Quant Ratings and premium articles all sit behind Premium
- US stock focus – limited international coverage
- No bond instruments with YTM, no options Greeks, no capital gains report
- No formal capital gains tax reports
- Portfolio tracking is functional but not the primary focus
AllInvestView
AllInvestView combines your broker accounts and asset types. It then uses that portfolio for analytics and tax reports.
- Multi-broker sync: Broker accounts from 30+ firms update automatically. Coverage includes Interactive Brokers, Schwab, Fidelity, Robinhood, Trading 212, DEGIRO, Public, Wealthsimple, eToro and AJ Bell.
- Tax reports across borders: Fourteen jurisdiction rule sets are ready to use.
- Bond mathematics: Yield to maturity, modified duration, convexity, accrued interest and a bond ladder, with prices calculated from the government yield curve.
- Options analytics: Real-time Greeks (Delta, Gamma, Theta, Vega, Rho), covered call calculator, multi-leg payoff diagrams.
- Multi-currency: Native currency per holding, historical FX at trade date for accurate tax cost basis.
- Real estate, crypto, custom assets: Property tracking with rental income, native crypto support, custom assets like collectibles or private equity.
- Advanced analytics: Monte Carlo simulation, Efficient Frontier, Value at Risk, Sharpe/Sortino, benchmark comparison.
- AI portfolio assistant: Natural-language portfolio queries.
- Lifetime payment option: $497 one-time, no recurring fees.
Research Depth
Seeking Alpha is stronger for stock research. Its article library, Quant Ratings and earnings transcripts support investors who choose individual stocks through fundamental research.
AllInvestView shows fundamentals on each holding (P/E, dividend yield, market cap, sector, beta) but does not aim to replace a research platform. It points you at the data; it doesn't generate analyst commentary.
Portfolio Tracking
AllInvestView wins clearly. It brings several brokers into one portfolio. Seeking Alpha links US-based brokers on Premium and PRO and updates them daily. AllInvestView also tracks several asset types and currencies, prepares country tax reports and shows projected dividends on a calendar. Seeking Alpha focuses on equities, uses US dollars and does not generate tax reports. Its portfolio module is secondary to its research.
Asset Coverage
Seeking Alpha brings deeper research per stock; AllInvestView brings global exchange coverage.
Coverage spans equities, funds, commodities and crypto, not individual bonds.
Holds individual bonds as instruments, with yield to maturity, duration and convexity calculated from the government yield curve.
Shows options data on a stock, on web and in the app.
Holds the contracts themselves, with Greeks per position and eleven multi-leg strategy templates.
Covers cryptocurrencies with quotes and analysis.
Holds coins as positions, with cost basis, performance and tax treatment.
Neither property nor custom assets can be held.
Tracks property with rental income, plus collectibles and private equity as custom assets.
Geographic Coverage
Strong on US-listed stocks and ETFs. Broker linking supports US-based brokers only, so non-US accounts are entered by hand.
80+ global exchanges, multi-currency with historical FX at trade date, 9 UI languages, and fourteen country rule sets for capital gains.
Pricing Comparison
Seeking Alpha:
- Basic: free with ads, limited research access
- Premium: $299/year, including full Quant Ratings, premium articles and dividend grades
- Pro: $2,400/year – Wall Street ratings, deeper analyst tools, news alerts
AllInvestView:
- Free: 10 holdings, AI assistant, basic analytics
- Starter: $6.99/month annual = $83.88/year – broker sync, options, real estate
- Advanced: $11.99/month annual = $143.88/year – unlimited holdings, tax reports, 30+ year history (most popular)
- Pro: $24.99/month annual = $299.88/year – unlimited everything
- Lifetime Deal: $497 one-time, permanent access
AllInvestView Advanced ($143.88/year) costs far less than Seeking Alpha Premium ($299/year) and adds tax reports, bond analytics, options Greeks, and broker sync. Seeking Alpha does not offer those capabilities.
Inside AllInvestView
Dividend grades and payment history
Dividend Grades are one of the reasons an income investor pays for Seeking Alpha. It scores the company and publishes research about the safety of its payout.
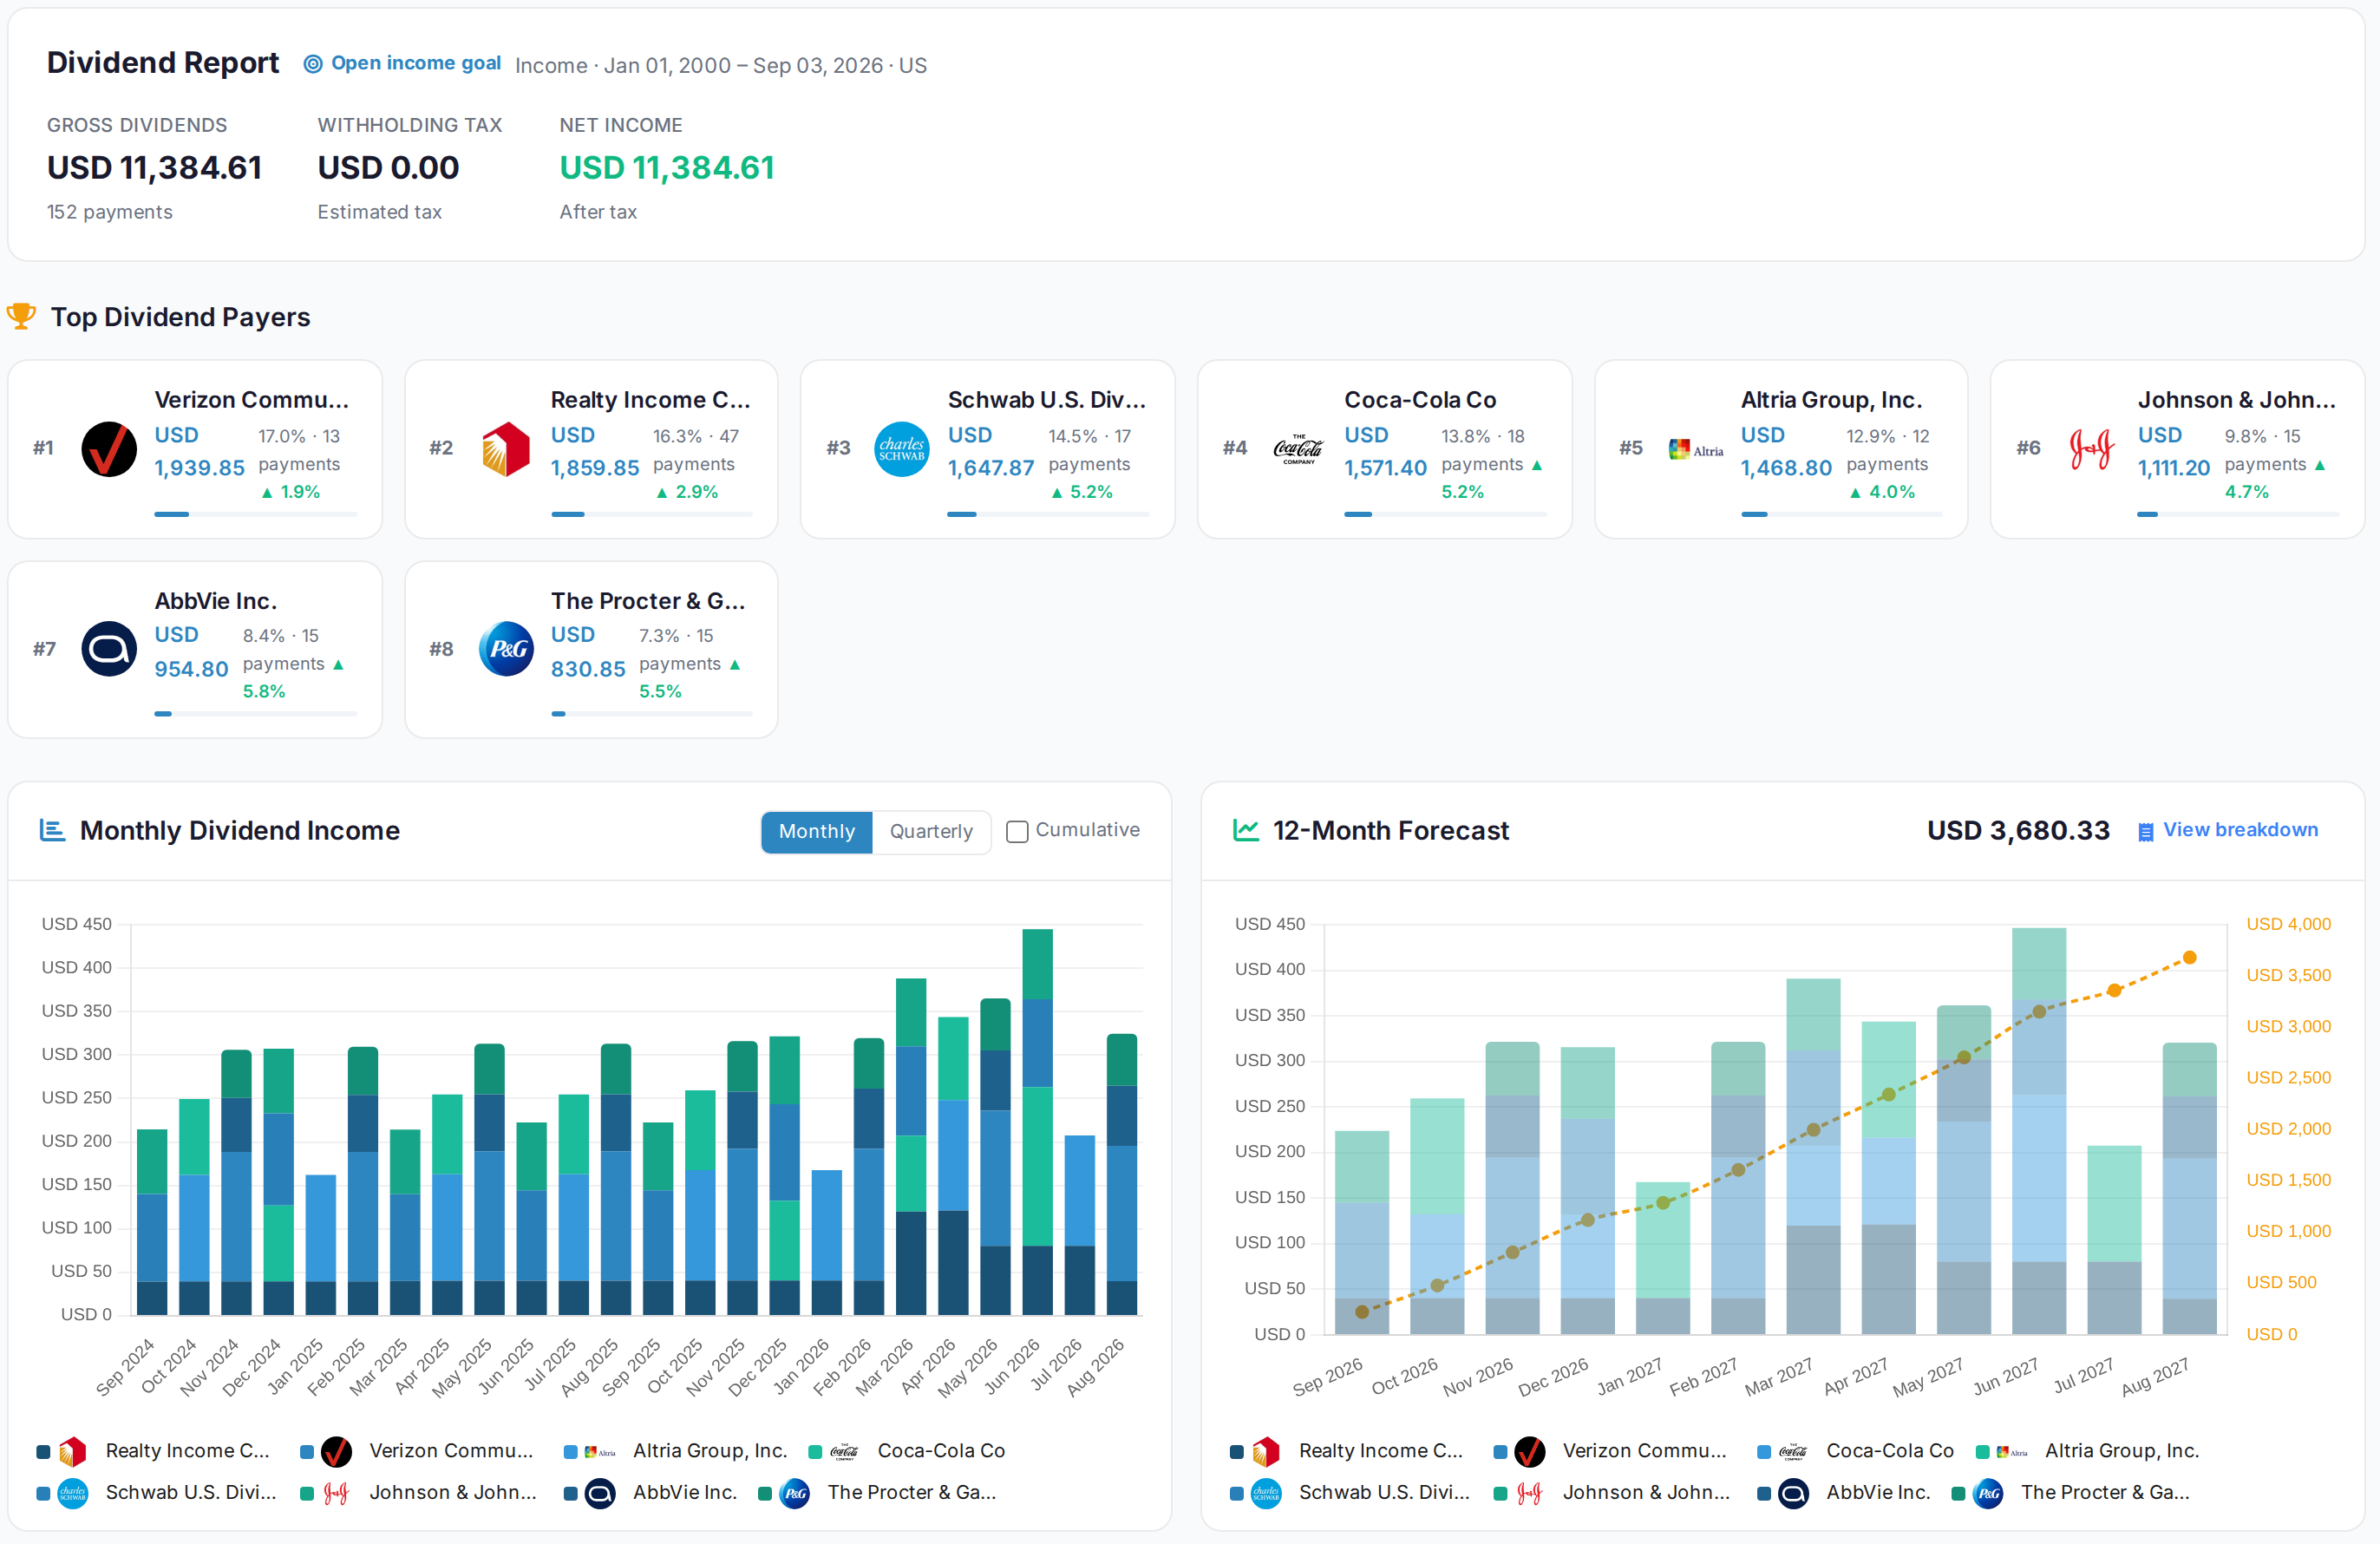
AllInvestView tracks the money itself. One hundred and fifty-two payments are totalled three ways: gross, withholding and net. For investors outside the US who hold US shares, net is the amount that reaches the account. The largest payers each have their own growth rate. Monthly history is split payer by payer, and the forward twelve months come to 3,680.33 USD. The method assigned to each forecast is printed beside it. Seeking Alpha grades the company. AllInvestView shows what your holdings paid and the forecast for the next year.
 AllInvestView
Dividend payment dates
Seeking Alpha puts the earnings dates for your holdings in one calendar. It links each date to articles and transcripts that are published within hours of the call.
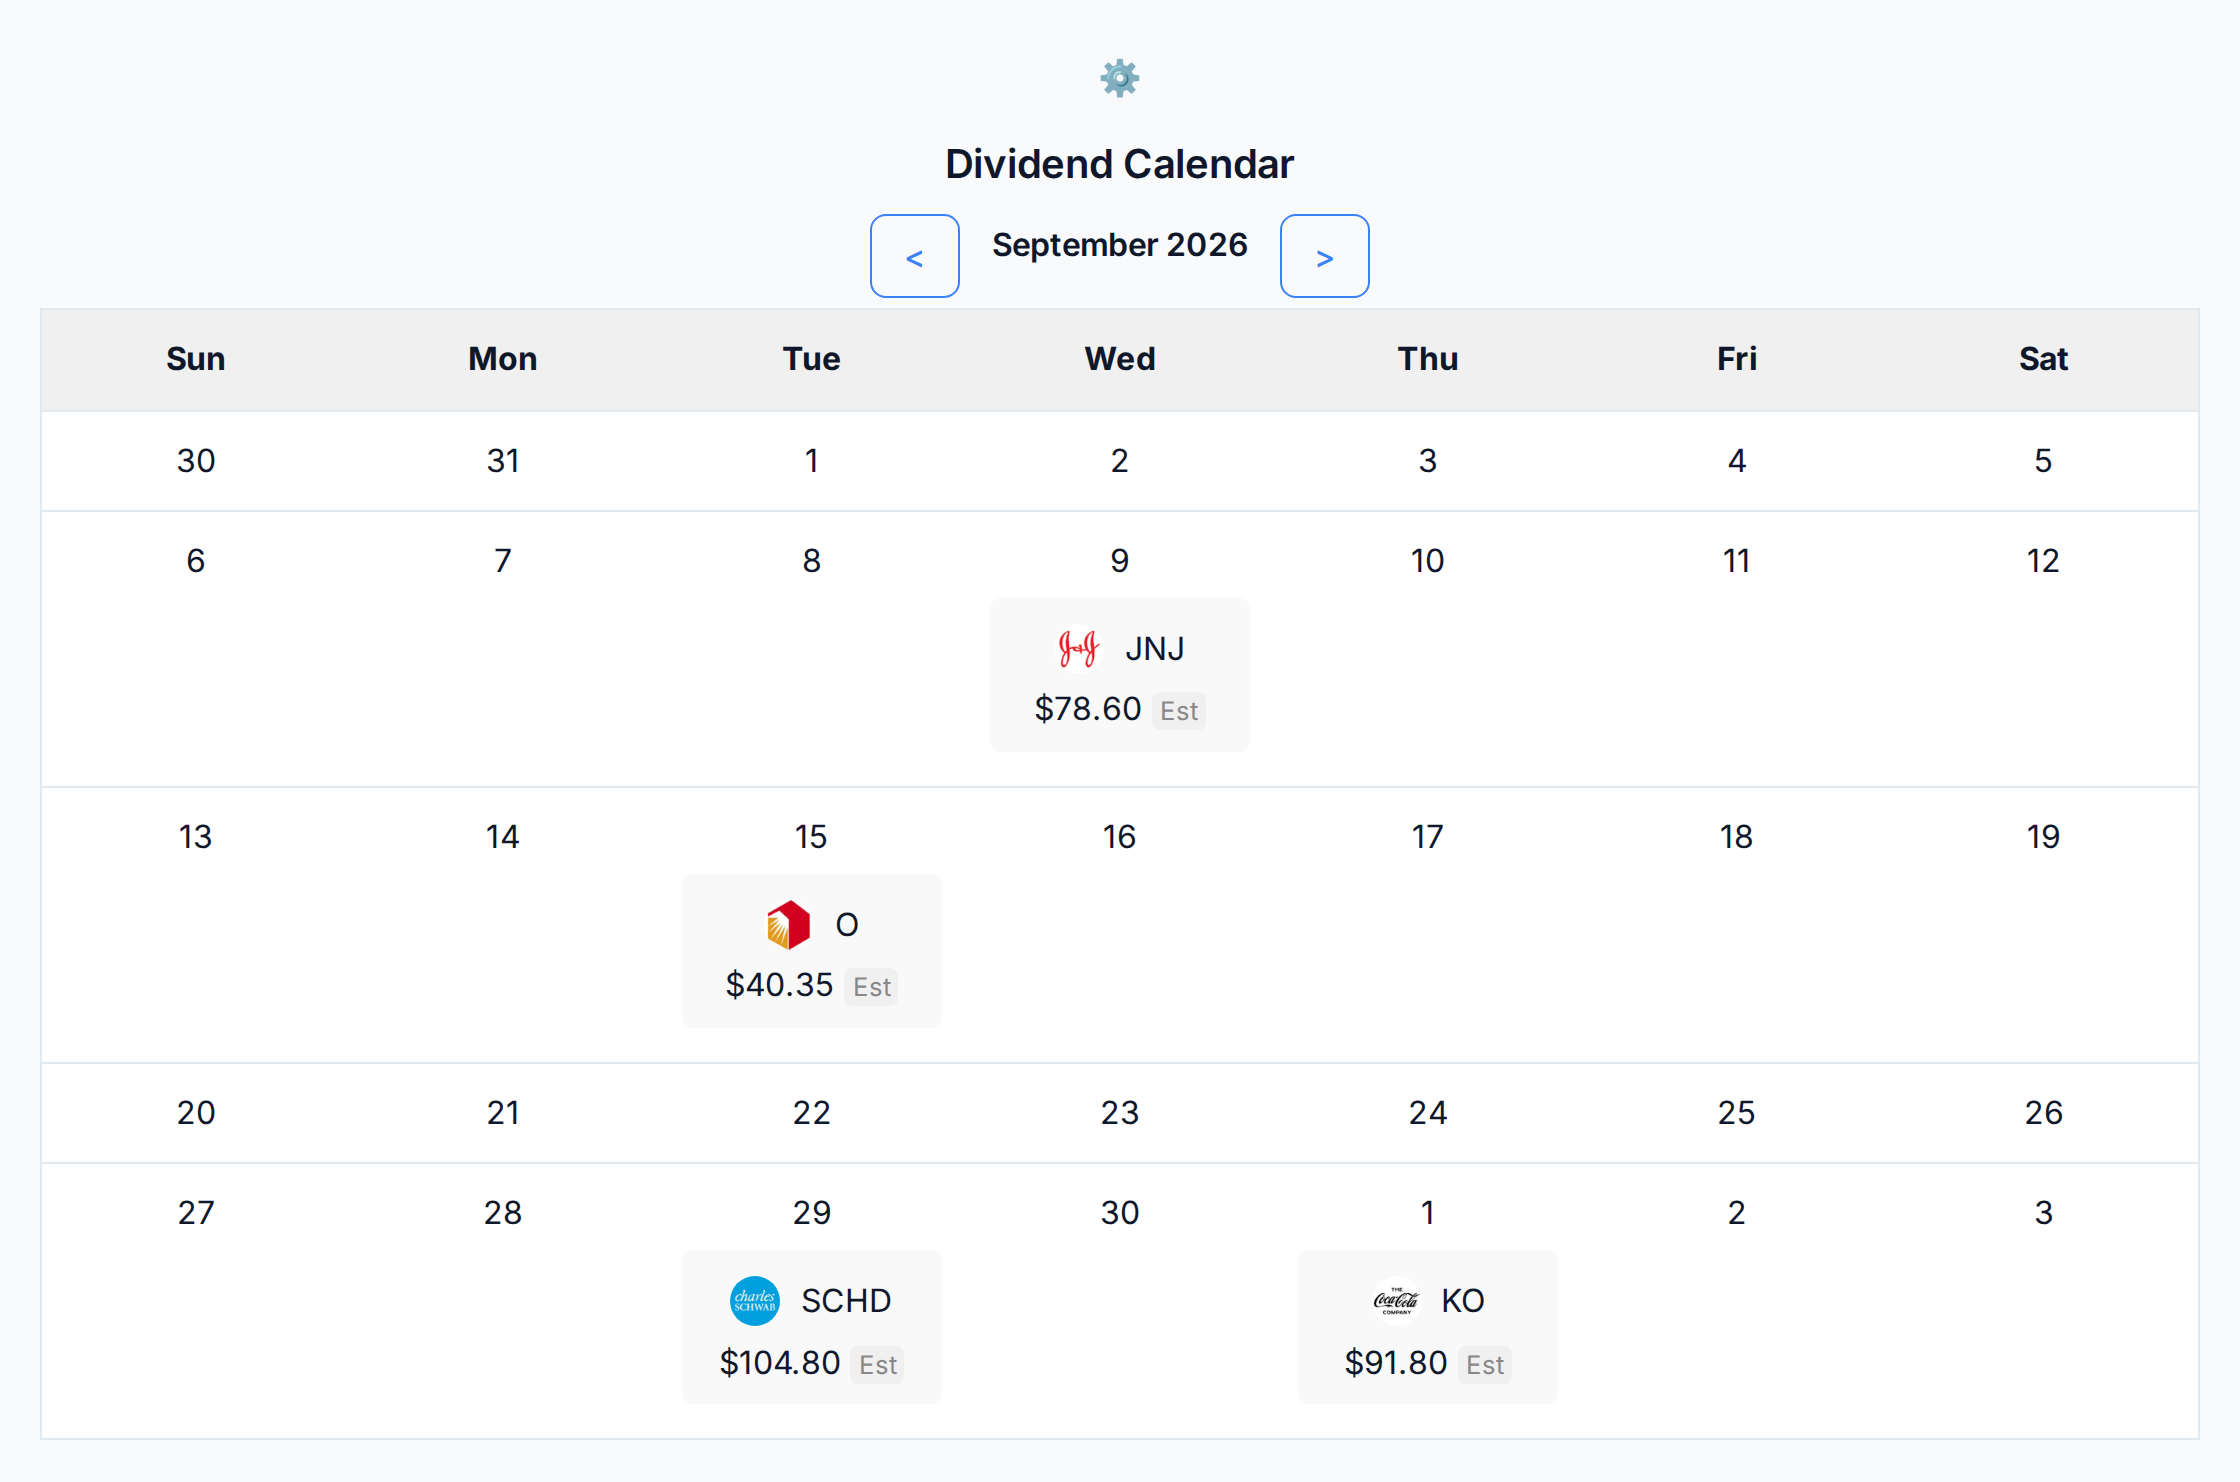
An income portfolio needs dividend dates instead. AllInvestView places each payment on its expected pay date. In September 2026, the calendar shows JNJ at 78.60, O at 40.35, SCHD at 104.80 and KO at 91.80. Each stays marked Est until the company declares it. The monthly and quarterly views show when income is uneven. These amounts use your holdings and their payment history, not a yield multiplied by the account balance.
 AllInvestView
Health scores and fund holdings
The Portfolio Health Score aggregates the Quant rating of the stocks you have listed, and it appears once at least five of them are Quant rated. It gives a quick summary of the stocks names you picked. Each ticker has its own rating.
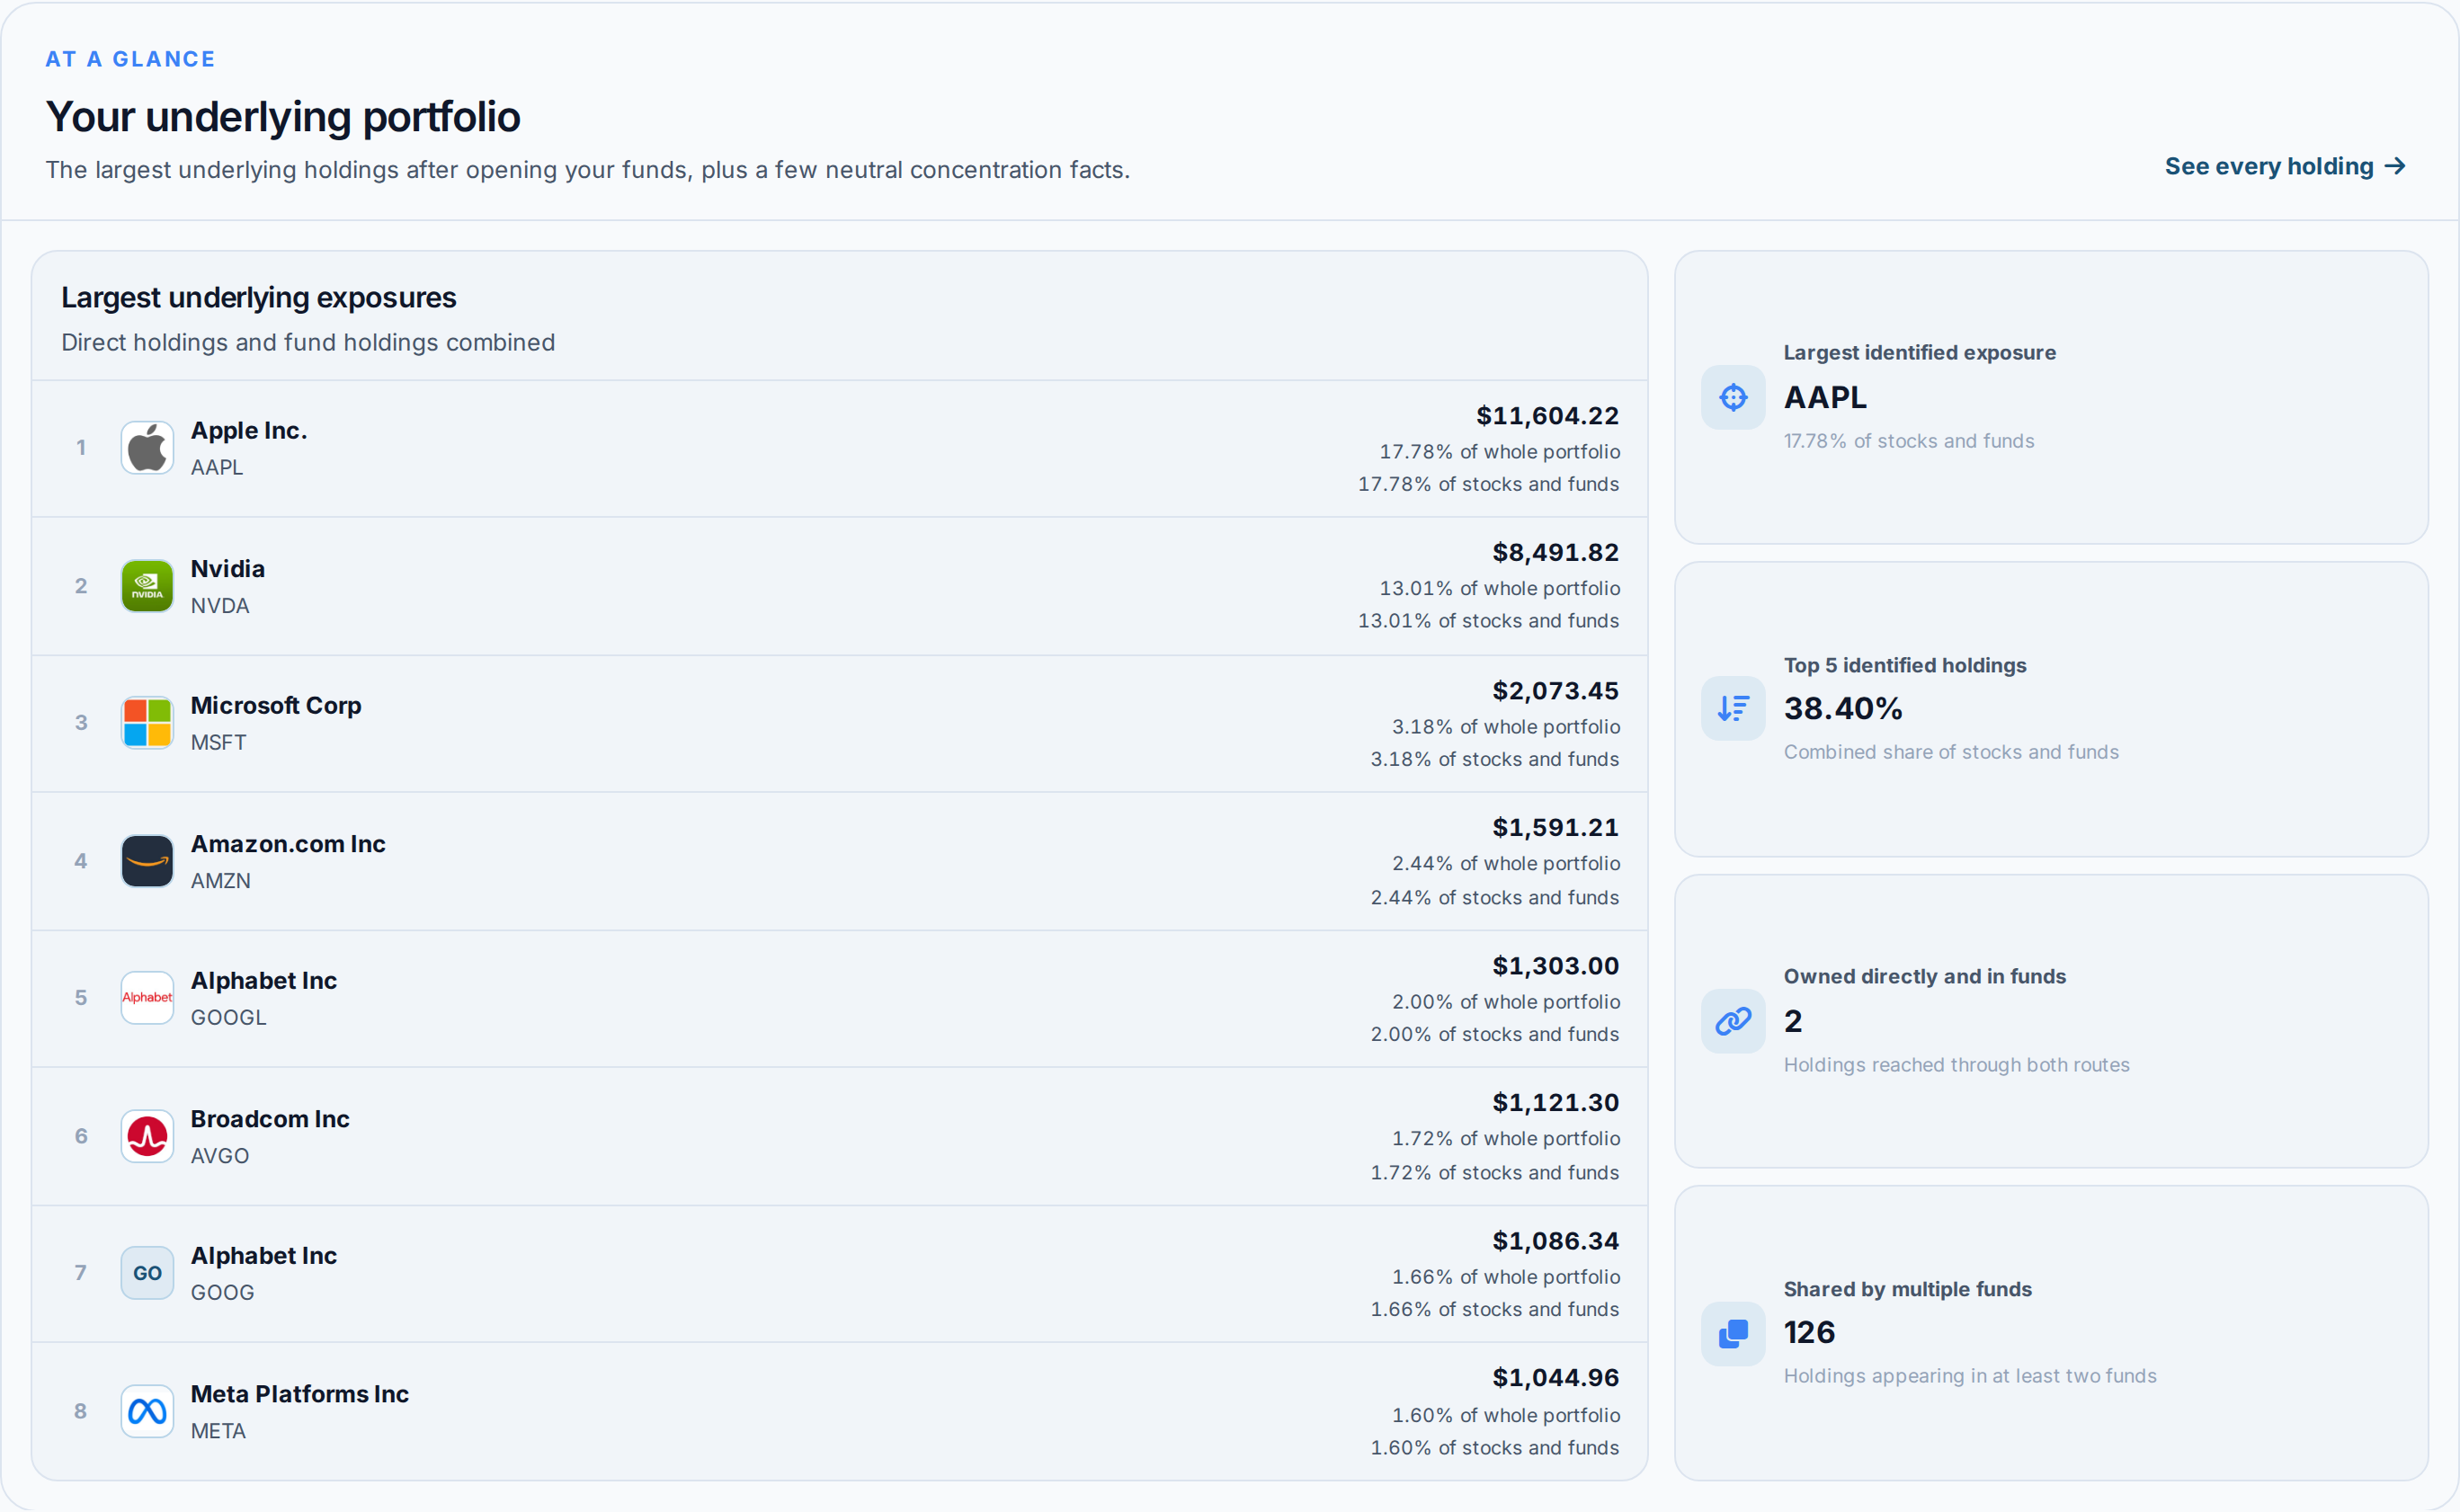
For a fund portfolio, you may also want the companies inside each ETF. Portfolio X-Ray breaks every ETF into its constituents, weighted by your holding, and merged with the shares you bought directly, so the ranked list shows your underlying company exposure. It counts companies held directly and through a fund. It also finds companies inside more than one fund. It also shows the portfolio share held by the five largest underlying companies. This portfolio has 126 companies found in more than one fund.
 AllInvestView
Research answers and tax reports
Ask SA searches the Seeking Alpha library to answer research questions. Virtual Analyst Reports cover more than three thousand US stocks. Both tools are read-only. Seeking Alpha says Ask SA does not manage portfolios or give trading calls, personal financial advice, tax advice or legal advice.
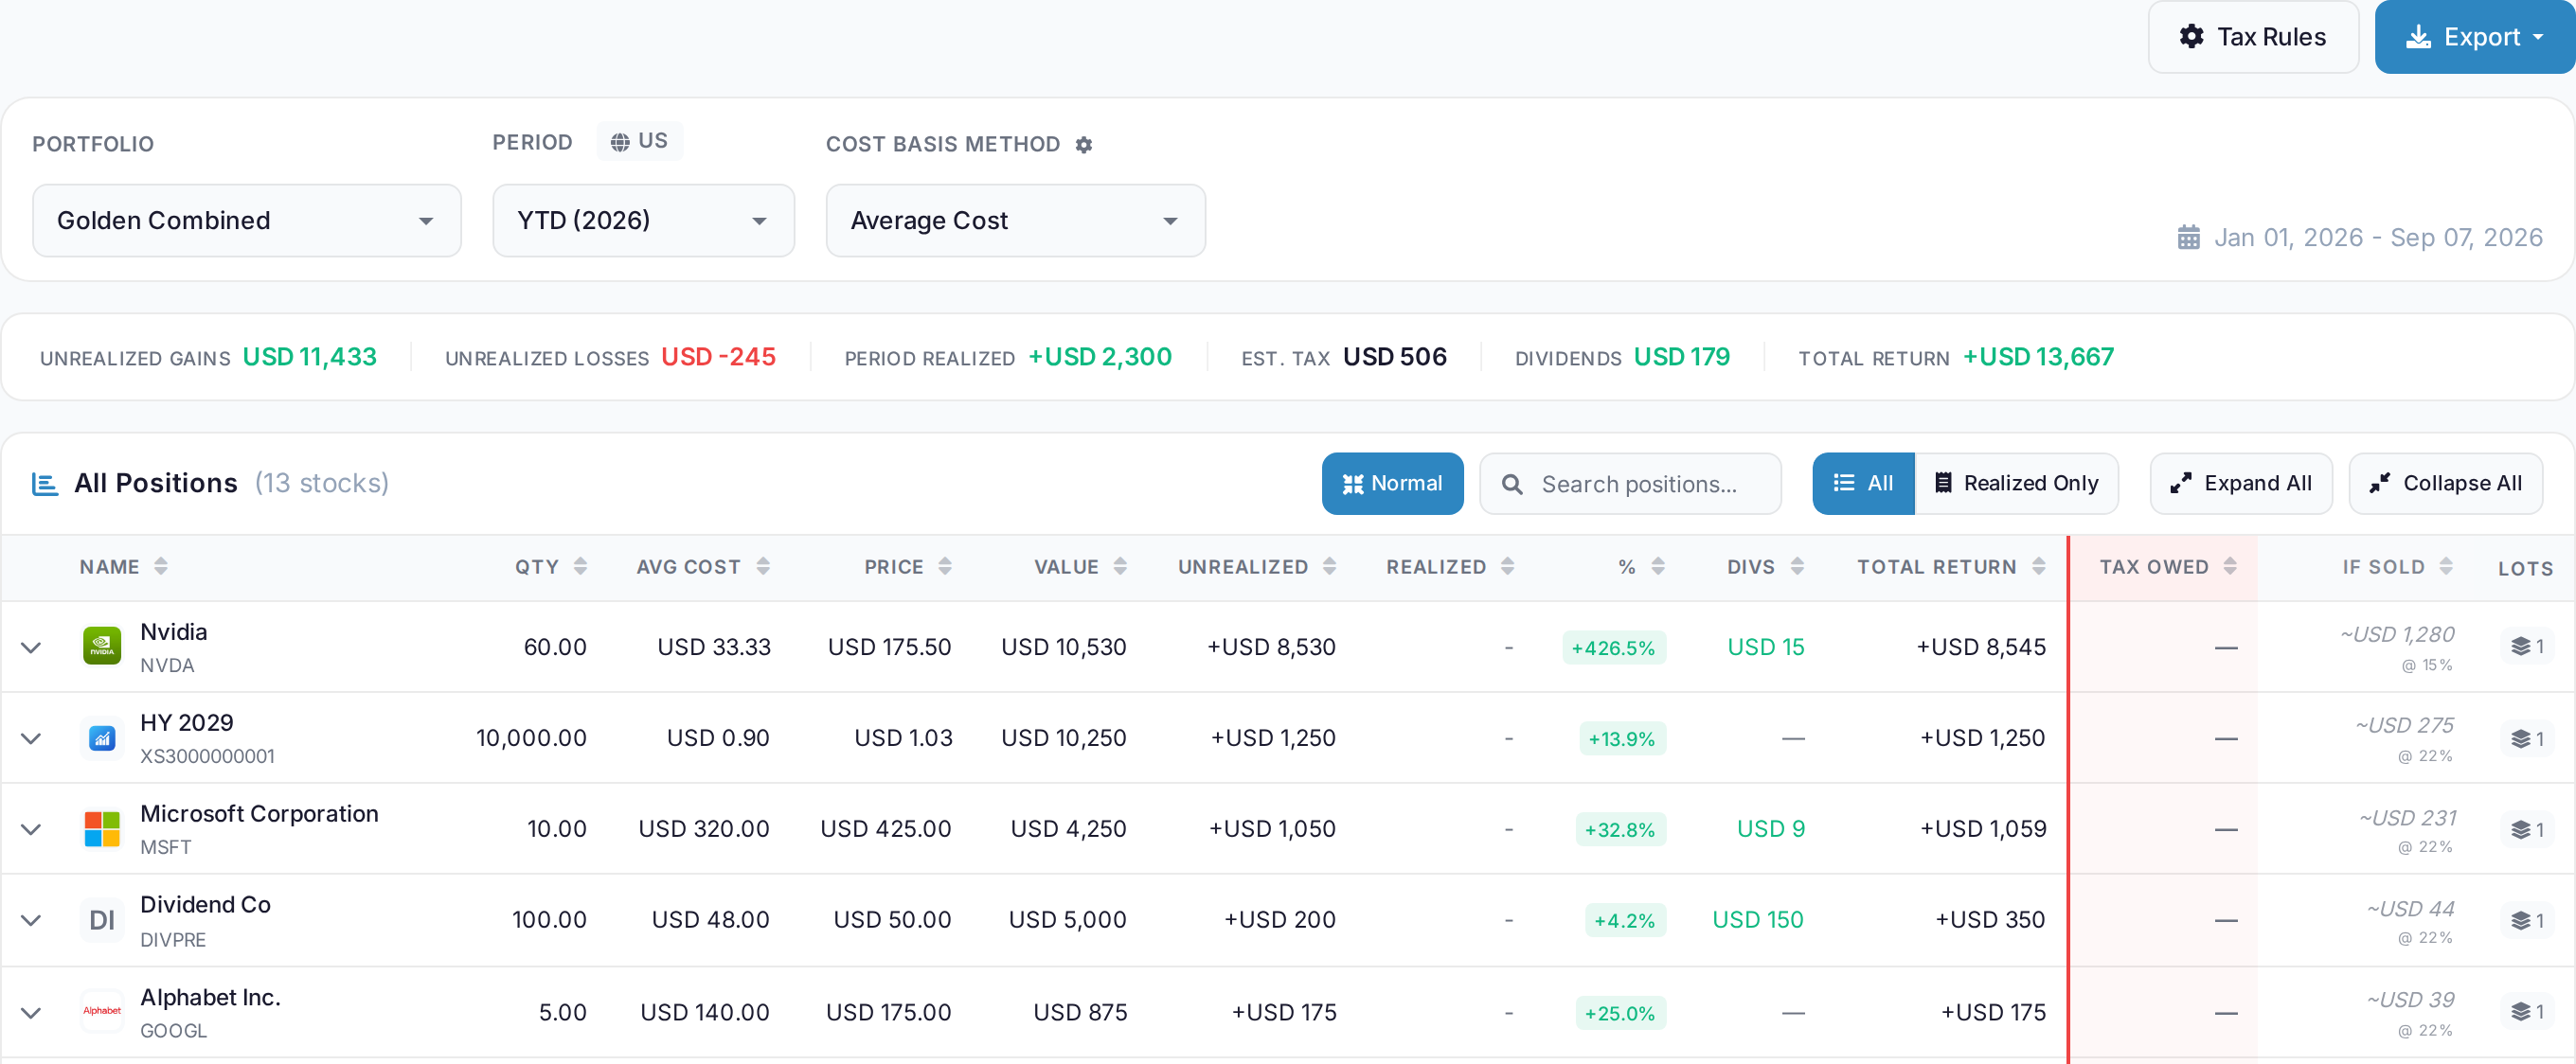
AllInvestView uses your own trades for its capital gains report. It works on your own trades, matched sale by sale under one country and cost basis method. The product has rules for fourteen countries. Average cost, HIFO, LIFO and FIFO each return a different taxable figure from an identical set of sales. The report carries unrealised gains, realised gains, estimated tax, dividends and total return. The open positions show an If sold estimate and a dash in Tax Owed. The report leaves as PDF, Excel or CSV for whoever files it.
 AllInvestView
Returns between two dates
A Seeking Alpha portfolio is wired for the present tense. It shows what you hold now, what it is worth now, the ratings on it now, and it pushes price, news and rating alerts as they happen. Broker linking feeds it daily, on Premium and PRO, for US brokers.
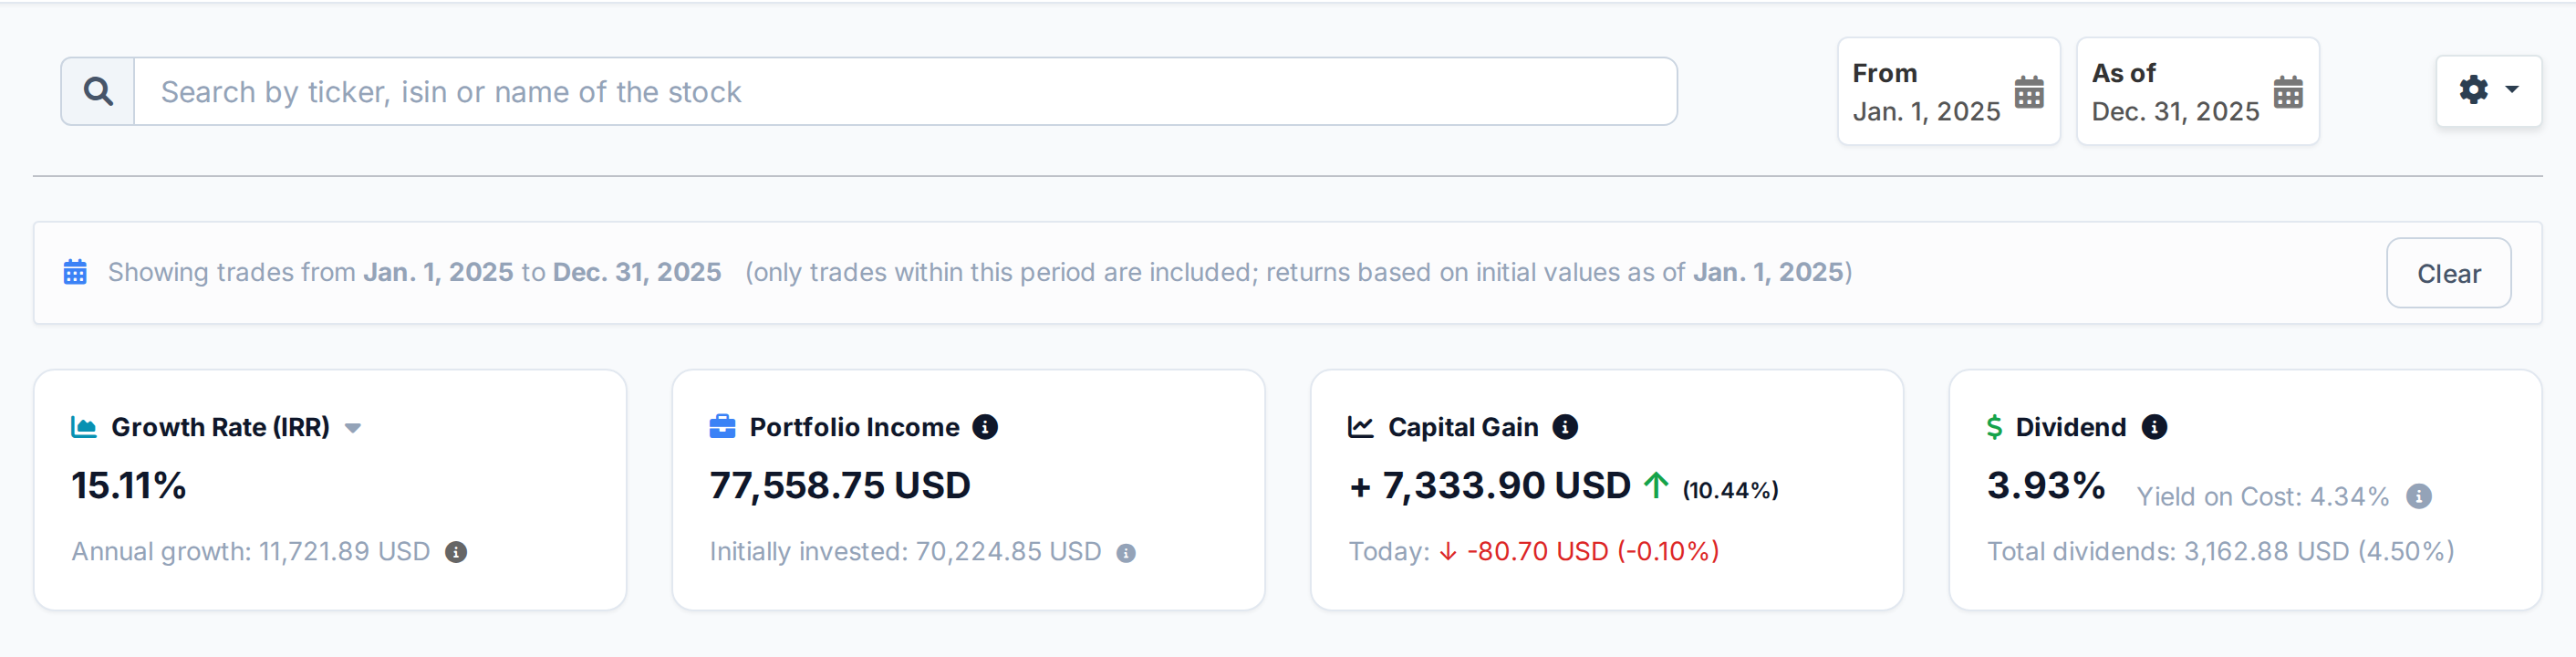
A custom period recalculates every dashboard figure for those dates. A banner confirms the selected dates. From 1 January to 31 December 2025, the IRR is 15.11 percent. The capital gain is 7,333.90 dollars and dividend yield is 3.93 percent. Positions bought after the end date are excluded, positions sold inside the window still count toward the result.
 AllInvestView
Public portfolio discussions
Seeking Alpha has thousands of contributors and active comment threads under its articles. Readers can follow writers they trust and discuss each stock.
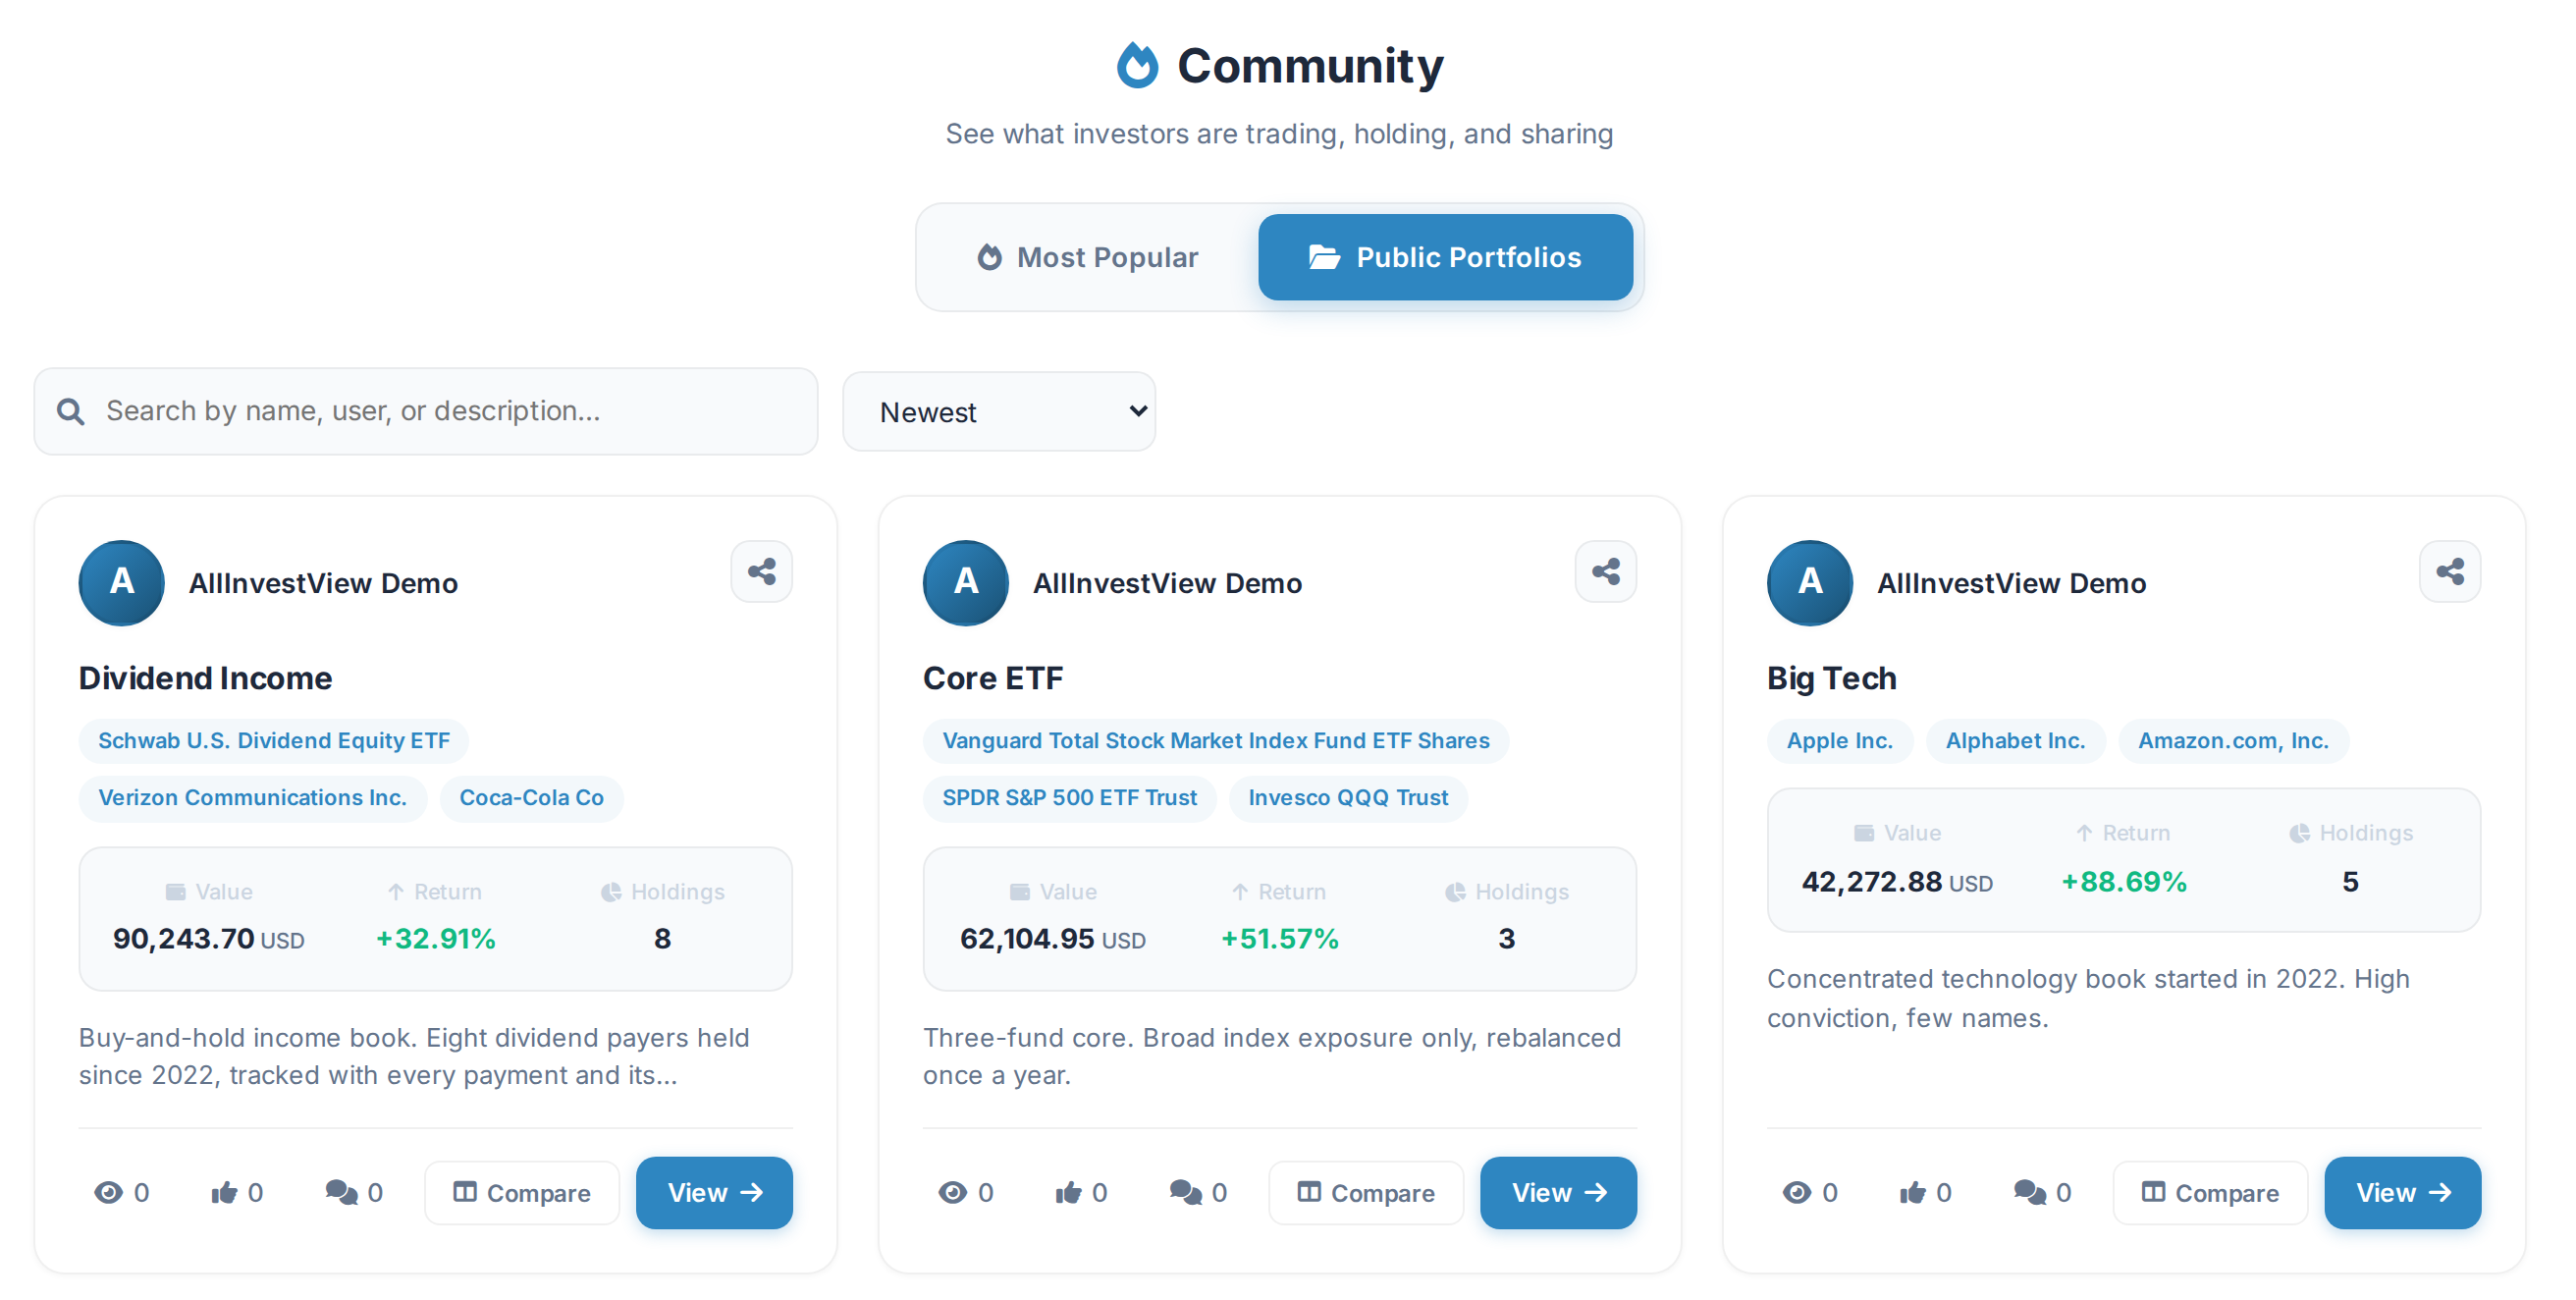
AllInvestView discussions are attached to public portfolios. Each one shows its holdings as chips, value, return, holding count and the owner's description. People can search, vote, comment and compare a public portfolio with their own account. Publishing is optional. Private portfolios stay private. AllInvestView also shows the companies inside funds, measures chosen periods and restores past portfolio values. Bonds, options and the tax report are included too. Seeking Alpha keeps the larger research library and contributor commentary.
 AllInvestView
Feature Grid
| Capability | Seeking Alpha | AllInvestView |
|---|---|---|
| Crowdsourced research articles | ||
| Proprietary Quant Ratings (US stocks) | ||
| Earnings call transcripts | ||
| Stock and ETF tracking | ||
| International stocks (LSE, XETRA, ASX) | ||
| Bond yield (YTM, duration) | ||
| Options with Greeks | ||
| Crypto tracking | ||
| Real estate / custom assets | ||
| Multi-broker auto-sync (30+, brokers outside the US included) | ||
| Multi-currency with historical FX | ||
| Capital gains reports under 14 sets of country rules | ||
| AI portfolio assistant | ||
| Free tier (no ads on paid plans) | ||
| Lifetime payment option |
You can use both. Research a company in Seeking Alpha, then track the position, dividends and taxes in AllInvestView. Advanced costs $143.88/year, so it plus Seeking Alpha Free costs less than Seeking Alpha Premium.
Keep Research and Portfolio Records Separate
Use Seeking Alpha for stock research, then track the actual portfolio in AllInvestView. Free tier covers 10 holdings; full broker sync starts at $6.99/month.
Which tool to choose
If you use Seeking Alpha to follow stocks and keep a portfolio list, AllInvestView covers that tracking job across stocks and ETFs while Seeking Alpha remains the stronger research library.
Choose AllInvestView when the record behind the portfolio matters: complete trade history, broker reconciliation, historical exchange rates, dividend records and capital gains reports. It also tracks bonds, options, crypto, property and custom assets in the same account.
Keep Seeking Alpha when Quant Ratings, earnings transcripts and contributor research drive your decisions. Using it for research and AllInvestView for the actual ledger gives each product the job it handles best.
Questions Answered
Is Seeking Alpha a portfolio tracker?
Seeking Alpha is primarily a research platform with secondary portfolio tracking. AllInvestView adds complete transaction history, multi-asset records, tax reports and broker sync.
Is Seeking Alpha worth $299/year?
Premium costs $299 a year and includes Quant Ratings, premium articles and dividend grades. Pro costs $2,400 a year. AllInvestView Advanced costs $143.88 a year and adds tax reports, bond records, options Greeks and broker sync.
What's the best Seeking Alpha alternative for portfolio tracking?
AllInvestView covers the stock and ETF tracking in Seeking Alpha, then adds reconciled transaction history, other asset classes and tax reports. Seeking Alpha keeps its stronger stock research.
Does Seeking Alpha work for non-US investors?
Seeking Alpha focuses on US-listed stocks and ETFs. AllInvestView supports more than 80 global exchanges, multi-currency tracking and capital gains rules for fourteen countries.
Can Seeking Alpha handle bonds, options, or crypto?
Seeking Alpha covers stocks, ETFs, mutual funds, commodities and cryptocurrencies, with options data on a stock. AllInvestView holds bonds priced from the government yield curve, option contracts with Greeks and crypto as portfolio positions.
How is Seeking Alpha's Quant Rating system?
Quant Ratings score US stocks across value, growth, profitability, momentum and earnings revisions. AllInvestView shows fundamentals on holdings but does not replicate Quant Ratings.
Can I use both Seeking Alpha and AllInvestView?
Yes. Use Seeking Alpha for stock research, Quant Ratings and earnings transcripts, then use AllInvestView for the portfolio ledger, tax reports and dividend calendar.
How do I migrate from Seeking Alpha portfolio to AllInvestView?
Download the Seeking Alpha portfolio as an Excel file. That file can become portfolio history in AllInvestView, while supported brokers can remain current through a direct connection.