Unlock Deeper Insights from Your interactive investor Portfolio
interactive investor (ii) is one of the UK's largest flat-fee investment platforms, offering a simple monthly subscription model rather than percentage-based fees. This makes it especially cost-effective for larger portfolios. ii provides ISAs, SIPPs, trading accounts, and Junior ISAs with access to UK and international shares, funds, ETFs, investment trusts, and bonds. Known for its expert editorial content, model portfolios, and award-winning service.
What interactive investor Users Get with AllInvestView
Portfolio analytics are basic — limited to valuation and simple gain/loss
AllInvestView provides detailed performance analytics including IRR, benchmark comparison, and sector allocation that ii does not offer.
Difficult to see consolidated performance across ISA, SIPP, and trading accounts
AllInvestView combines all your ii accounts into one dashboard with both combined and individual account views.
Limited dividend income tracking and projection capabilities
AllInvestView offers dividend calendar views, income forecasting, yield-on-cost metrics, and ex-date alerts for all your positions.
What You Unlock with AllInvestView
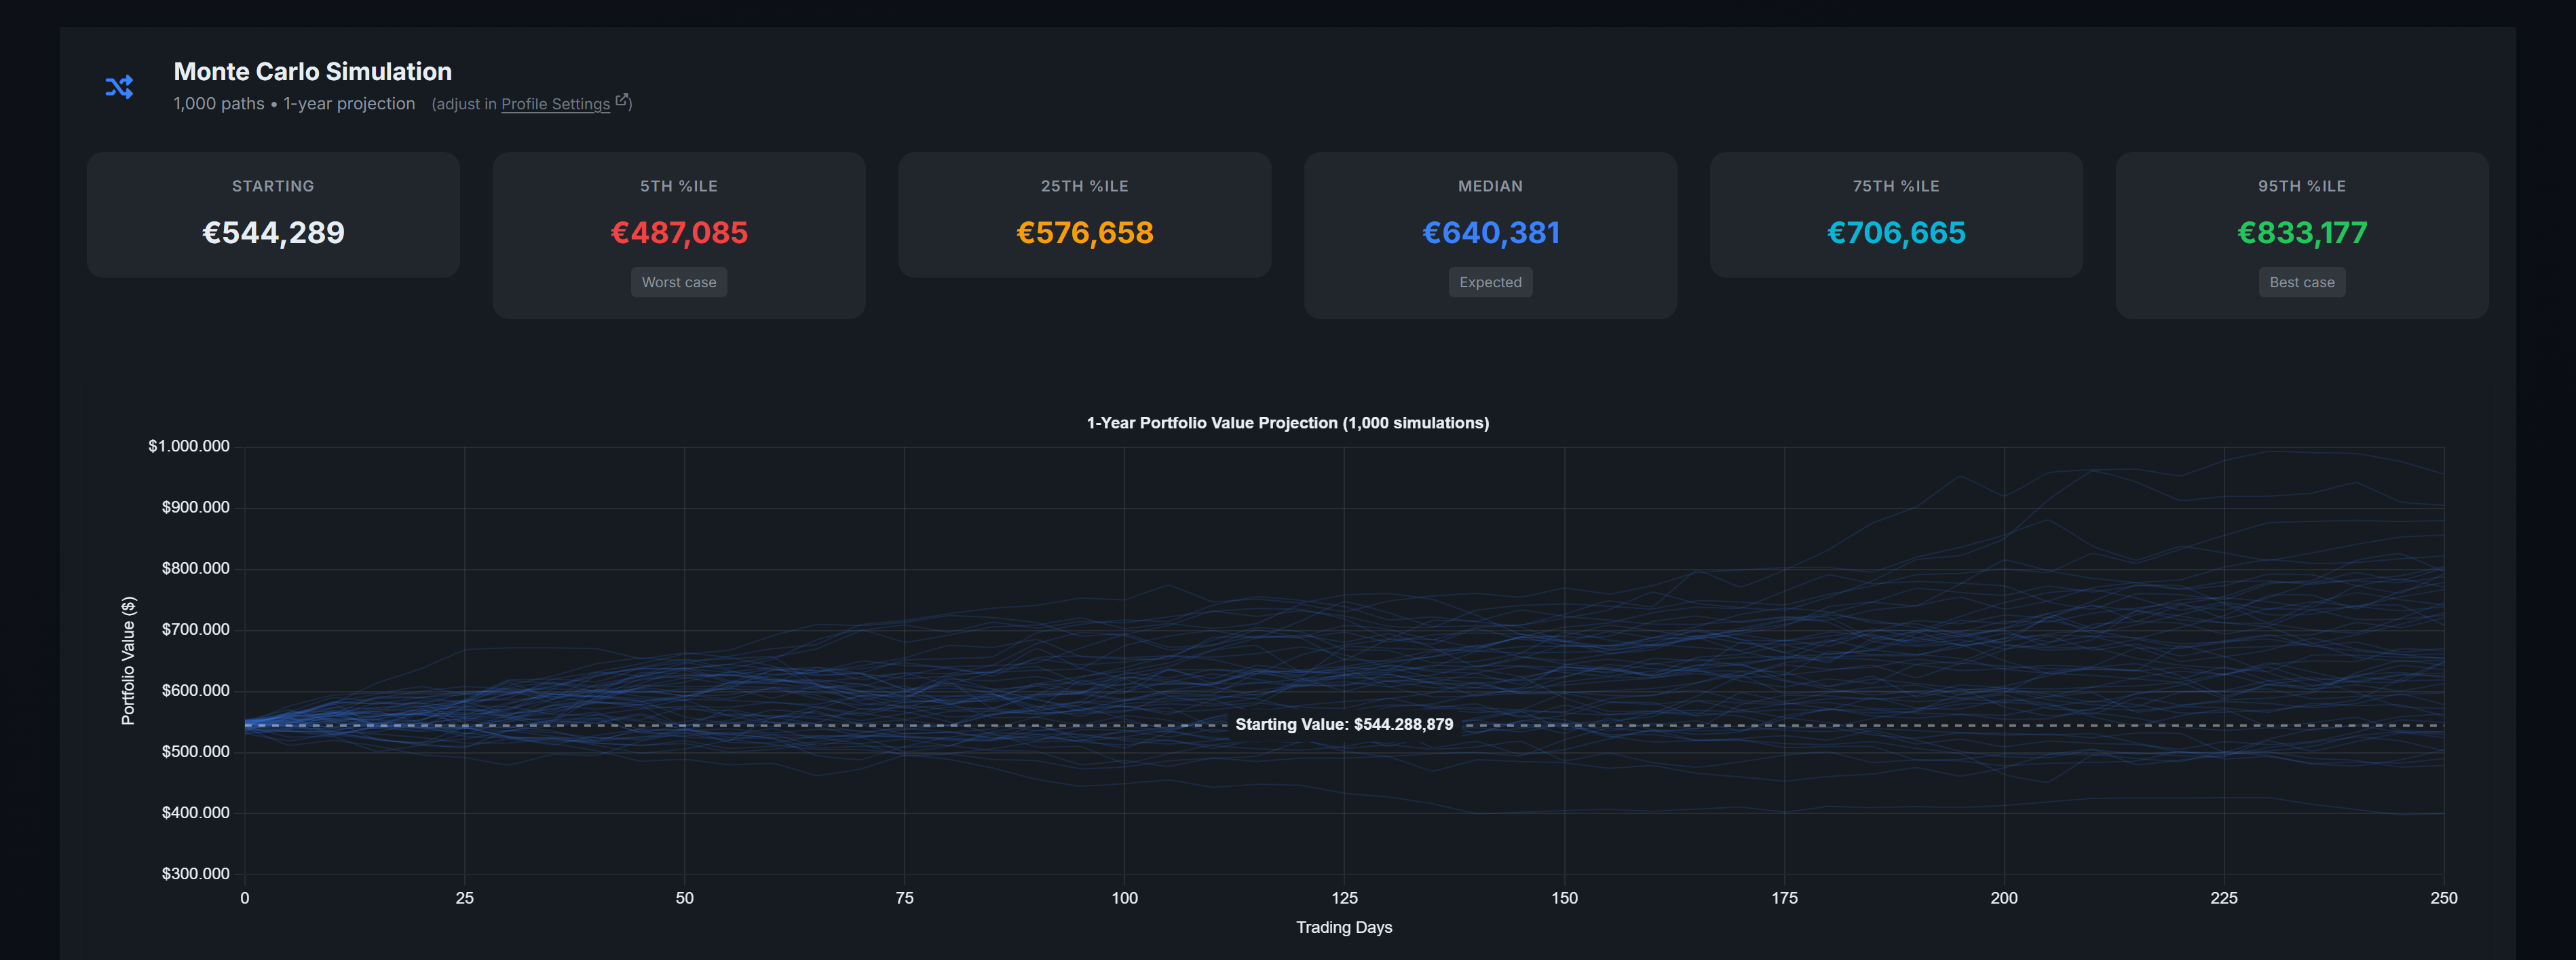
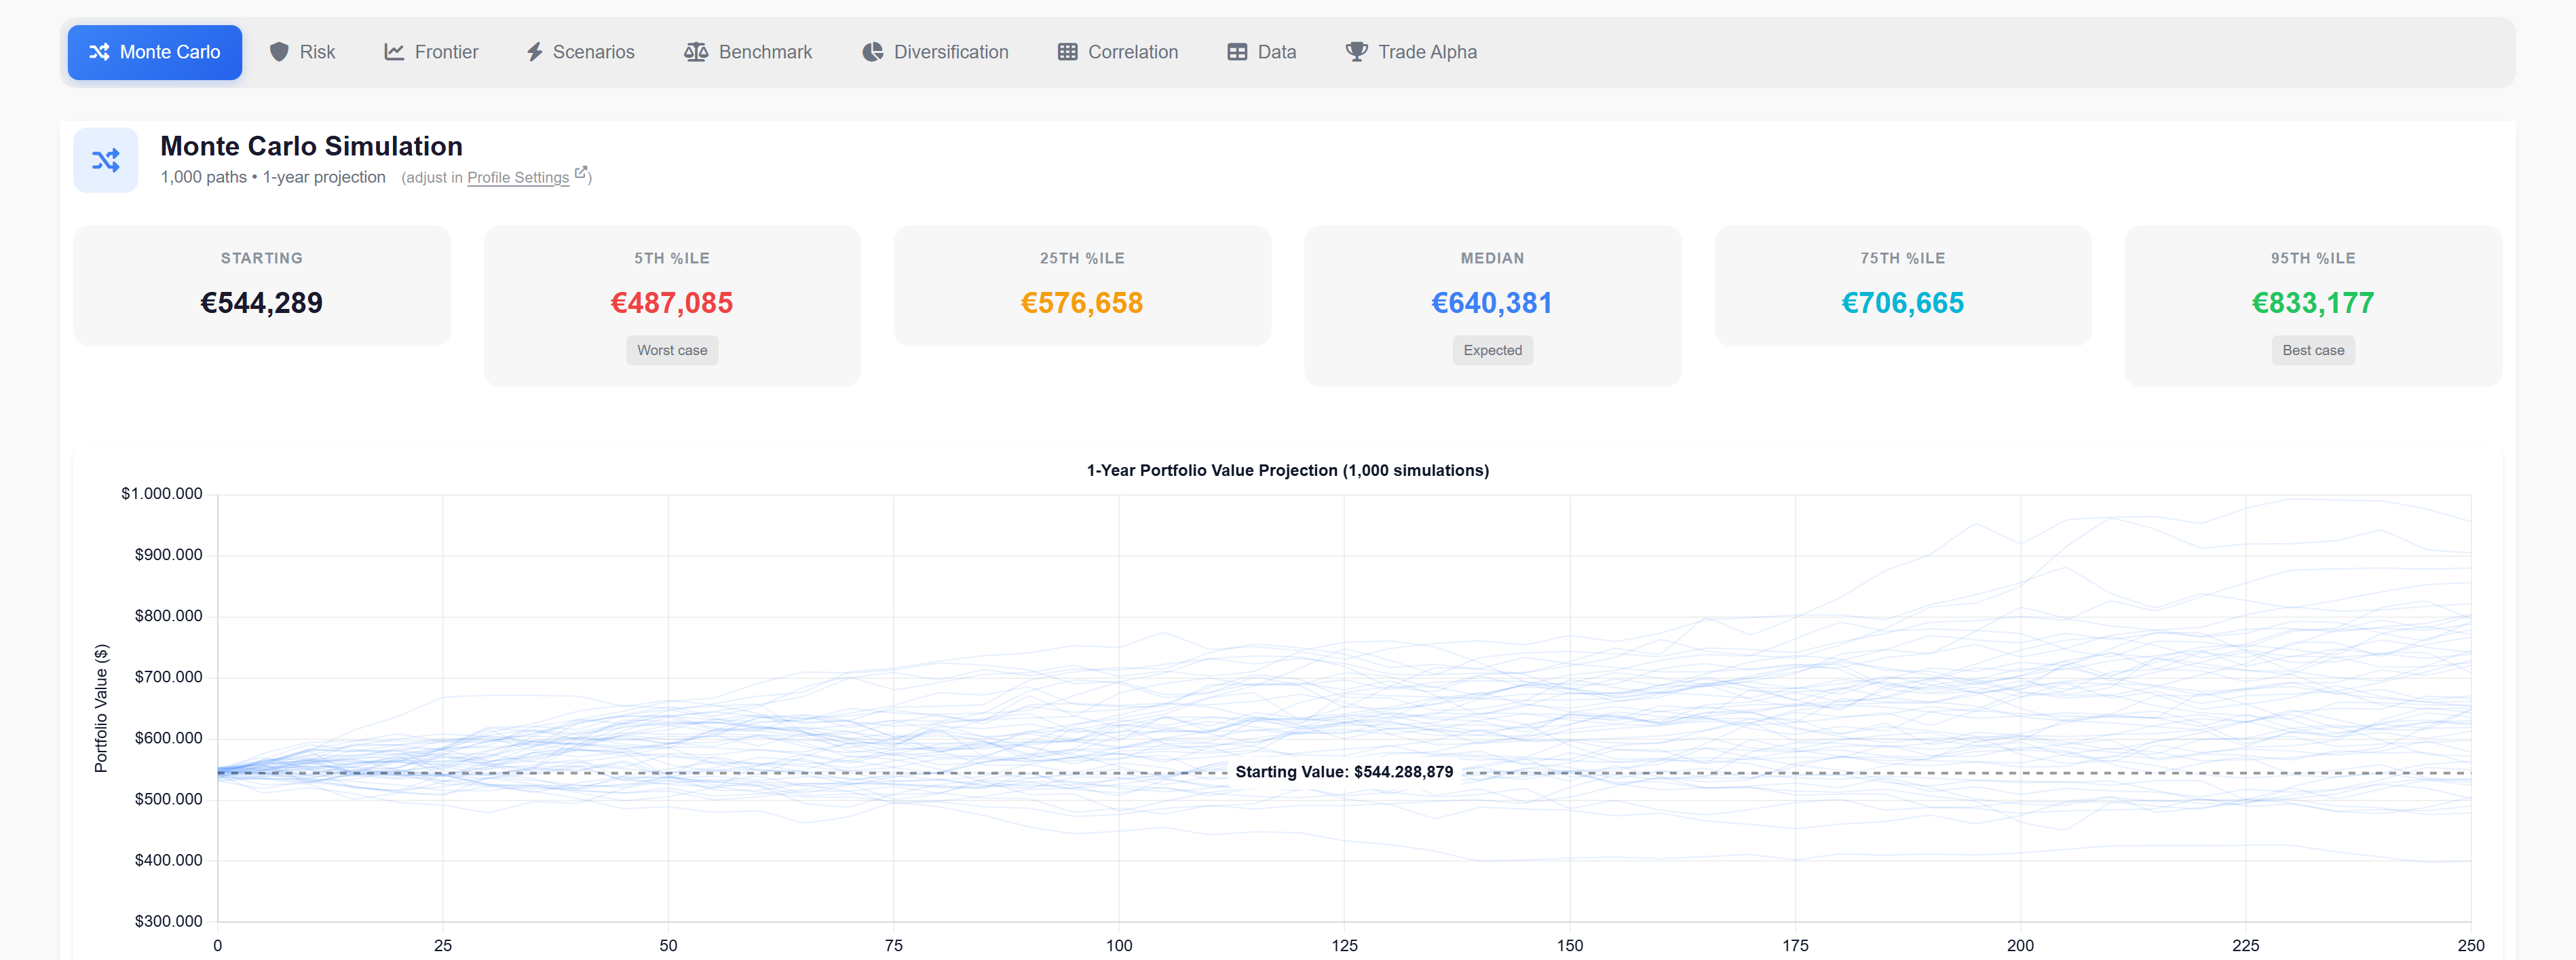
Monte Carlo Simulation
Simulate 1,000+ future scenarios. See the probability of hitting your financial goals.
Efficient Frontier
Find your optimal portfolio allocation using Markowitz mean-variance optimization.
Correlation Matrix
Visualize how your holdings move together. Identify diversification gaps at a glance.
Tax Reports
Capital gains reports for 14+ countries. FIFO, LIFO, specific ID, and average cost methods.
Dividend Calendar
Track every payment, project future income, and monitor yield-on-cost over time.
Options Greeks
Track Delta, Gamma, Theta, Vega, and Rho with visual payoff diagrams.
AI Assistant
Ask anything about your portfolio. Get instant analysis powered by AI.
Quick Allocation View
See asset, sector, country, and currency breakdown in one visual dashboard.
interactive investor vs AllInvestView — Feature Comparison
See what interactive investor's built-in tools offer versus what AllInvestView adds to your investment workflow.
| Feature | interactive investor Built-in | + AllInvestView |
|---|---|---|
| Performance Analytics | Basic portfolio valuation and gain/loss | True IRR/XIRR, time-weighted & money-weighted returns, benchmark comparison |
| Tax Reporting | Basic CGT summary | Full capital gains report with FIFO/LIFO/specific ID, wash sale detection, 14+ country support |
| Dividend Tracking | Basic income history in account statements | Calendar view, income projections, yield-on-cost, ex-date alerts |
| Multi-Account Consolidation | ISA, SIPP, and trading accounts shown separately | Combined or individual views across all accounts and brokers |
| Multi-Broker View | Not available — ii accounts only | Consolidate all brokers in one unified dashboard |
| Risk Analytics | Not available | Monte Carlo simulation, Efficient Frontier, VaR, Sharpe/Sortino Ratios |
| Model Portfolio Comparison | Quick-Start Funds and curated model portfolios | Benchmark your actual performance against any index or model portfolio |
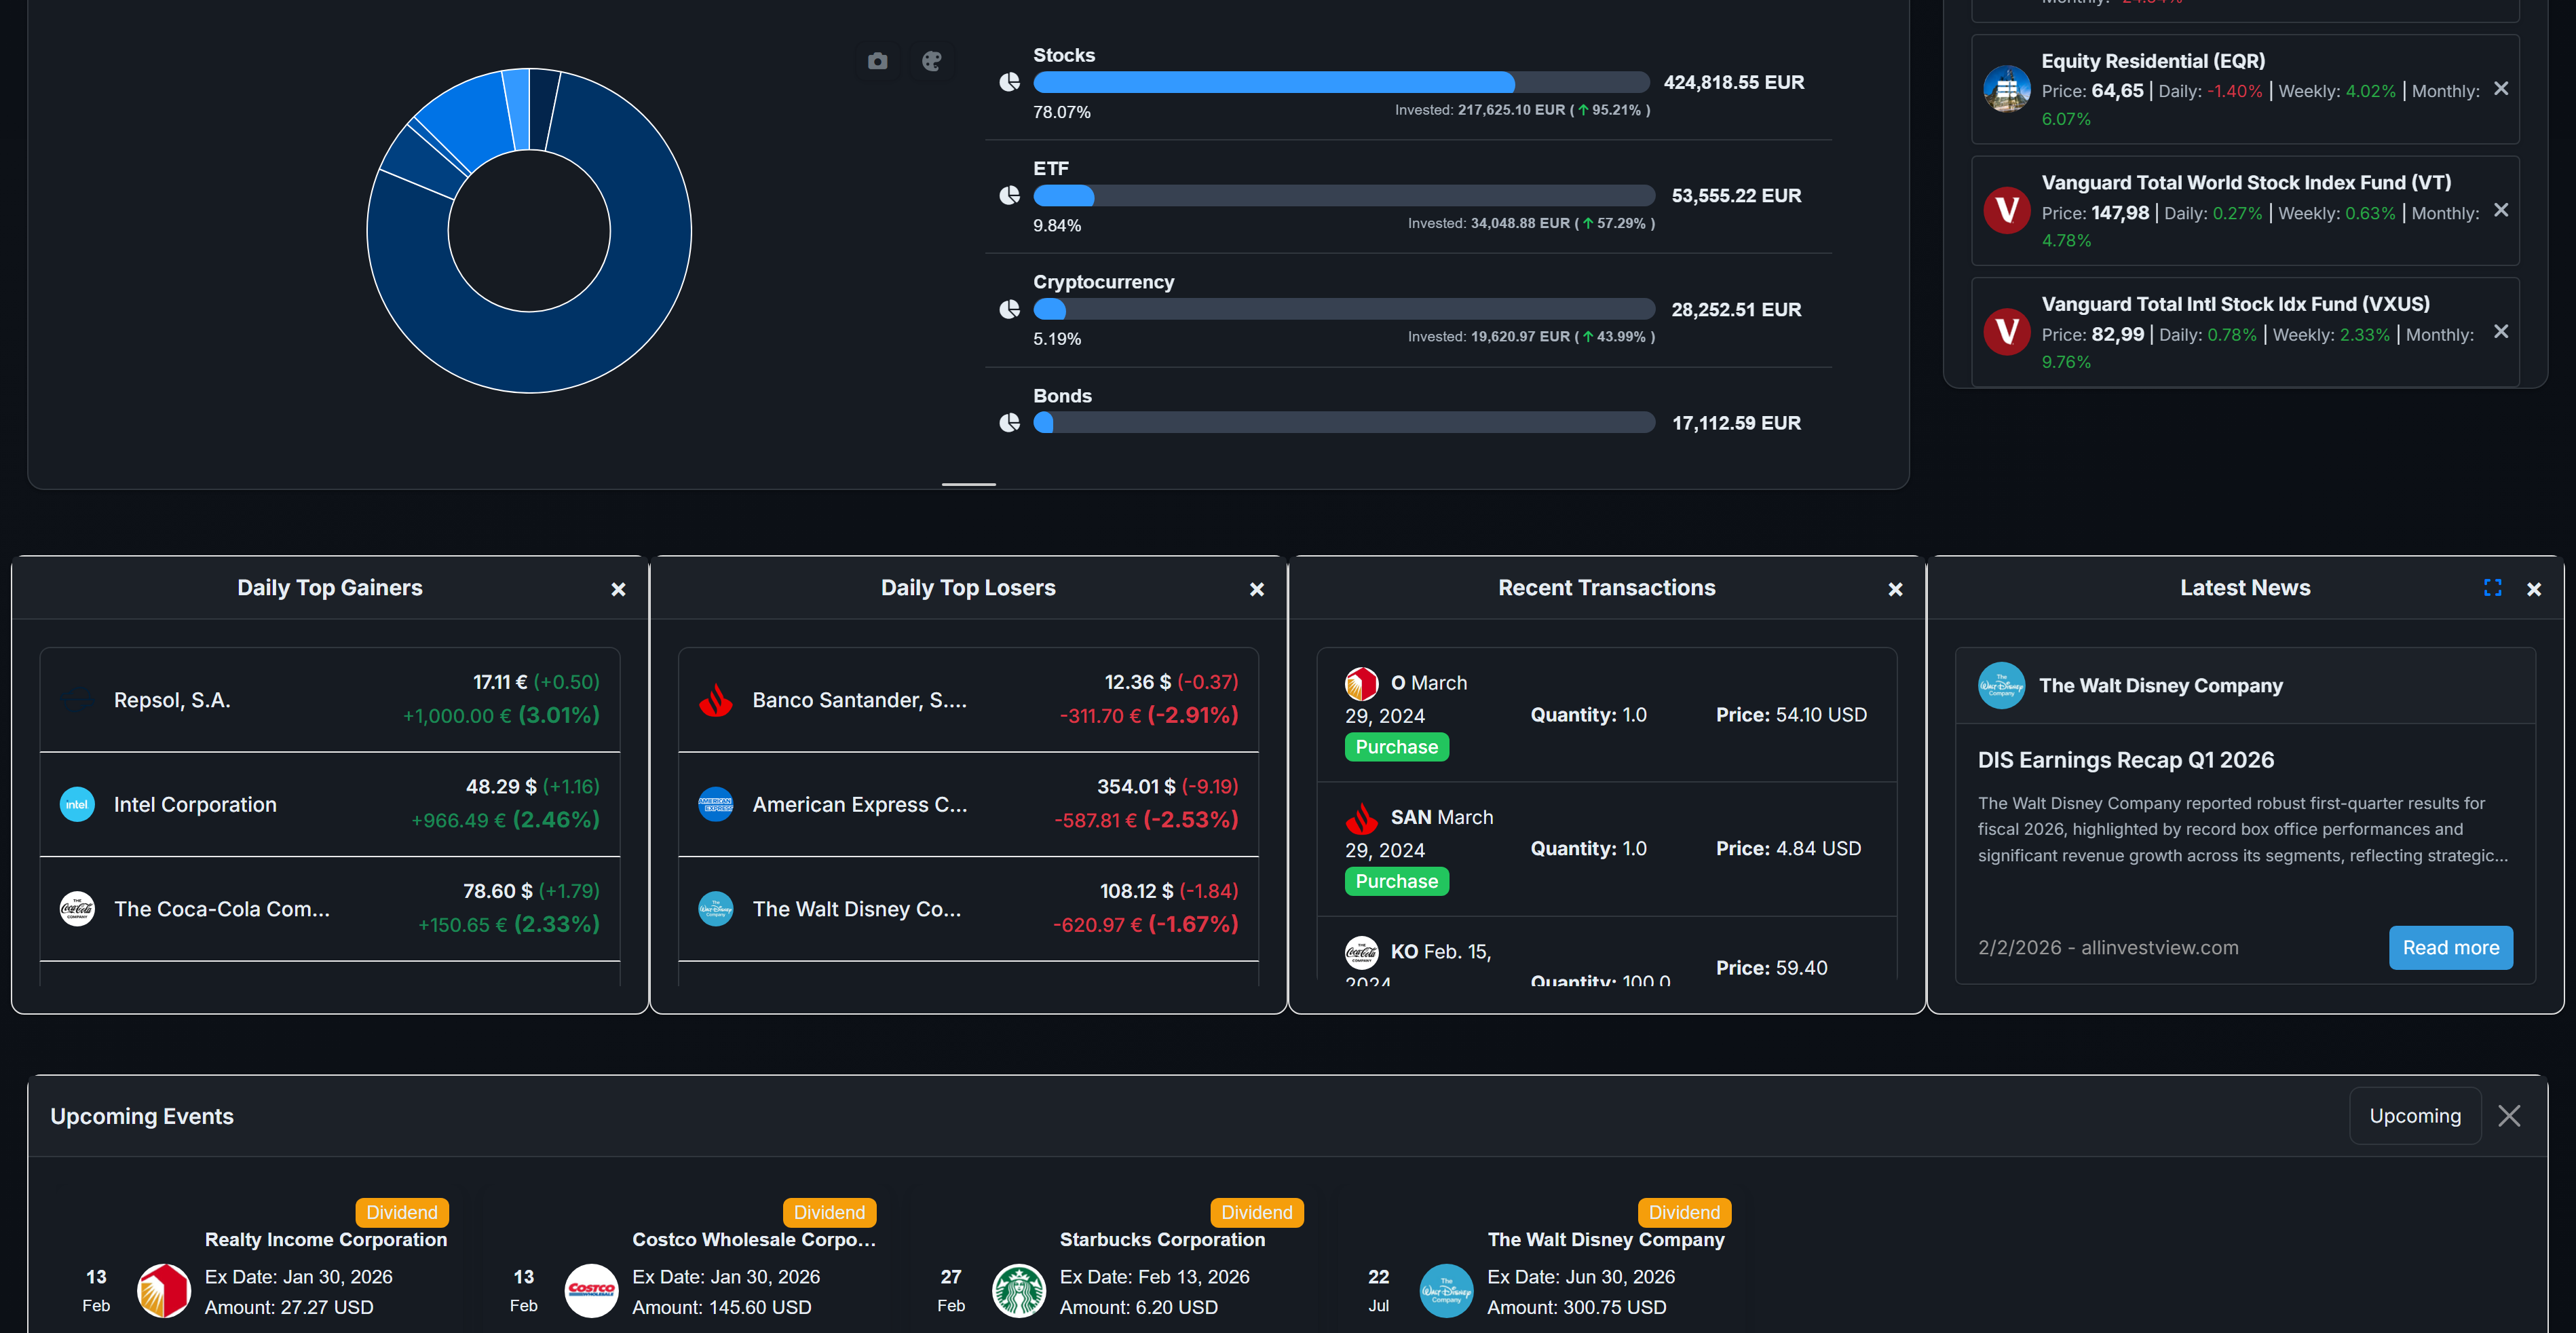
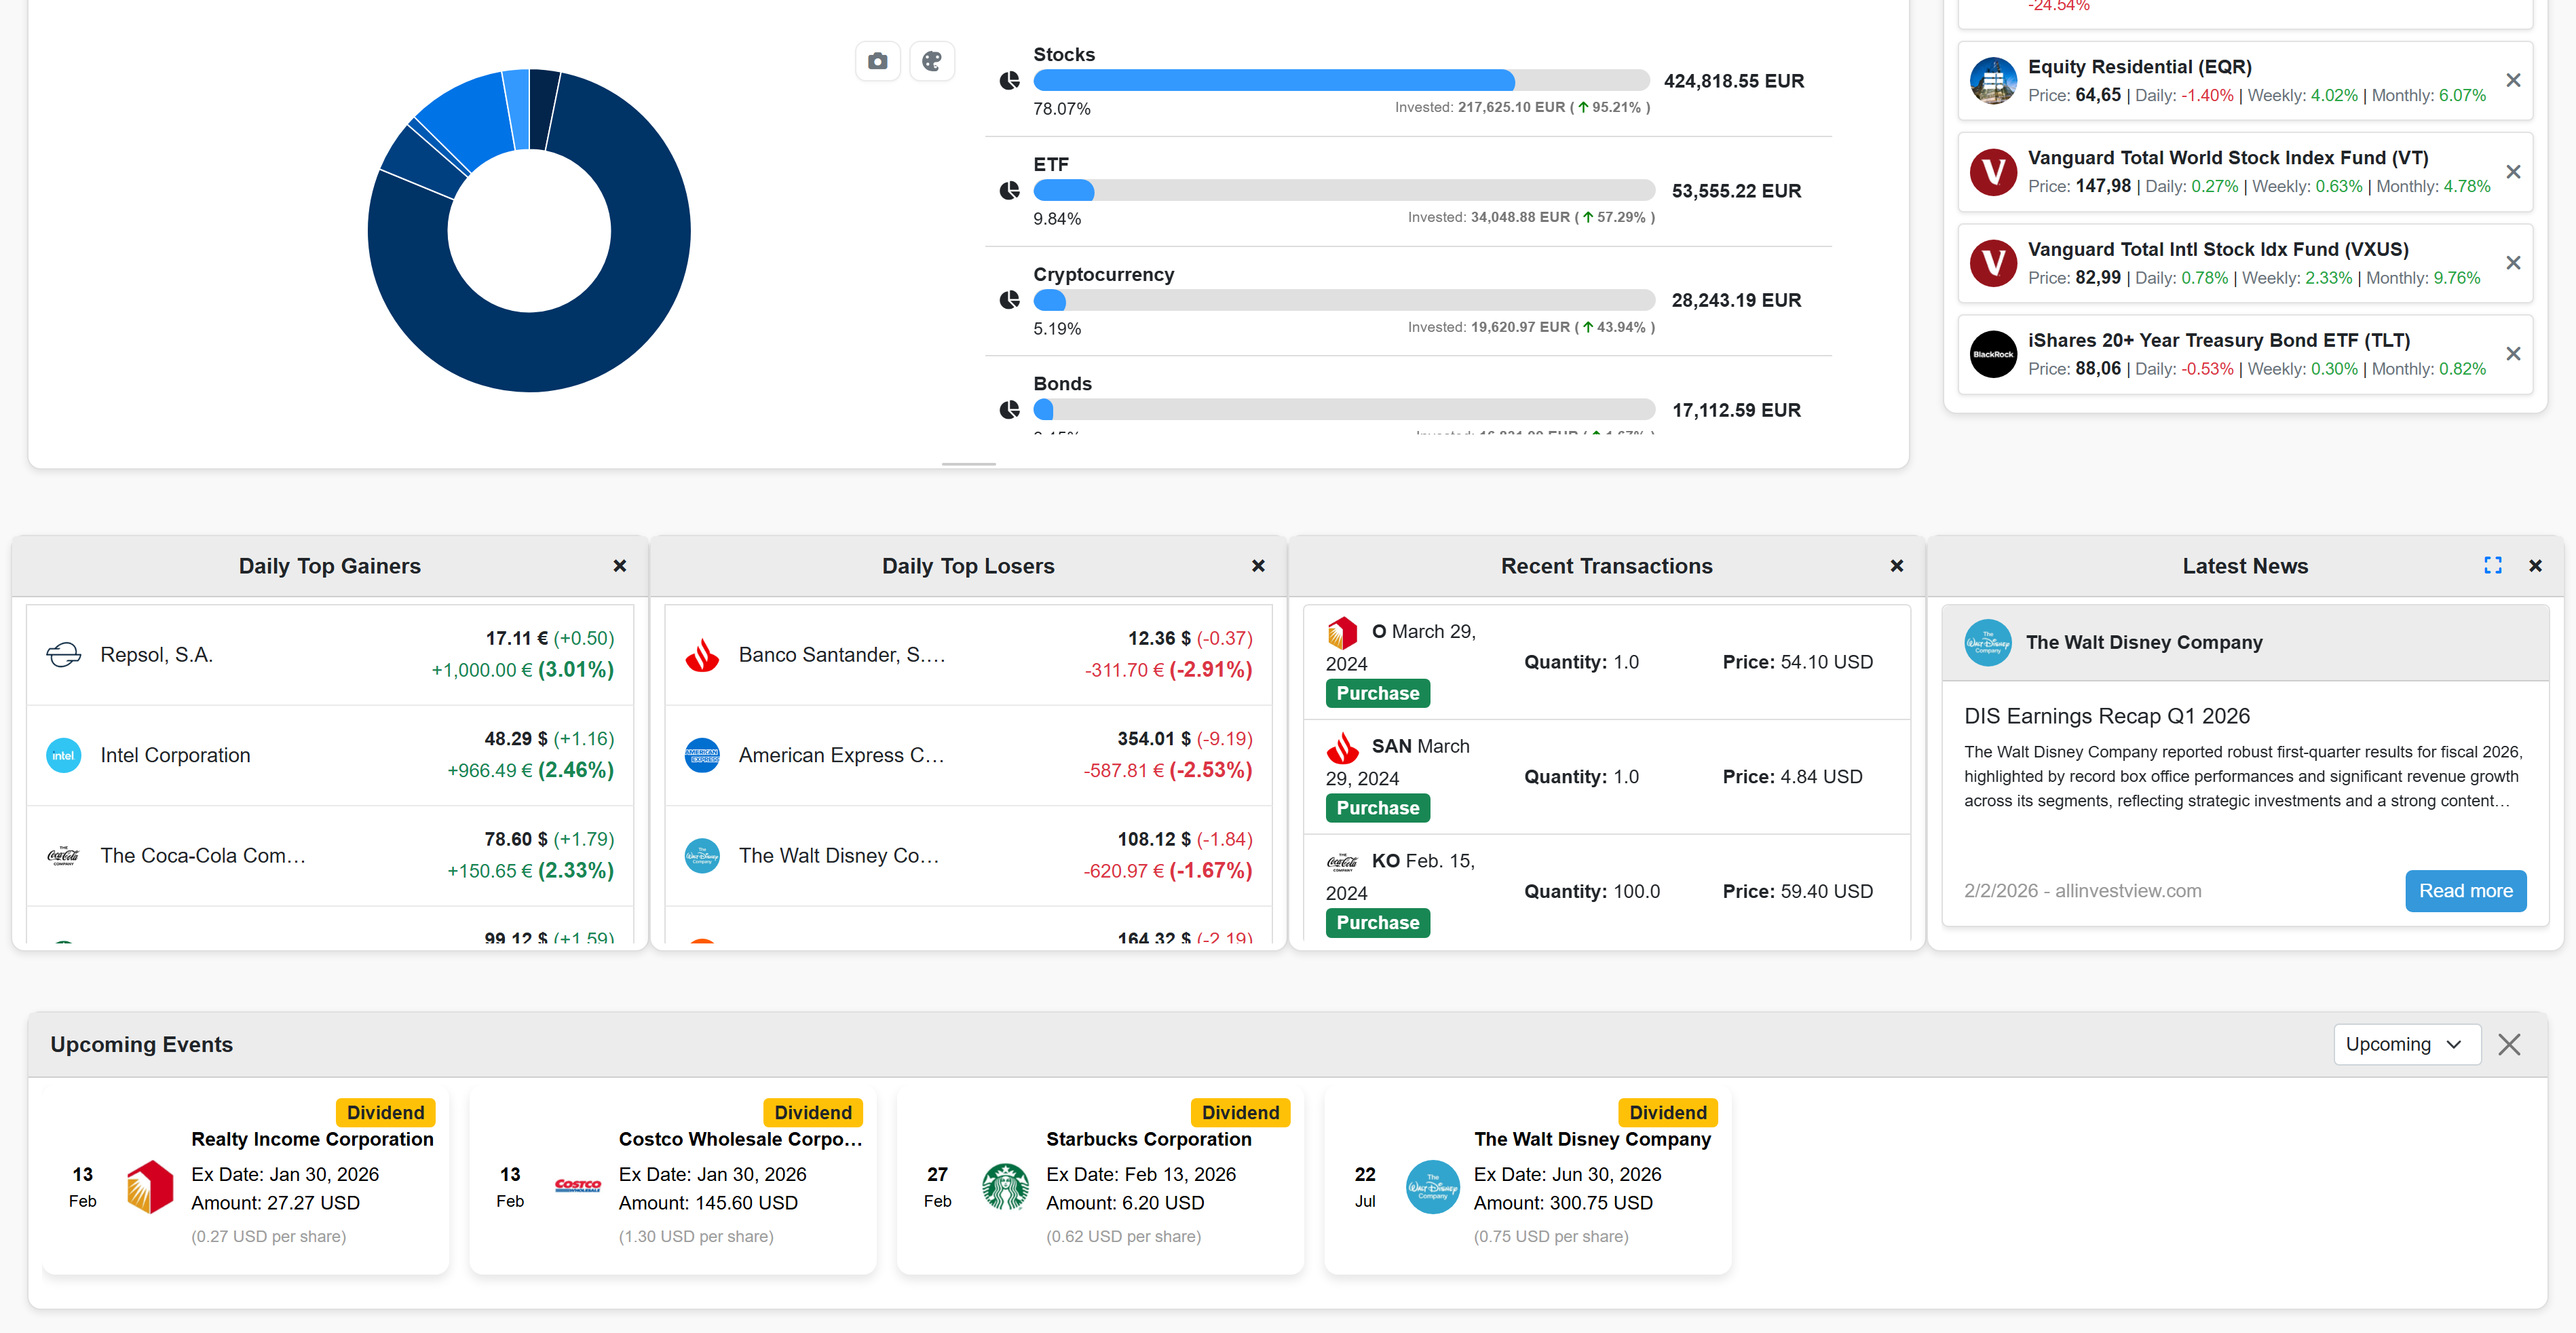
See Your Entire Portfolio at a Glance
Get the complete picture of your interactive investor investments with intuitive visualizations that show exactly where your money is allocated.
- Asset allocation by type, sector, and geography
- Real-time valuations in your preferred currency
- Performance attribution by holding
- Concentration risk indicators
Analytics That Actually Matter
Go beyond simple percentage gains. Understand your true risk-adjusted performance with institutional-quality metrics.
- Money-weighted returns (IRR/XIRR)
- Efficient Frontier optimization
- Correlation matrix across holdings
- Sharpe ratio and volatility metrics
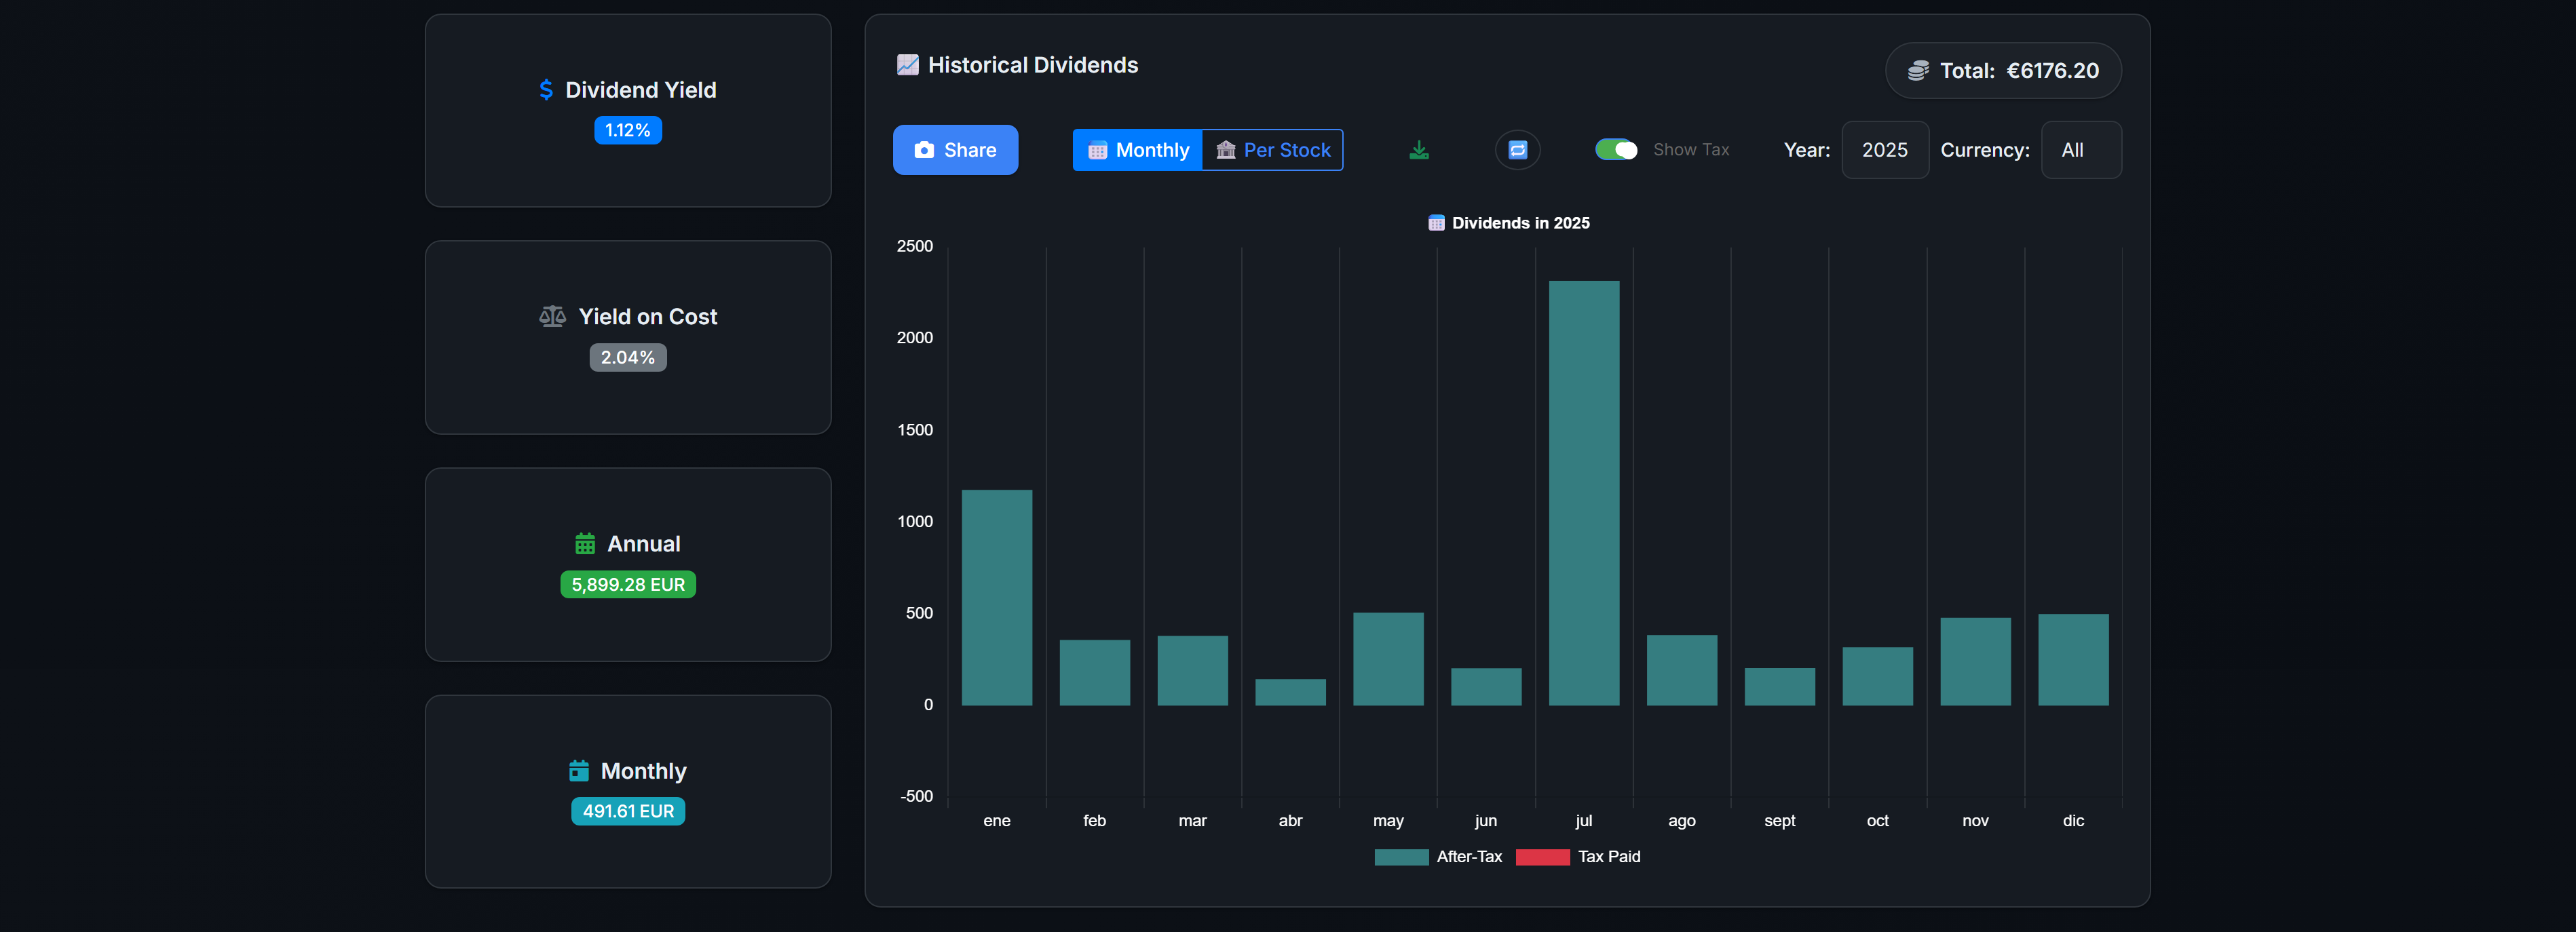
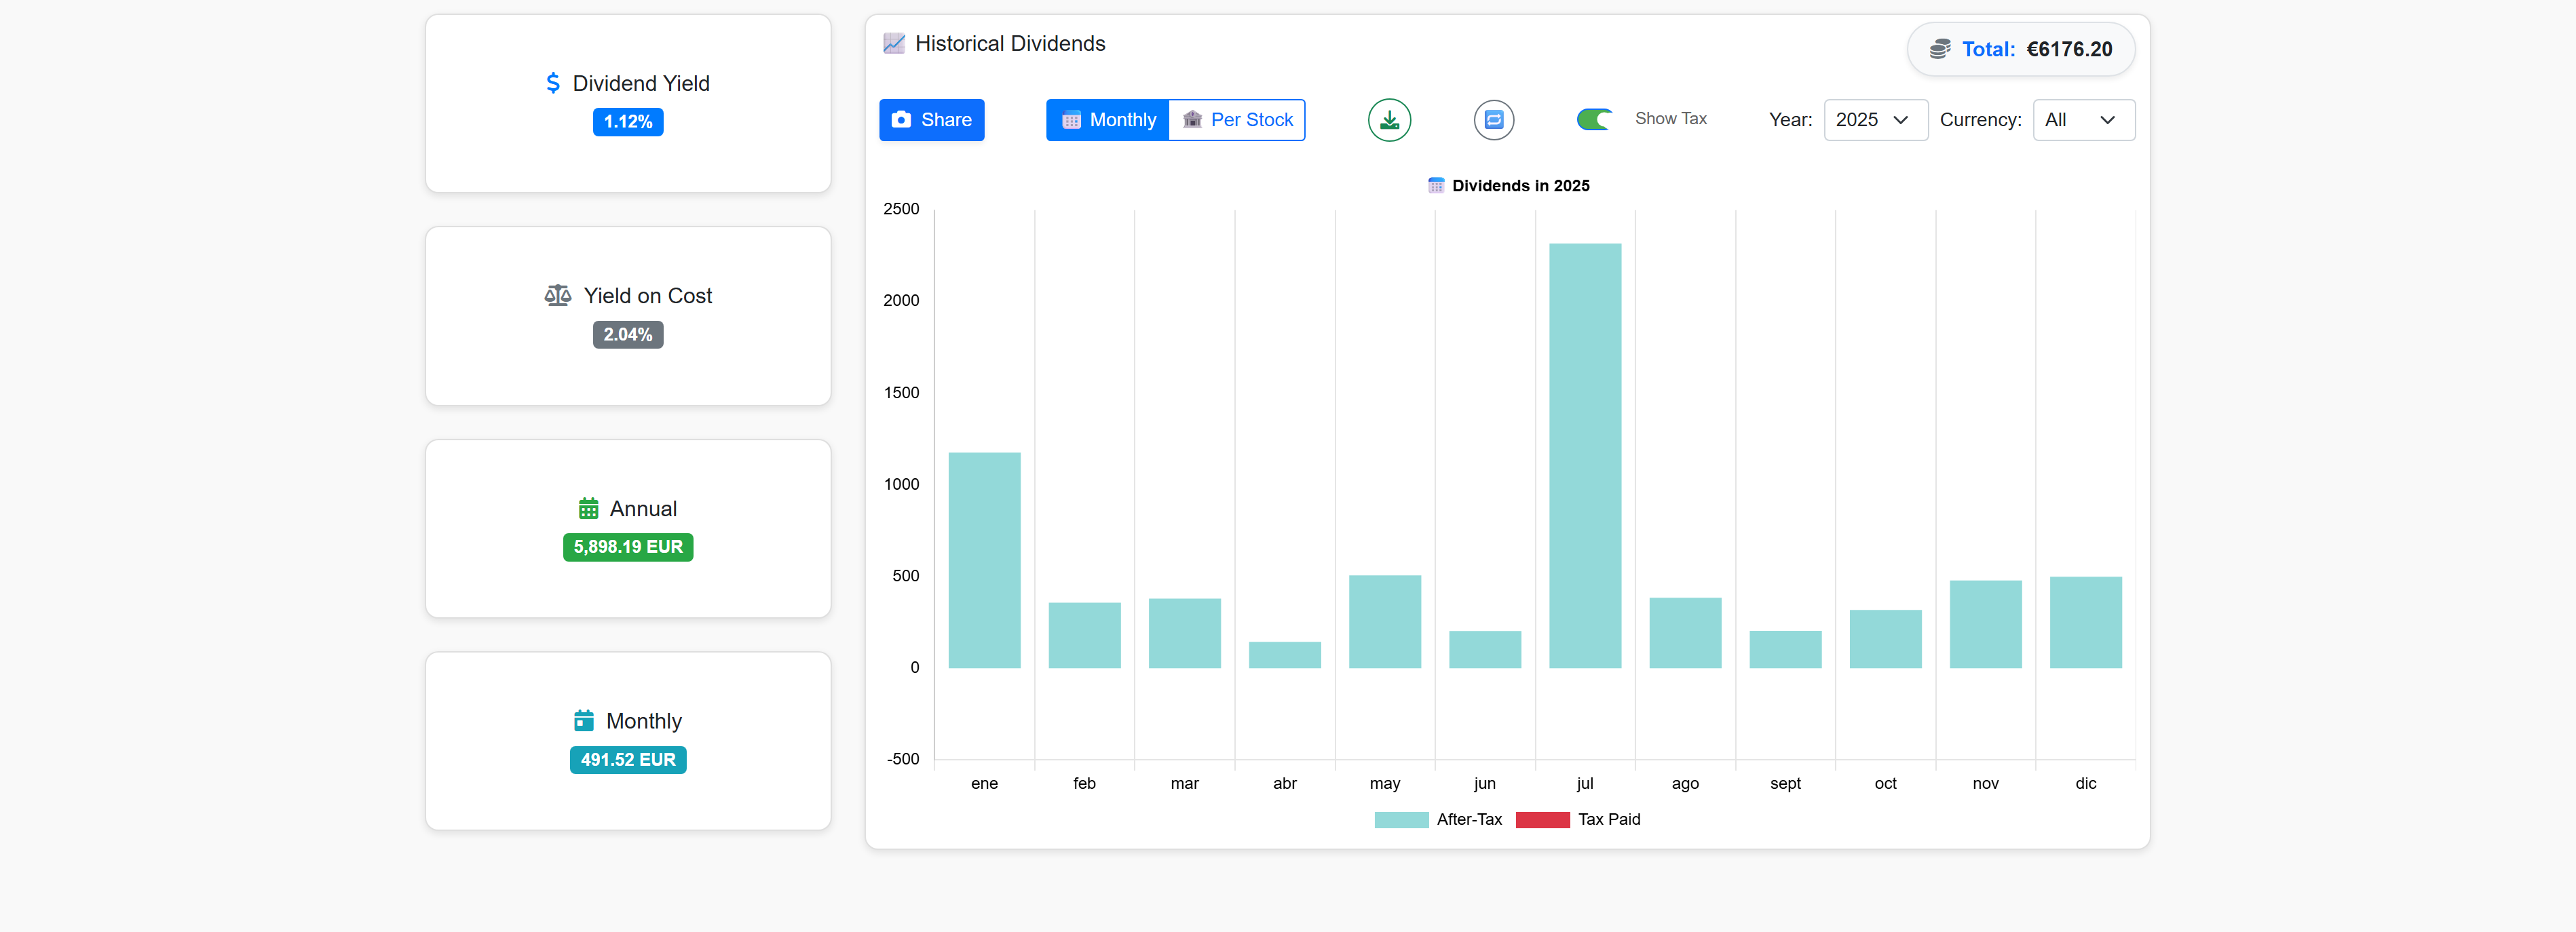
Master Your Dividend Income
Track every dividend from your interactive investor holdings. Know exactly when payments arrive and how your income is growing.
- Automatic dividend detection and tracking
- Calendar view of upcoming payments
- Yield on cost calculations
- Annual income projections
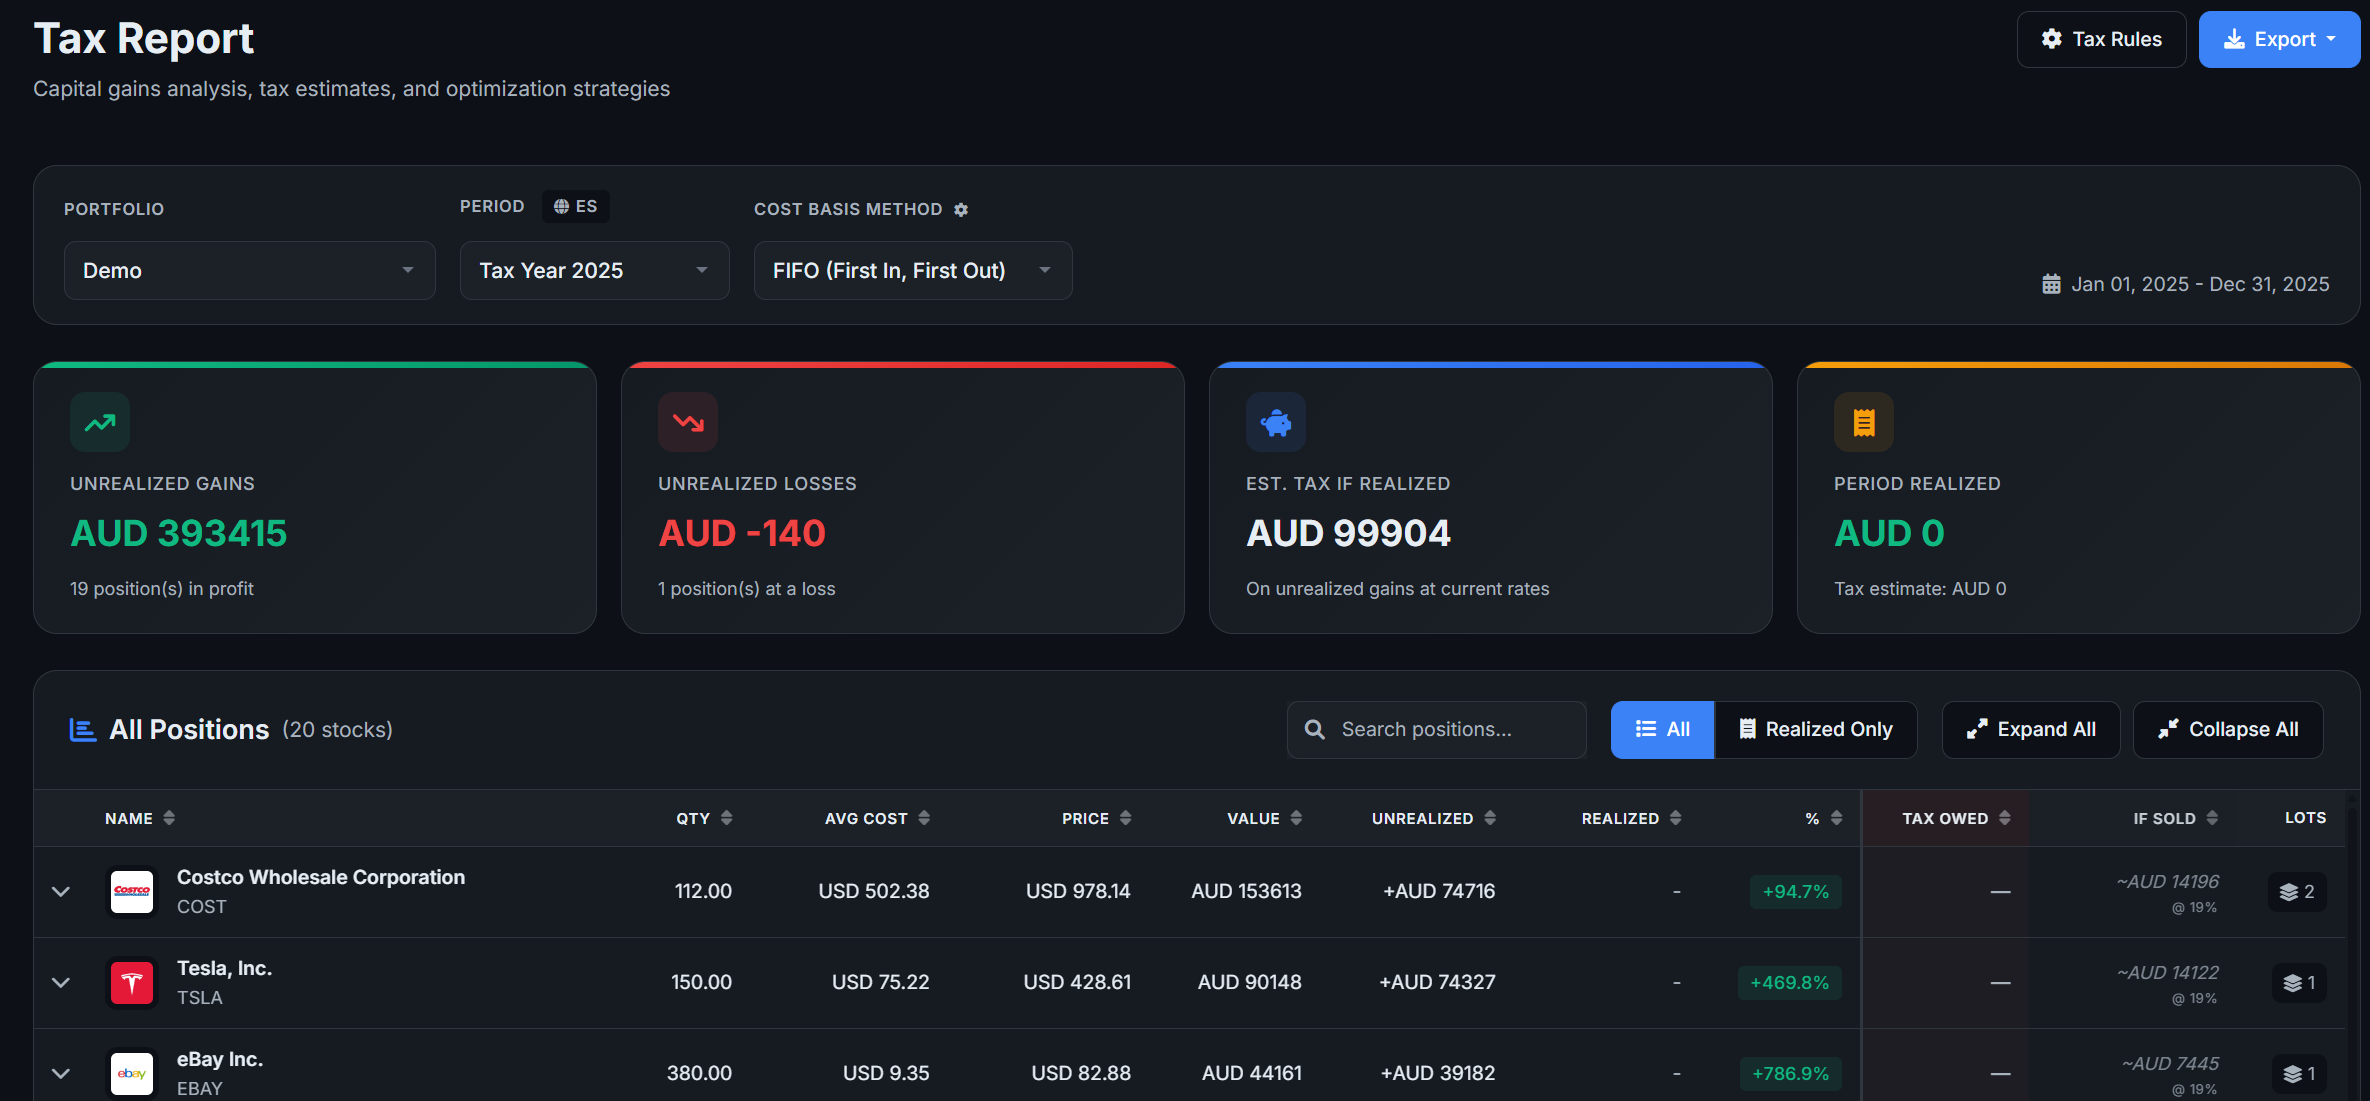
Tax Reports in One Click
Generate capital gains reports for your interactive investor portfolio instantly. Supports 14+ countries with multiple cost basis methods.
- FIFO, LIFO, specific identification, and average cost
- Automatic wash sale detection
- Short-term vs long-term capital gains split
- Export as PDF or CSV for tax filing
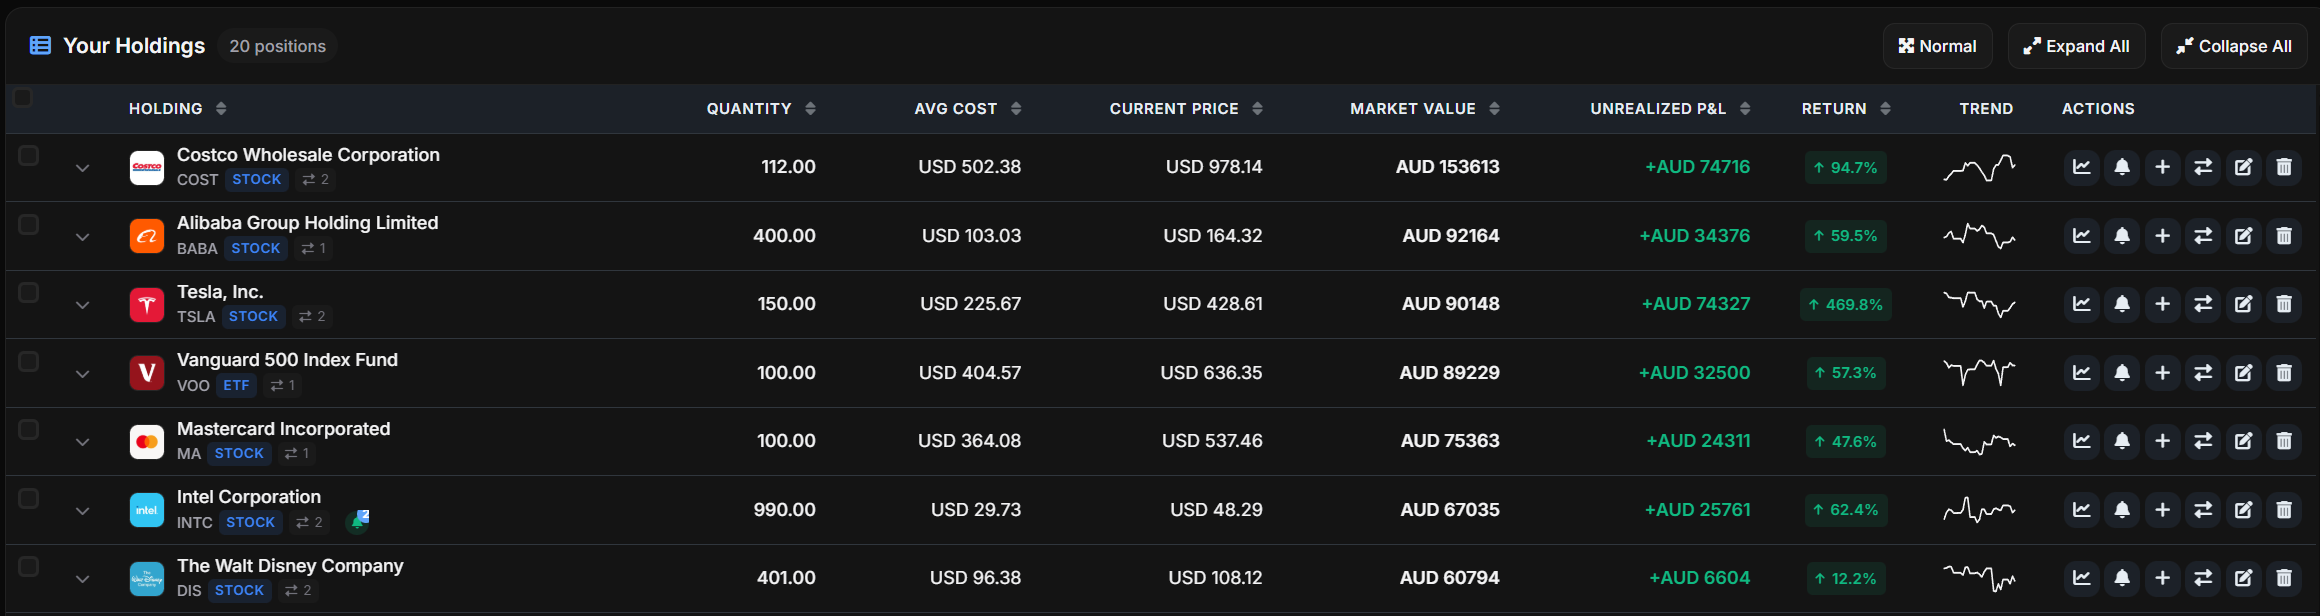
Every Holding, One Clean Table
See all your interactive investor positions with real-time prices, sparkline trends, and instant P&L — exactly the view your broker doesn't give you.
- Company logos, real-time prices, and sparklines
- Cost basis, market value, and unrealized P&L
- Sort and filter by any column
- Multi-broker holdings in one unified table
ISA & SIPP Tracking for UK Investors
Track your interactive investor ISA, SIPP, and General Investment Account separately. Capital gains tax reports aligned with HMRC requirements.
interactive investor
CSV ImportAbout interactive investor
How to Import Your interactive investor Portfolio
Getting your interactive investor data into AllInvestView takes less than 2 minutes. Here's how:
Export from interactive investor
1. Log in to your ii account at ii.co.uk. 2. Go to "My Accounts" and select the relevant account. 3. Click on "Transaction History" or "Activity." 4. Choose your date range. 5. Click "Export" or "Download CSV" to save your transactions. 6. Upload the CSV file to AllInvestView.
Upload to AllInvestView
Use our smart CSV importer that automatically maps interactive investor's format. No manual column matching needed.
Track Everything
Instantly see your full portfolio with real-time prices, dividends, and performance metrics.
Similar Brokers to interactive investor
Investors using interactive investor also track these brokers with AllInvestView:
Track All Your Brokers Together
Got investments at multiple brokers? AllInvestView consolidates everything into one view:
 DEGIRO
 Coinbase
interactive investor Portfolio Tracking FAQ
Compare Portfolio Trackers
Read our detailed comparisons to find the best tracker for your needs:
Ready to See Your interactive investor Portfolio Clearly?
Join thousands of investors who've upgraded from broker-provided tools to professional portfolio analytics.
Start Your Free Trial