Nutmeg performance by risk level
Nutmeg's highest-risk Fully Managed portfolio, risk level 10, returned 155.3% over the ten years to 31 August 2026, or 9.8% a year after fees. Nutmeg now trades as J.P. Morgan Personal Investing, and these are the figures it publishes for every Fully Managed risk level.
| Risk level | 10 years | Since Sept 2012 | Last 12 months |
|---|---|---|---|
| 1lowest | +13.9%1.3% a year | +21.3%1.4% a year | +5.2% |
| 2 | +25.0%2.3% a year | +42.4%2.6% a year | +7.1% |
| 3 | +32.0%2.8% a year | +55.9%3.2% a year | +9.2% |
| 4 | +40.5%3.5% a year | +72.3%4.0% a year | +11.0% |
| 5 | +53.6%4.4% a year | +93.6%4.9% a year | +13.6% |
| 6 | +70.4%5.5% a year | +118.1%5.8% a year | +15.7% |
| 7 | +92.3%6.8% a year | +156.1%7.0% a year | +17.9% |
| 8 | +116.1%8.0% a year | +195.4%8.1% a year | +20.3% |
| 9 | +141.2%9.2% a year | +241.4%9.2% a year | +22.5% |
| 10highest | +155.3%9.8% a year | +270.5%9.9% a year | +22.5% |
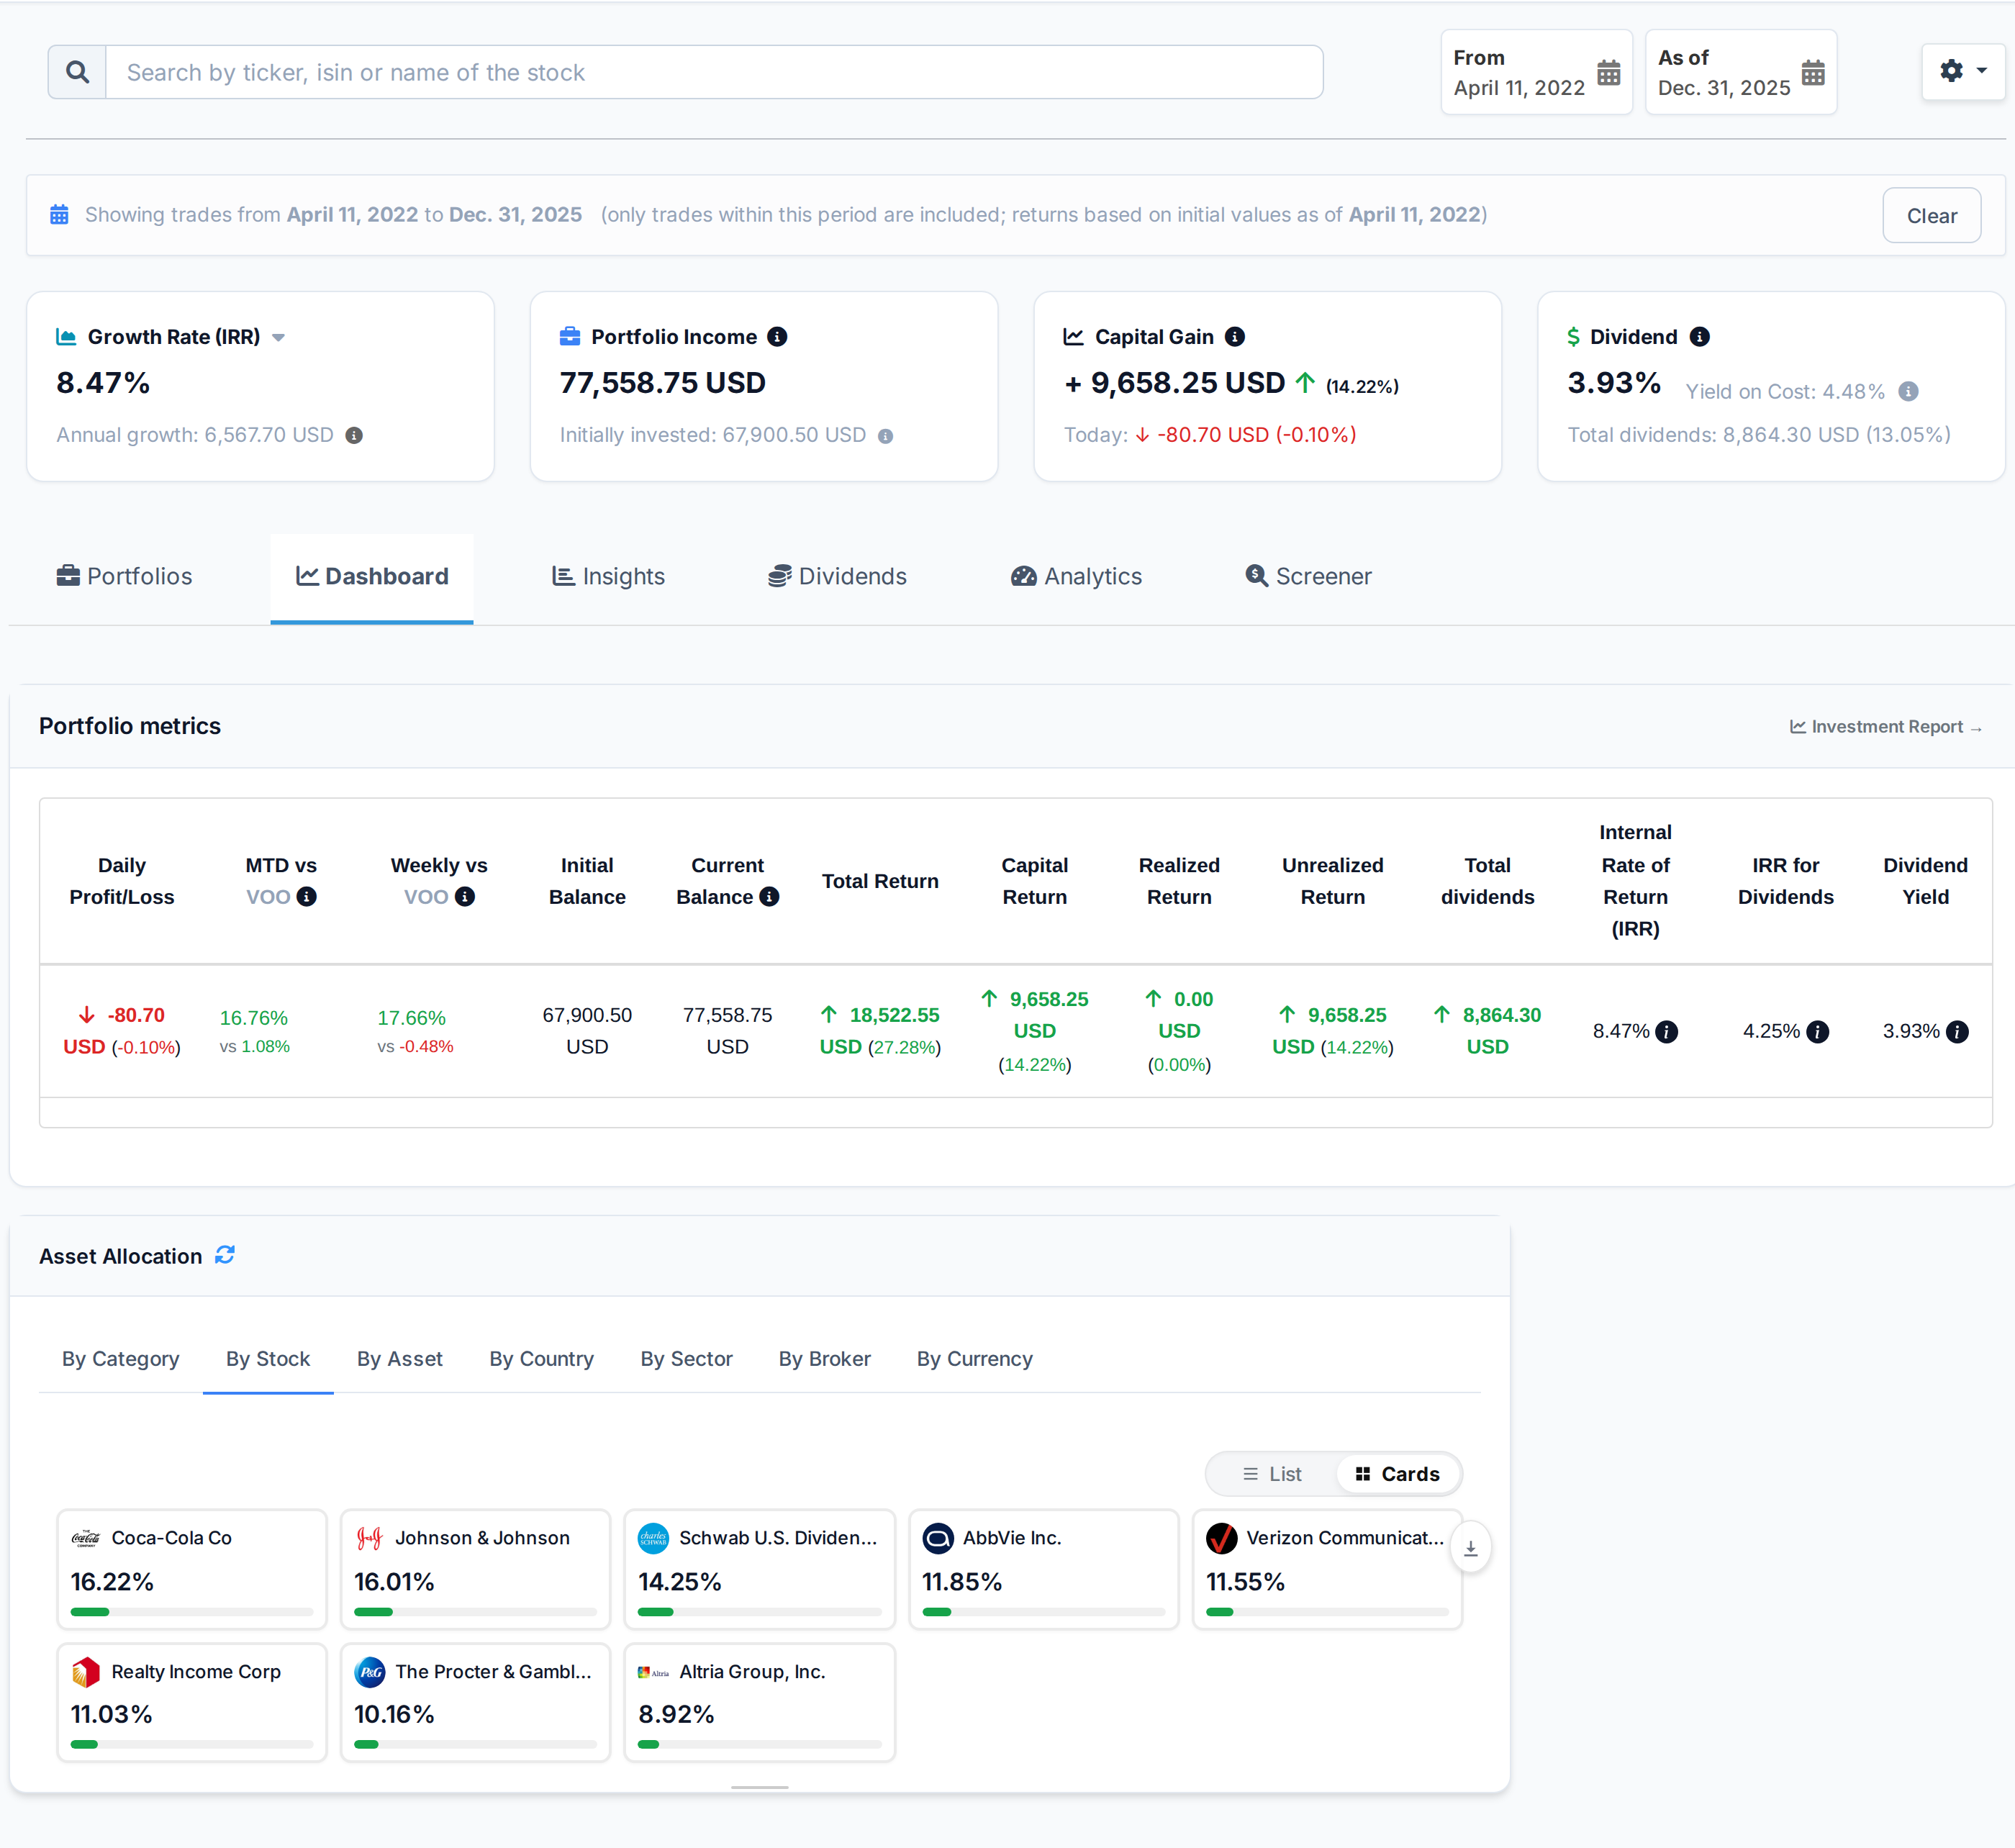
Those are averages across every client. Your own return depends on when you paid in and took money out, and that is the figure AllInvestView works out from your Nutmeg transactions, next to everything else you own.
Composite returns across all client accounts at each risk level, weighted by value, after management fees, fund costs and market spread. To 31 August 2026. Past performance is not a reliable guide to future returns. Source: J.P. Morgan Personal Investing, Fully Managed track record.
Your Nutmeg portfolio next to everything else you own, with one net worth figure and one return.
Upload your Nutmeg transaction history. You get the return between any two dates, the dividends you were paid and the ones coming, and a capital gains report for your country.
 AllInvestView
What Nutmeg does well
What people like about Nutmeg, and why they stay.
Managed ETF portfolios, now run as J.P. Morgan Personal Investing.
Six investment styles, from low-cost Fixed Allocation to Fully Managed and Smart Alpha.
UK tax wrappers including Lifetime ISA.
Automatic rebalancing to maintain target allocation.
Risk-level selection from 1 (conservative) to 10 (aggressive).
What your broker leaves to you
Your broker is built for trading. The return, the tax figure and the view across accounts are what you get here.
Nutmeg reports ISA, Lifetime ISA and other account types as managed totals. The contribution from each underlying ETF is not shown.
Nutmeg keeps ISA and General Investment Account among its 5 account types with ETFs and Managed Portfolios in GBP. Holdings at another broker are outside that total.
The Nutmeg account shows managed growth, but not each holding beside your other accounts.
What AllInvestView does with your Nutmeg data
Review every row before you import it
A Nutmeg portfolio is usually a managed basket of ETFs that changes as it is rebalanced.
Upload the transaction file and review the mapped columns and rows. Nothing is added until you confirm the import.
Review a file import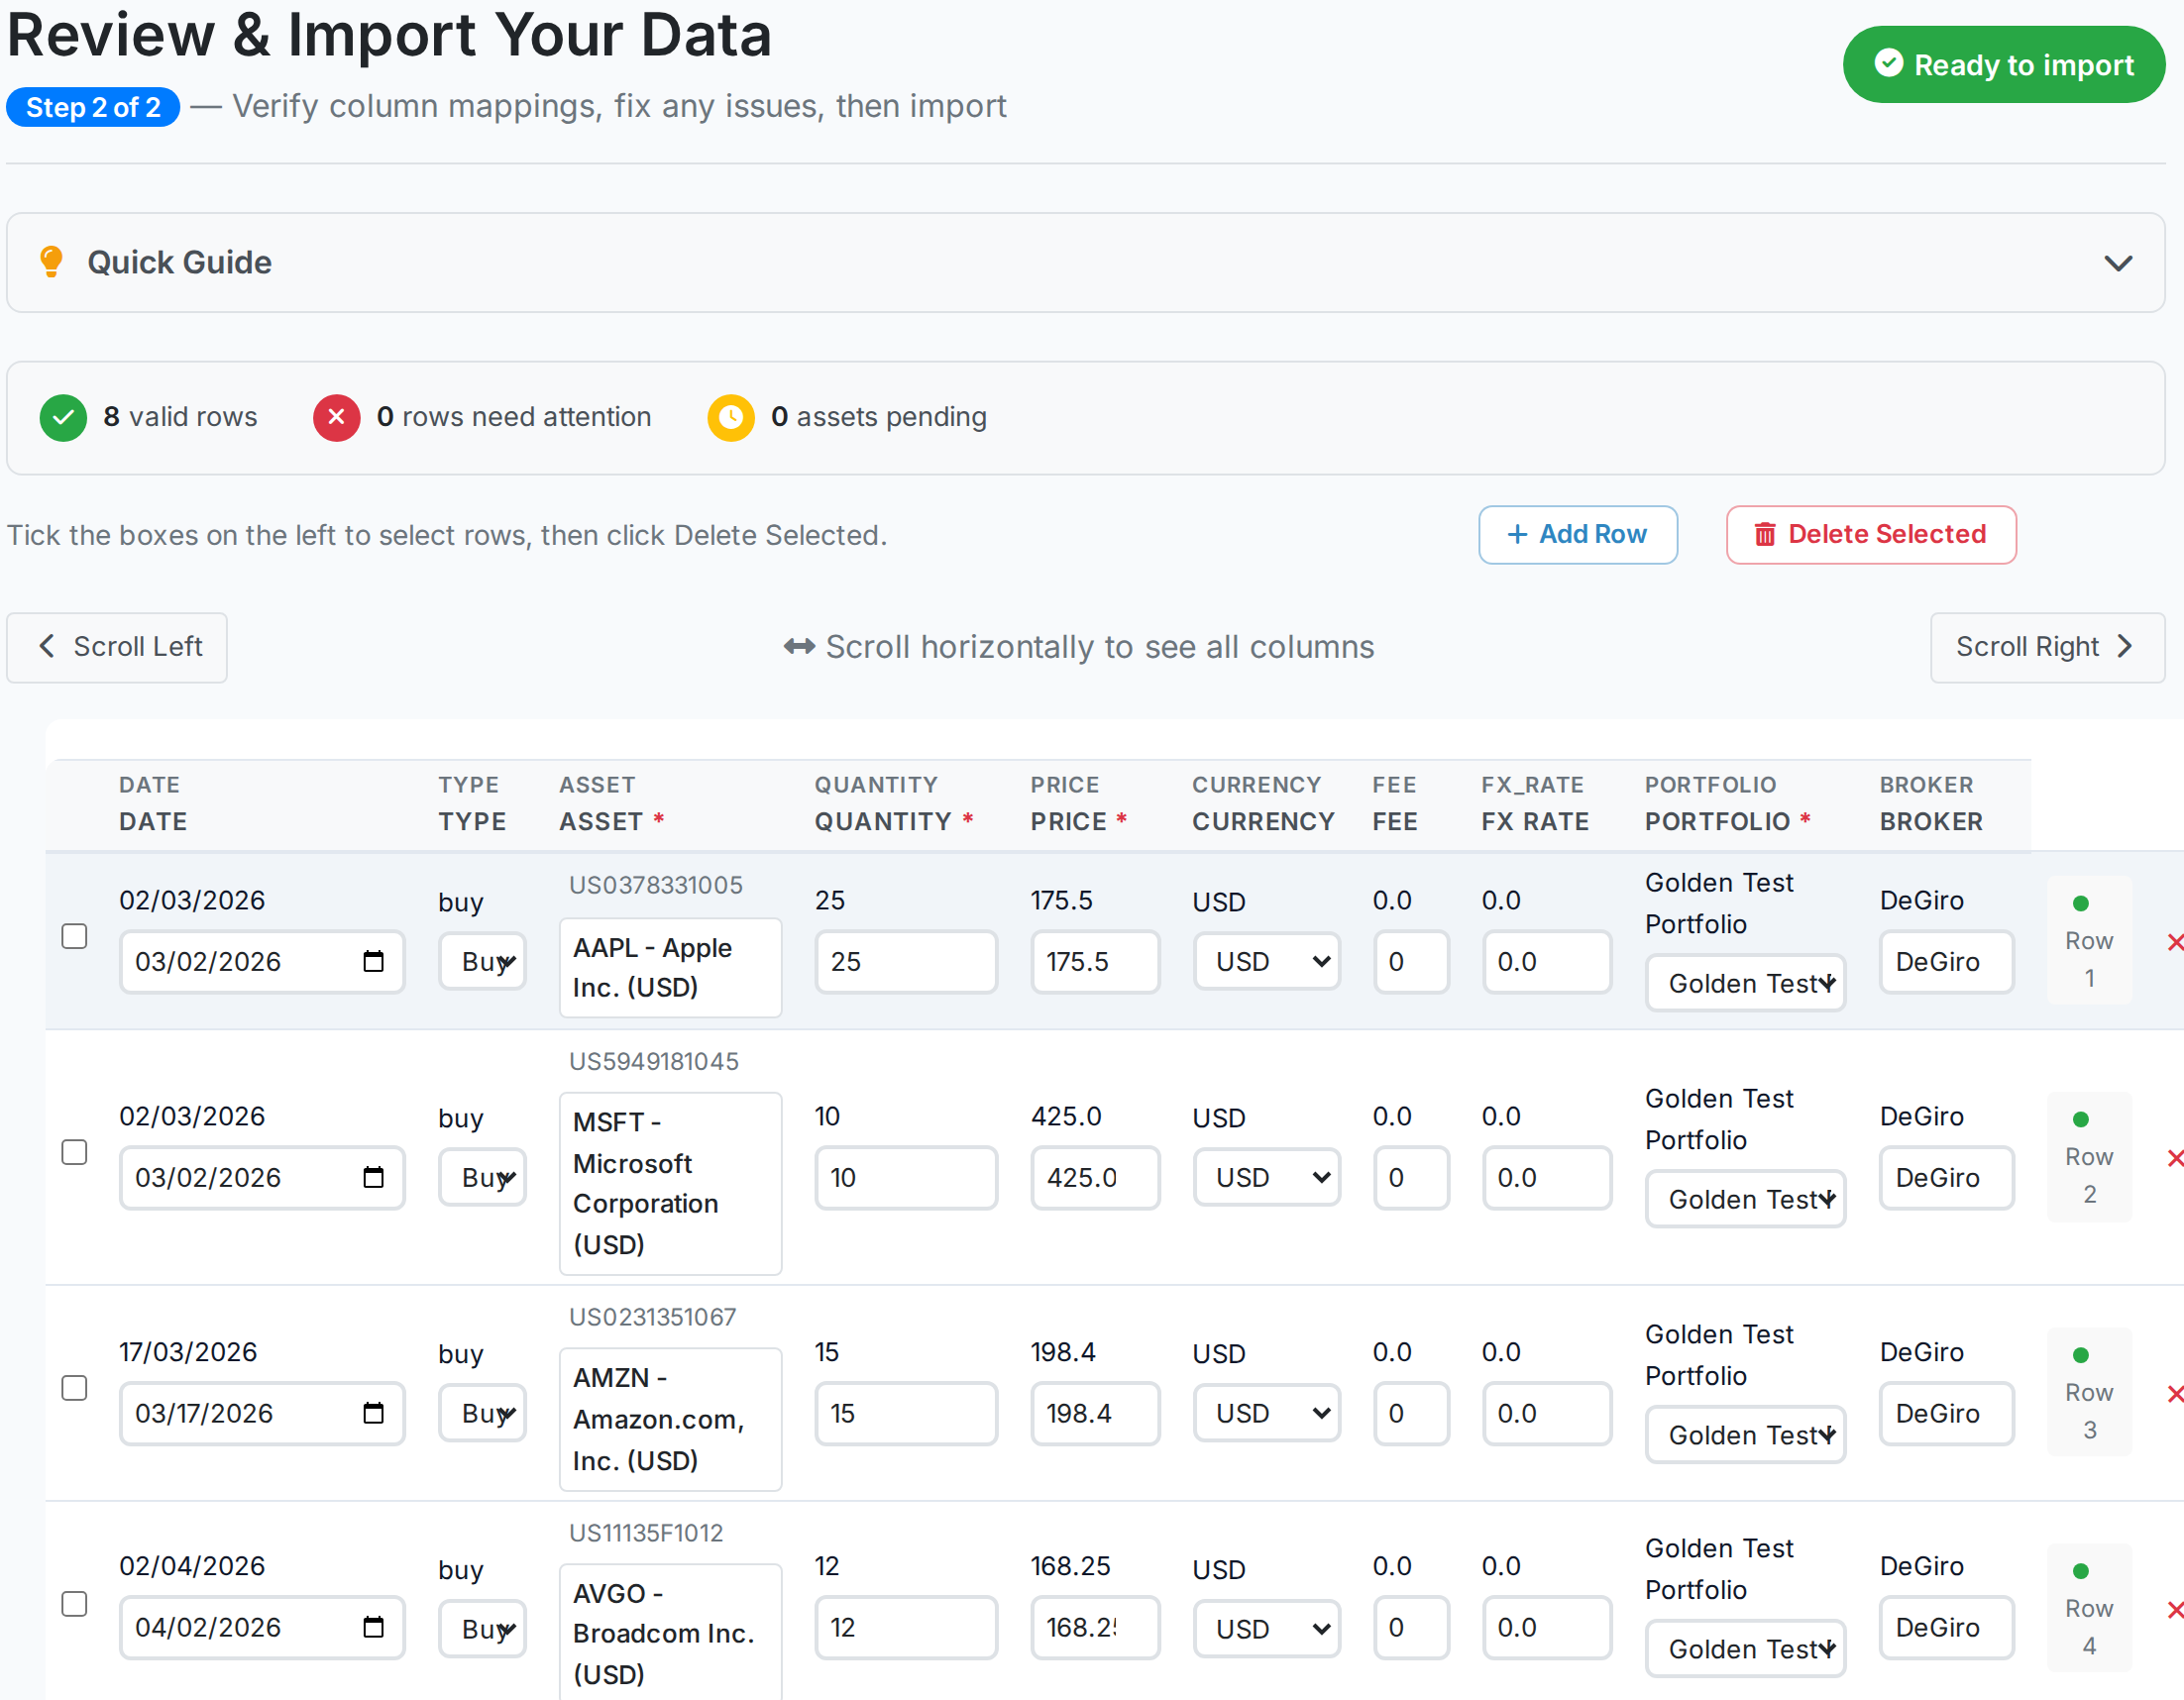 AllInvestView
Trace dividend income from payment to forecast
The funds inside a Nutmeg portfolio can produce distributions throughout the year.
The report totals gross, withheld and net dividend income. It also shows payment history by company and a 12-month forecast.
Open the dividend report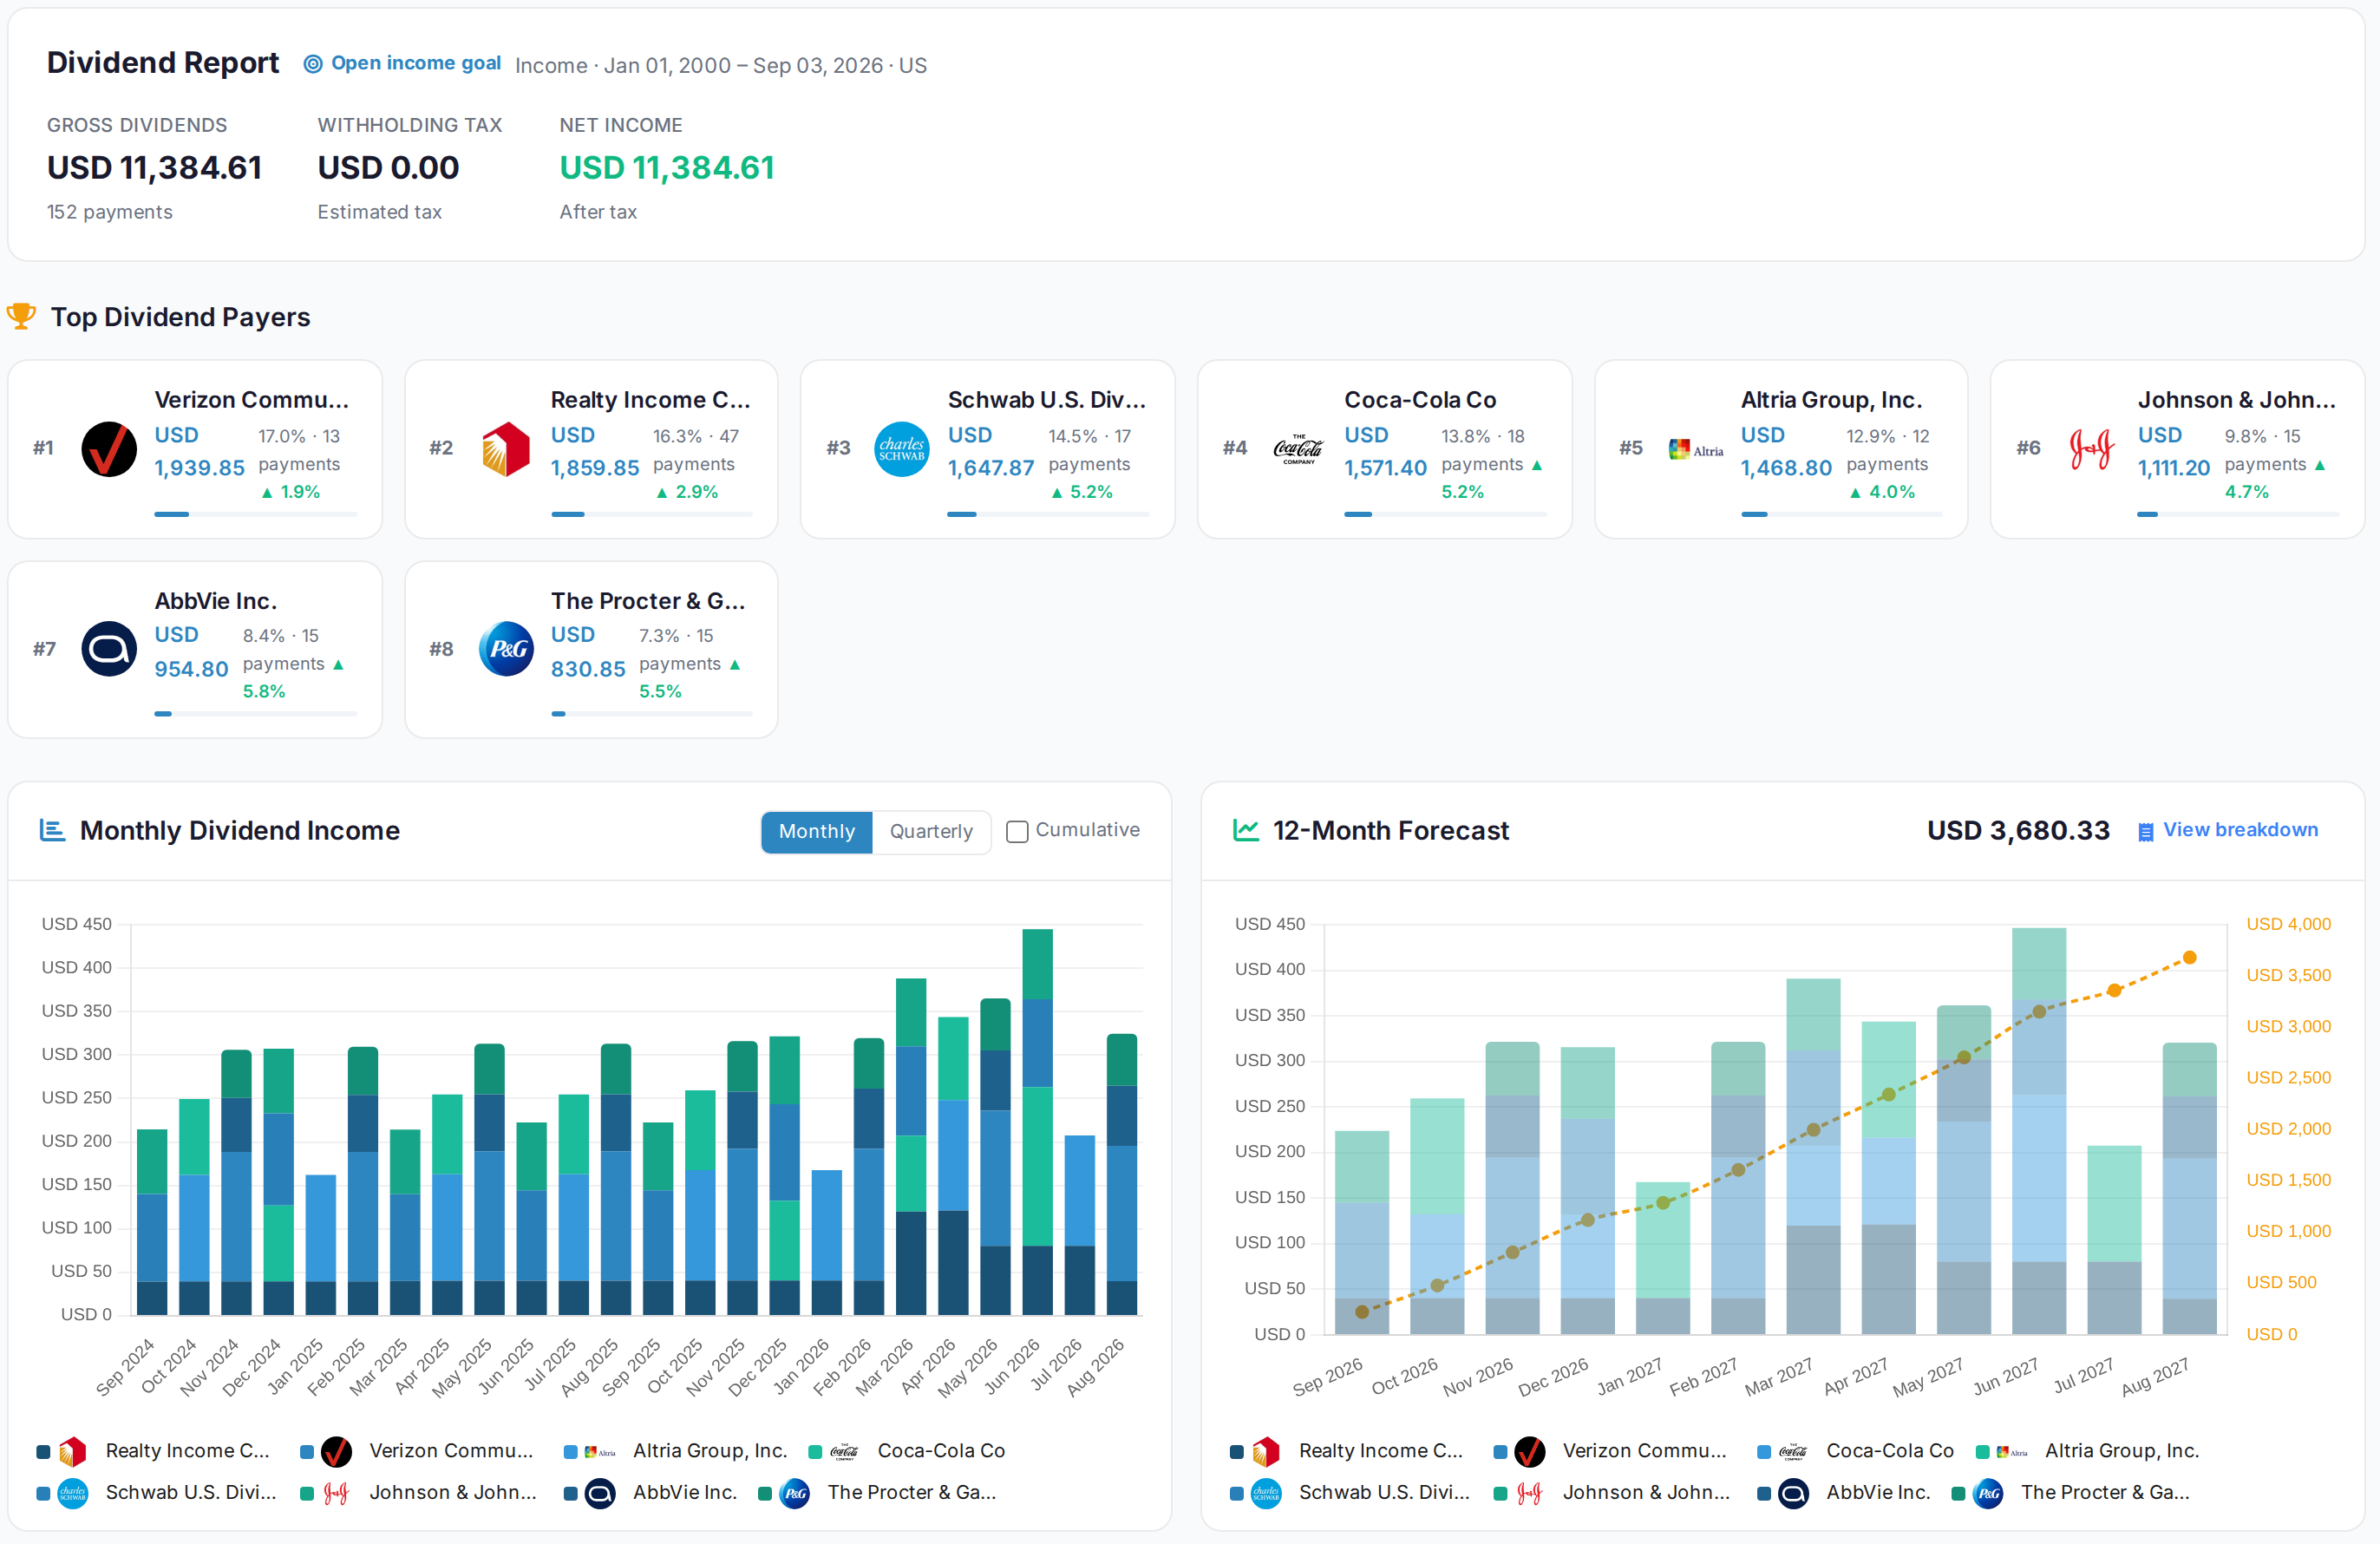 AllInvestView
See what sits inside your funds
Several Nutmeg ETFs may own the same companies even when their allocations differ.
Portfolio X-Ray opens each fund and combines repeated underlying holdings. It shows overlap and concentration across the portfolio.
Open Portfolio X-Ray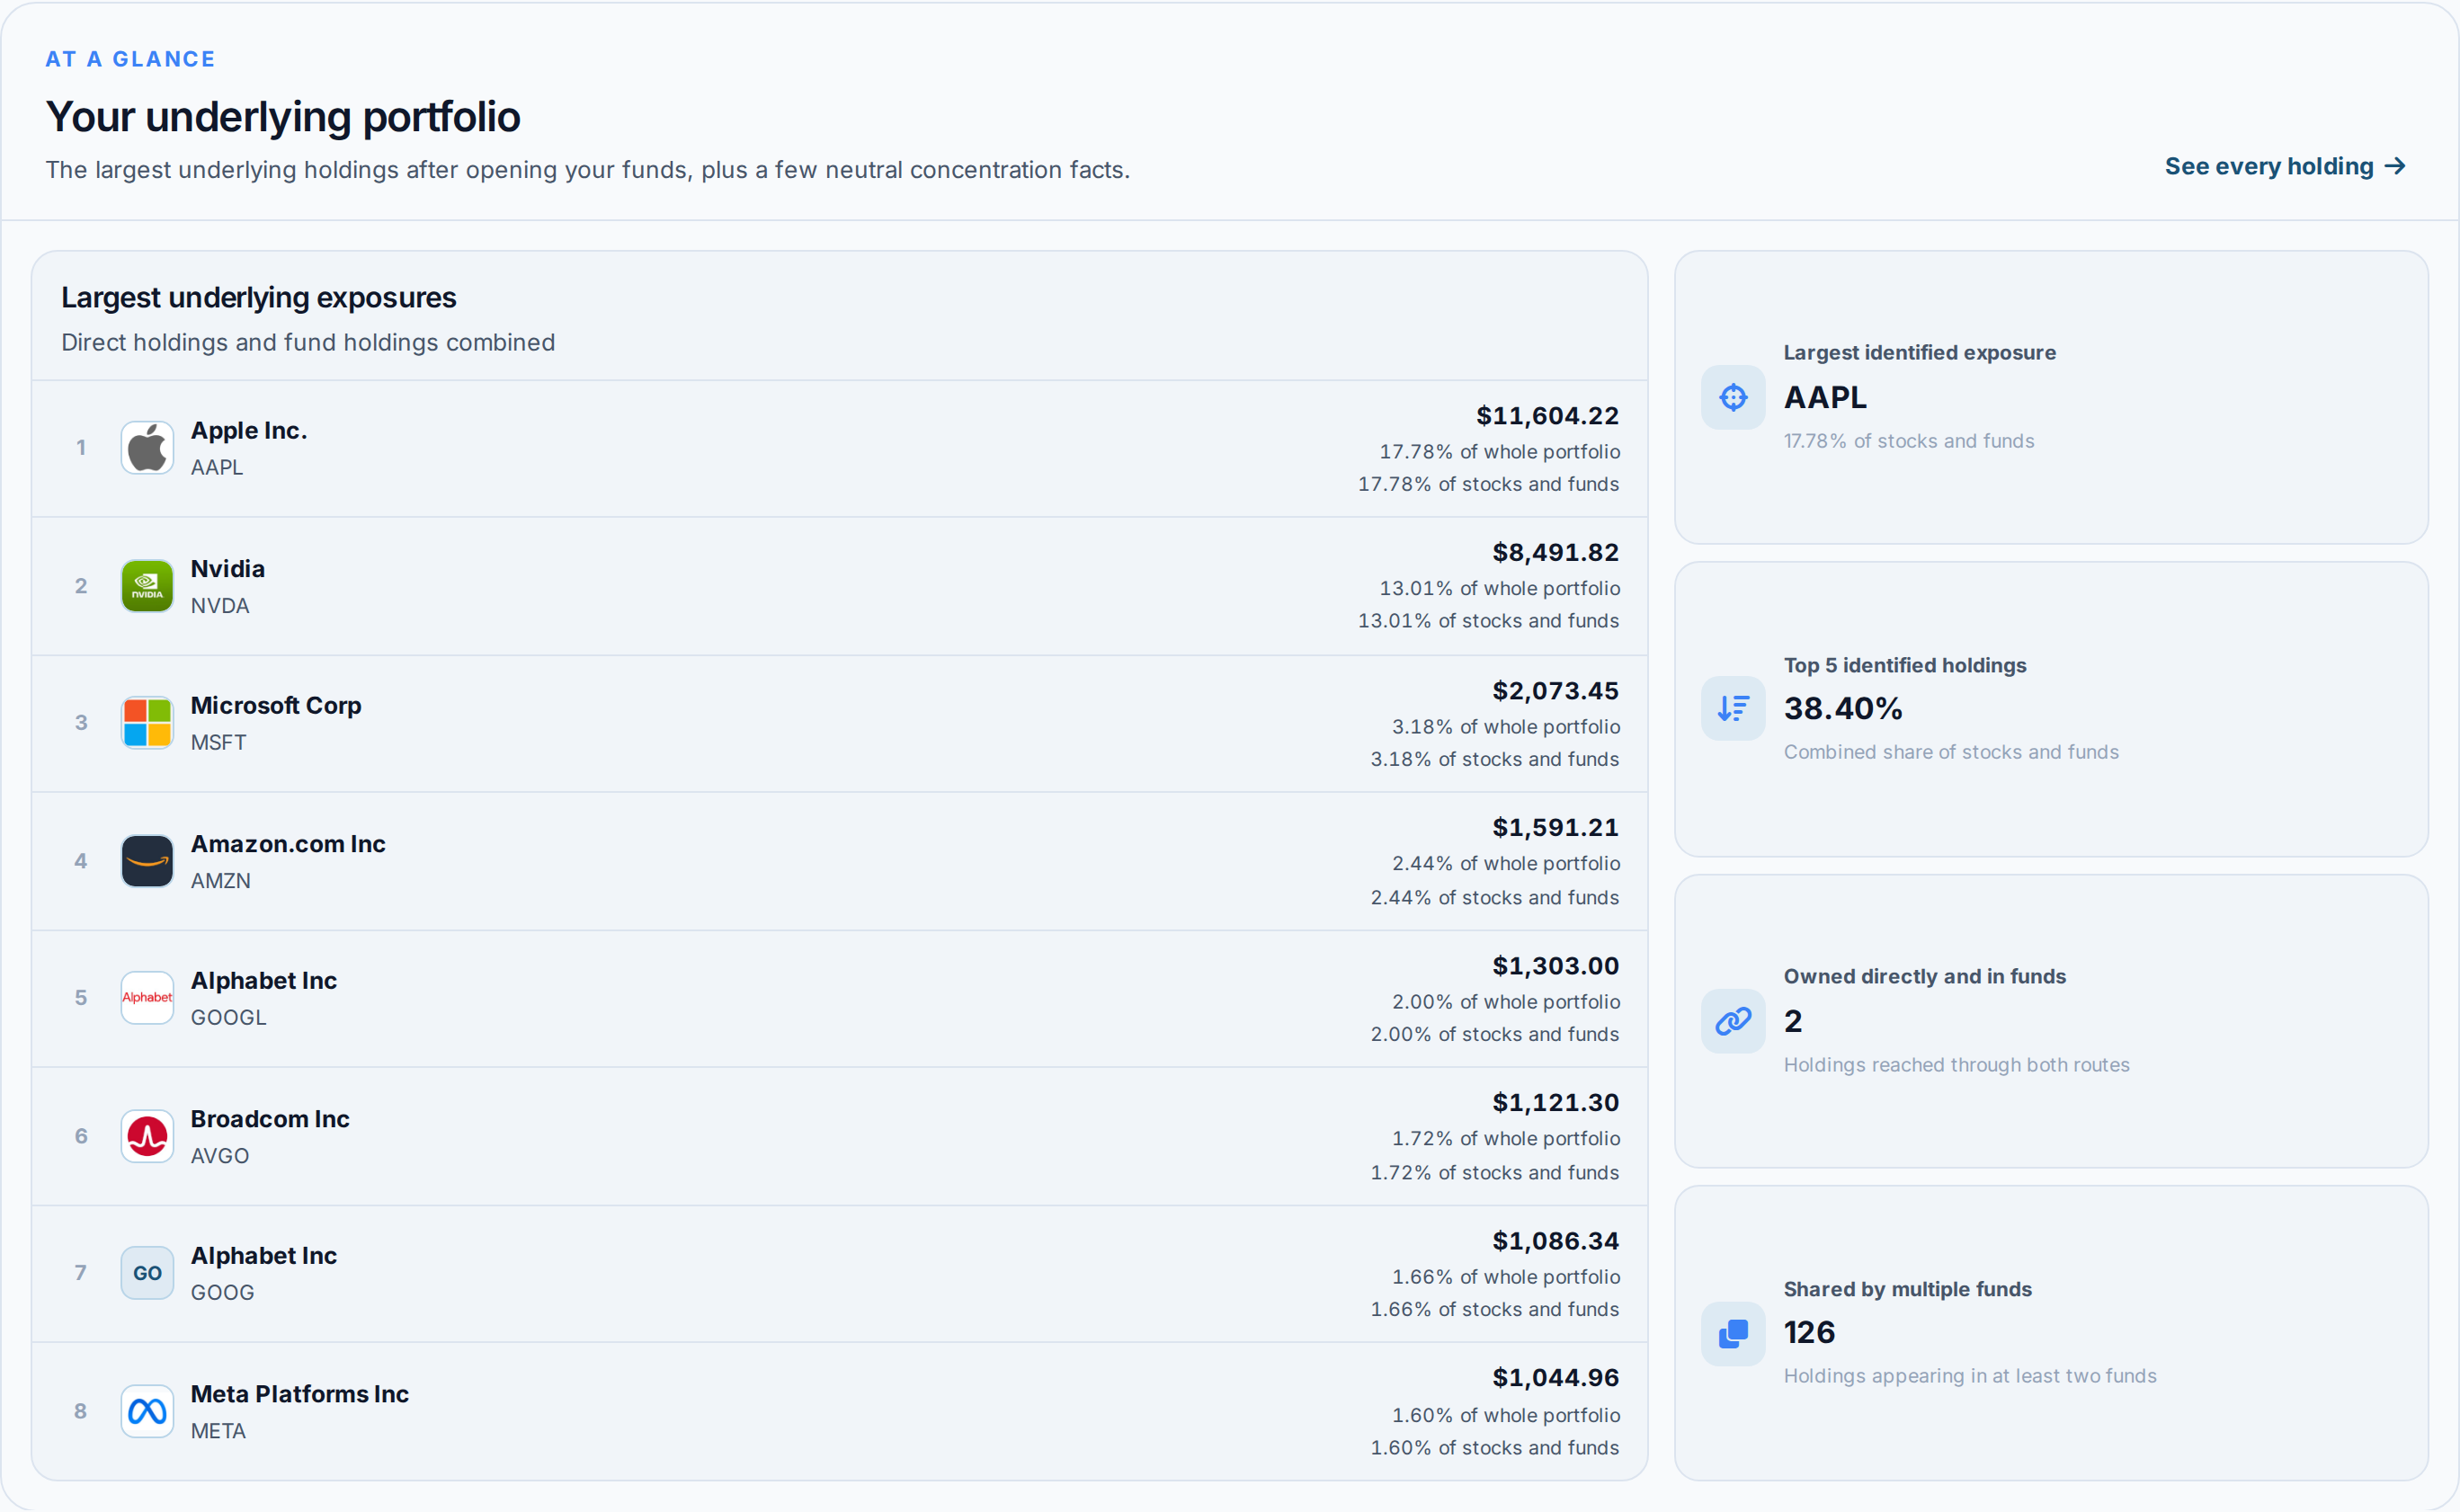 AllInvestView
What Nutmeg gives you, and what is added here
| Area | Nutmeg | With AllInvestView |
|---|---|---|
| Performance Analytics | The broker tools include portfolio-level returns and growth chart. | The dashboard calculates XIRR and return between chosen dates. |
| Portfolio Management | The broker tools include Fully managed with automatic rebalancing. | The dashboard shows allocation and changes over time. |
| Tax Reporting | The broker tools include basic annual tax pack. | The tax report supports FIFO, LIFO, HIFO and average cost. |
| Multi-Broker View | The account view covers holdings kept with this broker. | Accounts from several brokers can be viewed together. |
| Dividend Tracking | Dividend entries stay in the account history. | The dividend view shows the calendar, income and yield on cost. |
| Risk Analytics | The broker tools include Risk level selection (1-10) with portfolio matching. | The risk view shows ratios, value at risk and simulations. |
| Fee Analysis | The account view shows management fee percentage. | Dated returns include imported costs. |
For investors filing in the United Kingdom
ISA, SIPP and a general account are separate portfolios, and the tax report follows the UK rules.
Sterling as your base currency, with everything foreign converted at the rate of the day
Bed and breakfast handled on the 30 day rule
The annual exemption applied before the rate
Dividend income separated from gains, with the withholding already taken off
Getting your Nutmeg history in
Export from Nutmeg
Open the Nutmeg pot, then Transactions or Activity. Download the statement, or request the transaction export from Nutmeg support, then upload it to AllInvestView.
Upload it
The importer reads the column layout on its own, identifies the securities and shows you every row before anything is saved.
Read your portfolio
Prices update daily, and dividends, corporate actions and splits are applied to the history you just brought in. Nothing else to keep up to date by hand.
About Nutmeg
Nutmeg and everywhere else you hold something
Most people end up with two or three accounts. Bring them all in and they add up to one portfolio, with one return and one tax report.
Often held alongside Nutmeg
Every broker with a page here
 Trading 212
 Freetrade
 Revolut
 TradeStation Global
 Zerodha
Once your Nutmeg history is in




Nutmeg and AllInvestView, answered
See what your Nutmeg portfolio has really done
Upload your transaction history. The return, the dividends and the tax figures are waiting on the other side.
Create a free account