Fidelity brokerage, workplace and retirement accounts in one view, with the return, the tax report and the dividends.
Connect Fidelity read only, or upload your transaction history. You get the return between any two dates, the dividends you were paid and the ones coming, and a capital gains report for your country.
 AllInvestView
What Fidelity does well
What people like about Fidelity, and why they stay.
Zero-fee index funds (FZROX, FZILX); literally 0.00% expense ratio.
Research and screener tools included free for all account holders.
Commission-free trading on stocks, ETFs, and options (no per-contract fee).
Retirement planning with 401(k) administration and HSA accounts.
Fractional shares (Stocks by the Slice) starting at $1.
What your broker leaves to you
Your broker is built for trading. The return, the tax figure and the view across accounts are what you get here.
The Fidelity account reports each account, but not one result for brokerage, workplace and retirement assets.
Fidelity keeps Individual and 529 Plan among its 10 account types with Stocks and Crypto among 7 asset types in USD. Holdings at another broker are outside that total.
Fidelity statements cover Stocks, ETFs, Options, Bonds, Mutual Funds, CDs and Crypto in USD for Individual and 529 Plan. They do not compare tax lots under several cost-basis methods.
What AllInvestView does with your Fidelity data
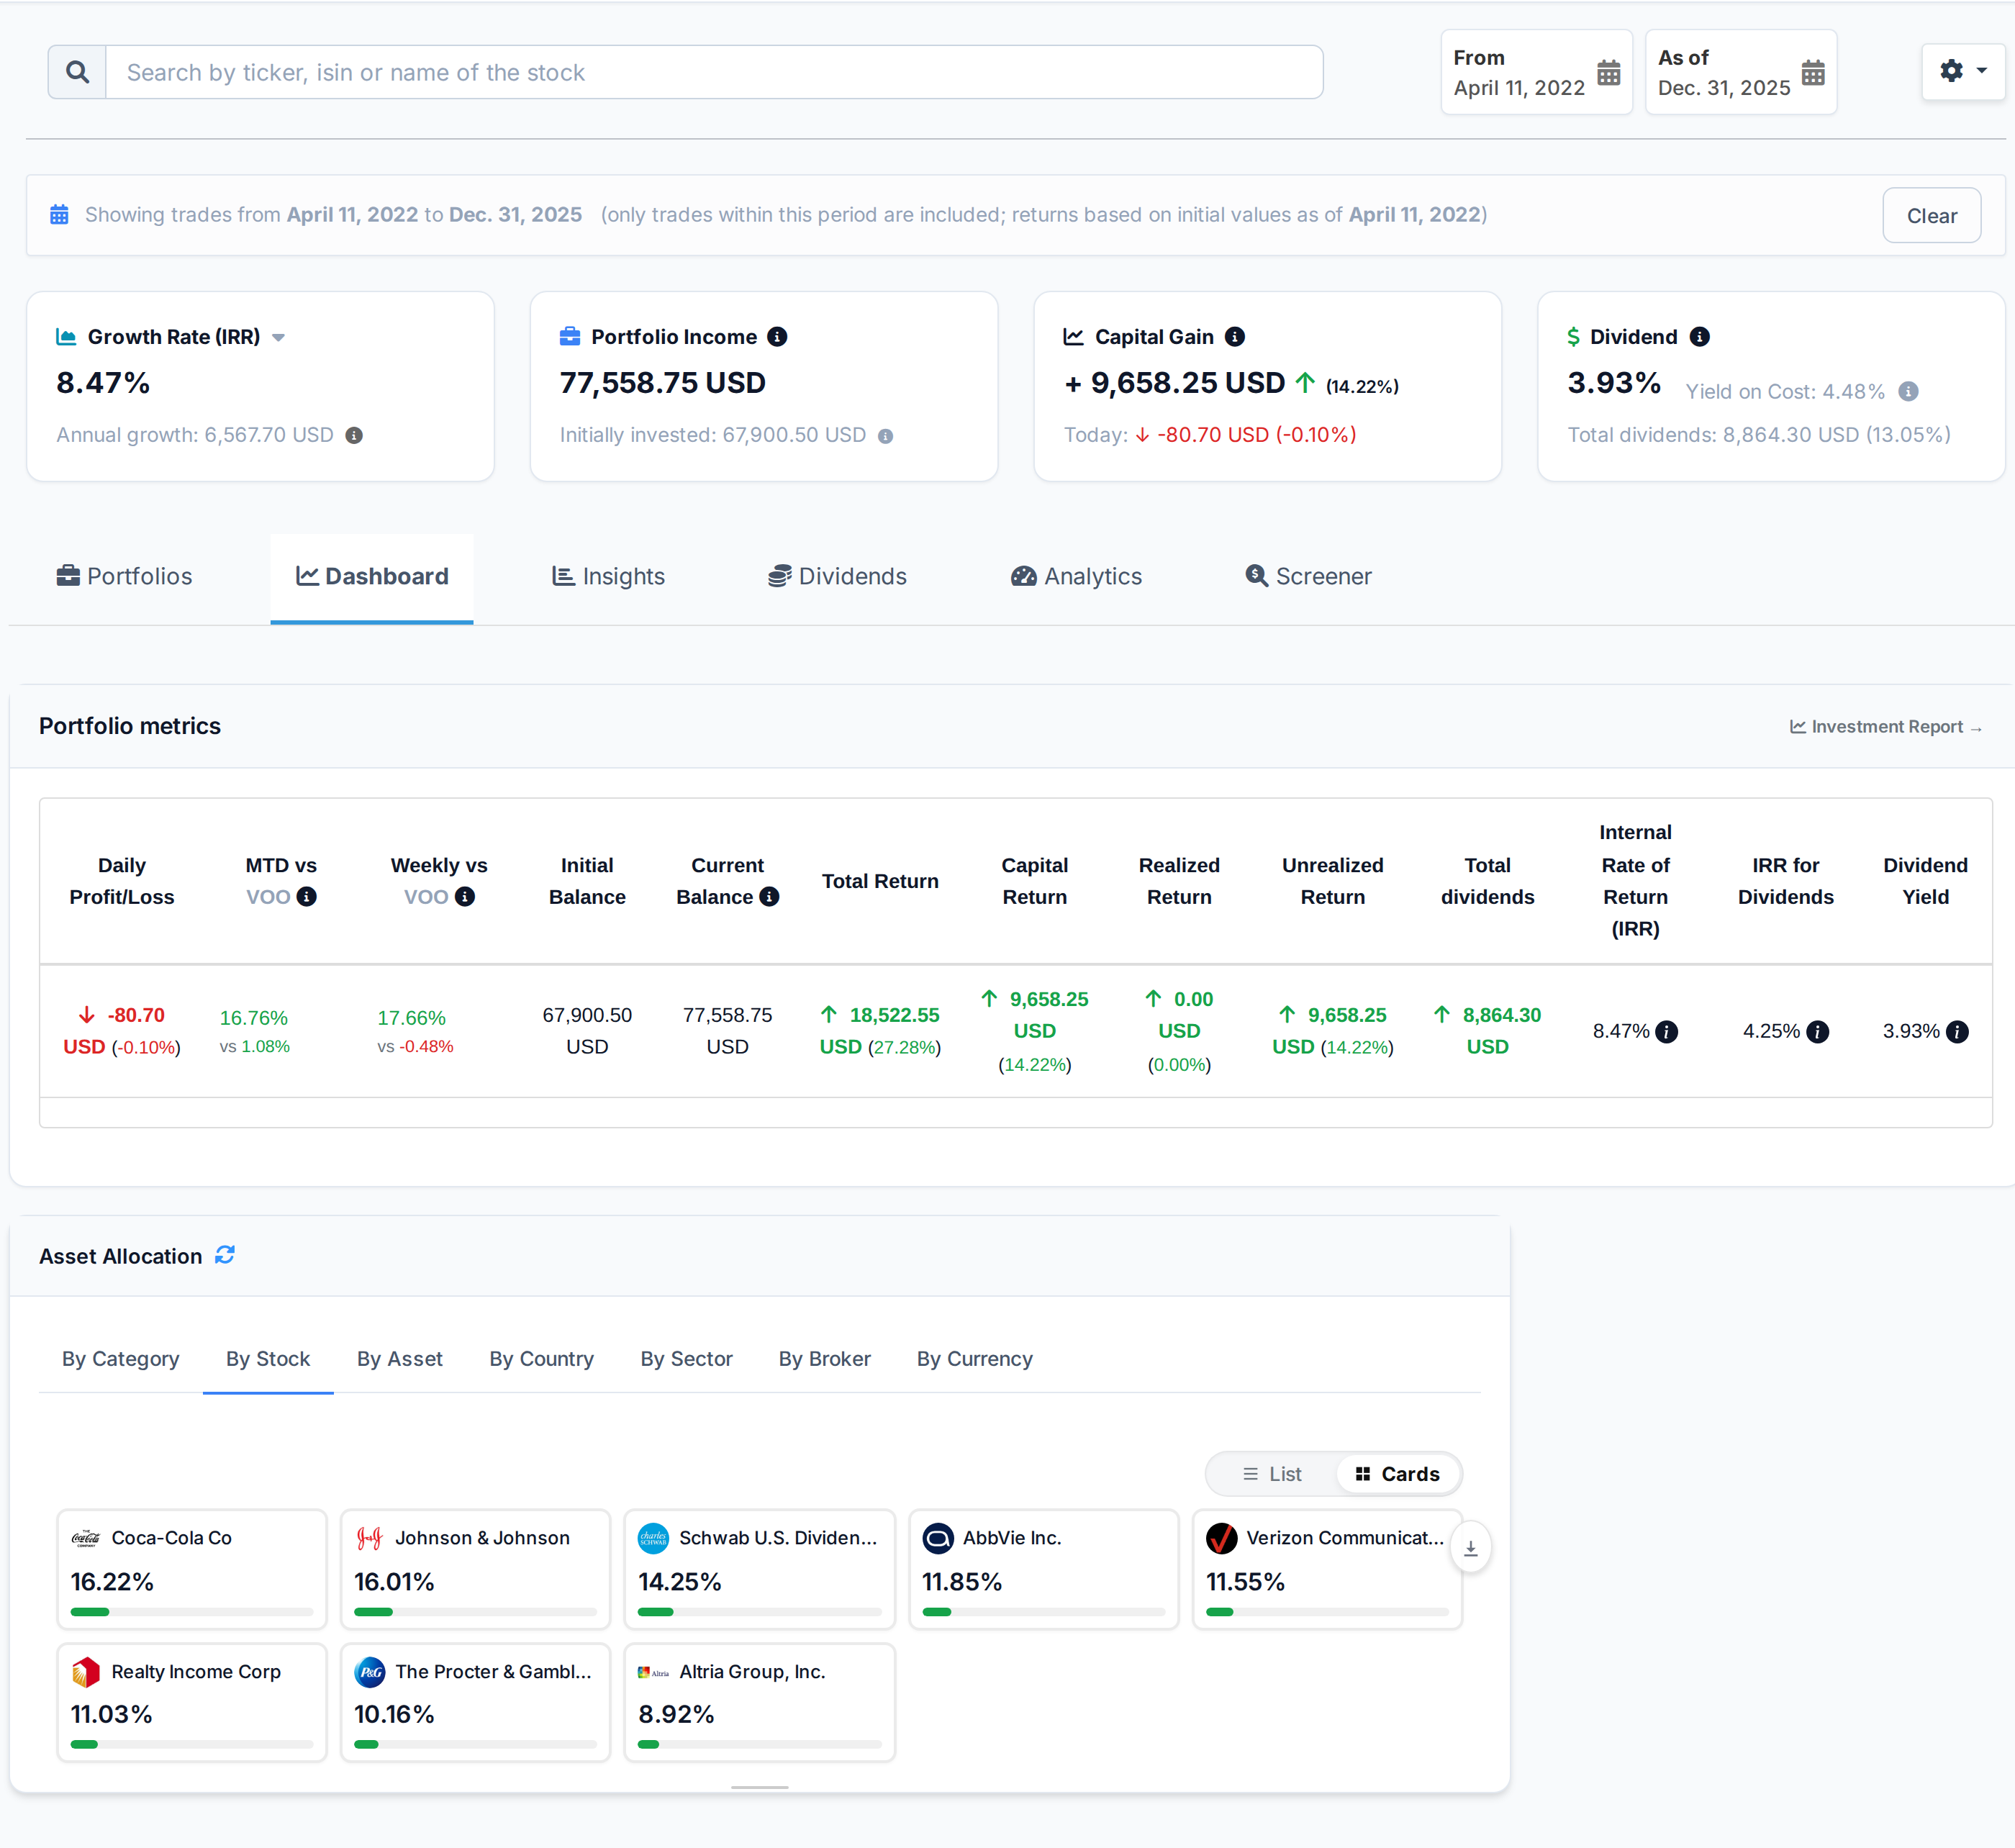
See your return between two dates
A Fidelity portfolio often grows for years through index funds and regular retirement contributions.
Set a start and end date. The screen shows capital gain, IRR and dividend yield for that period.
See period performance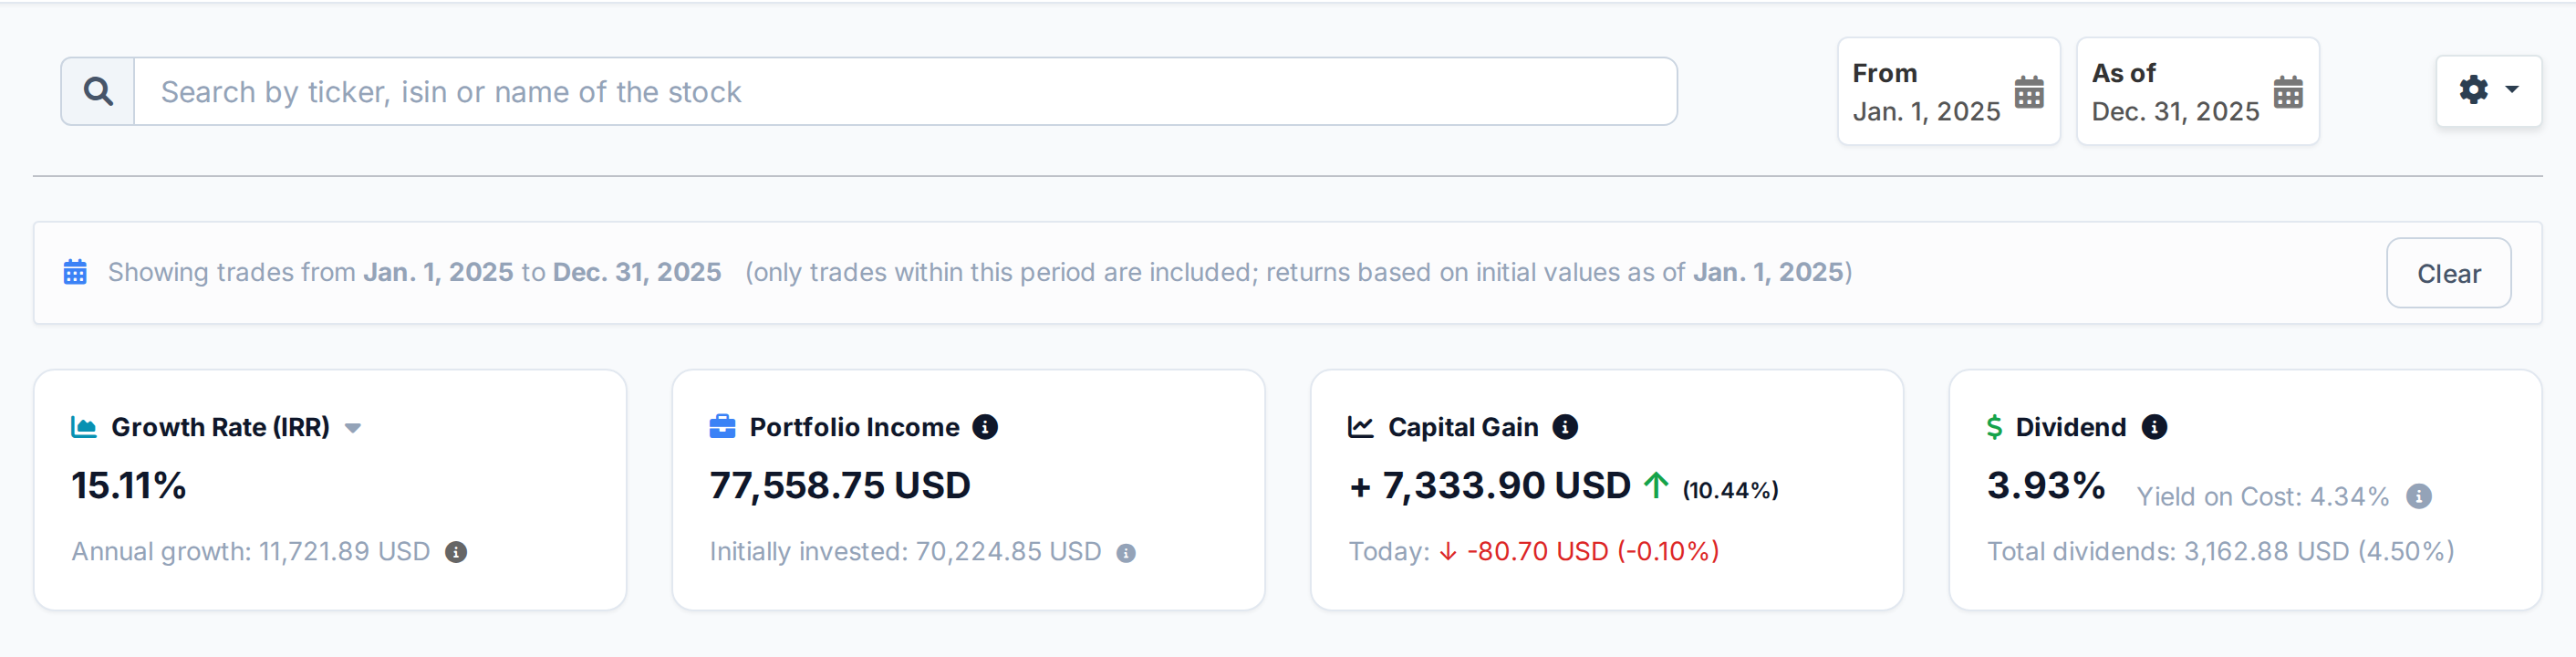 AllInvestView
Trace dividend income from payment to forecast
Fidelity investors who reinvest distributions can receive many small dividend payments over time.
The report totals gross, withheld and net dividend income. It also shows payment history by company and a 12-month forecast.
Open the dividend report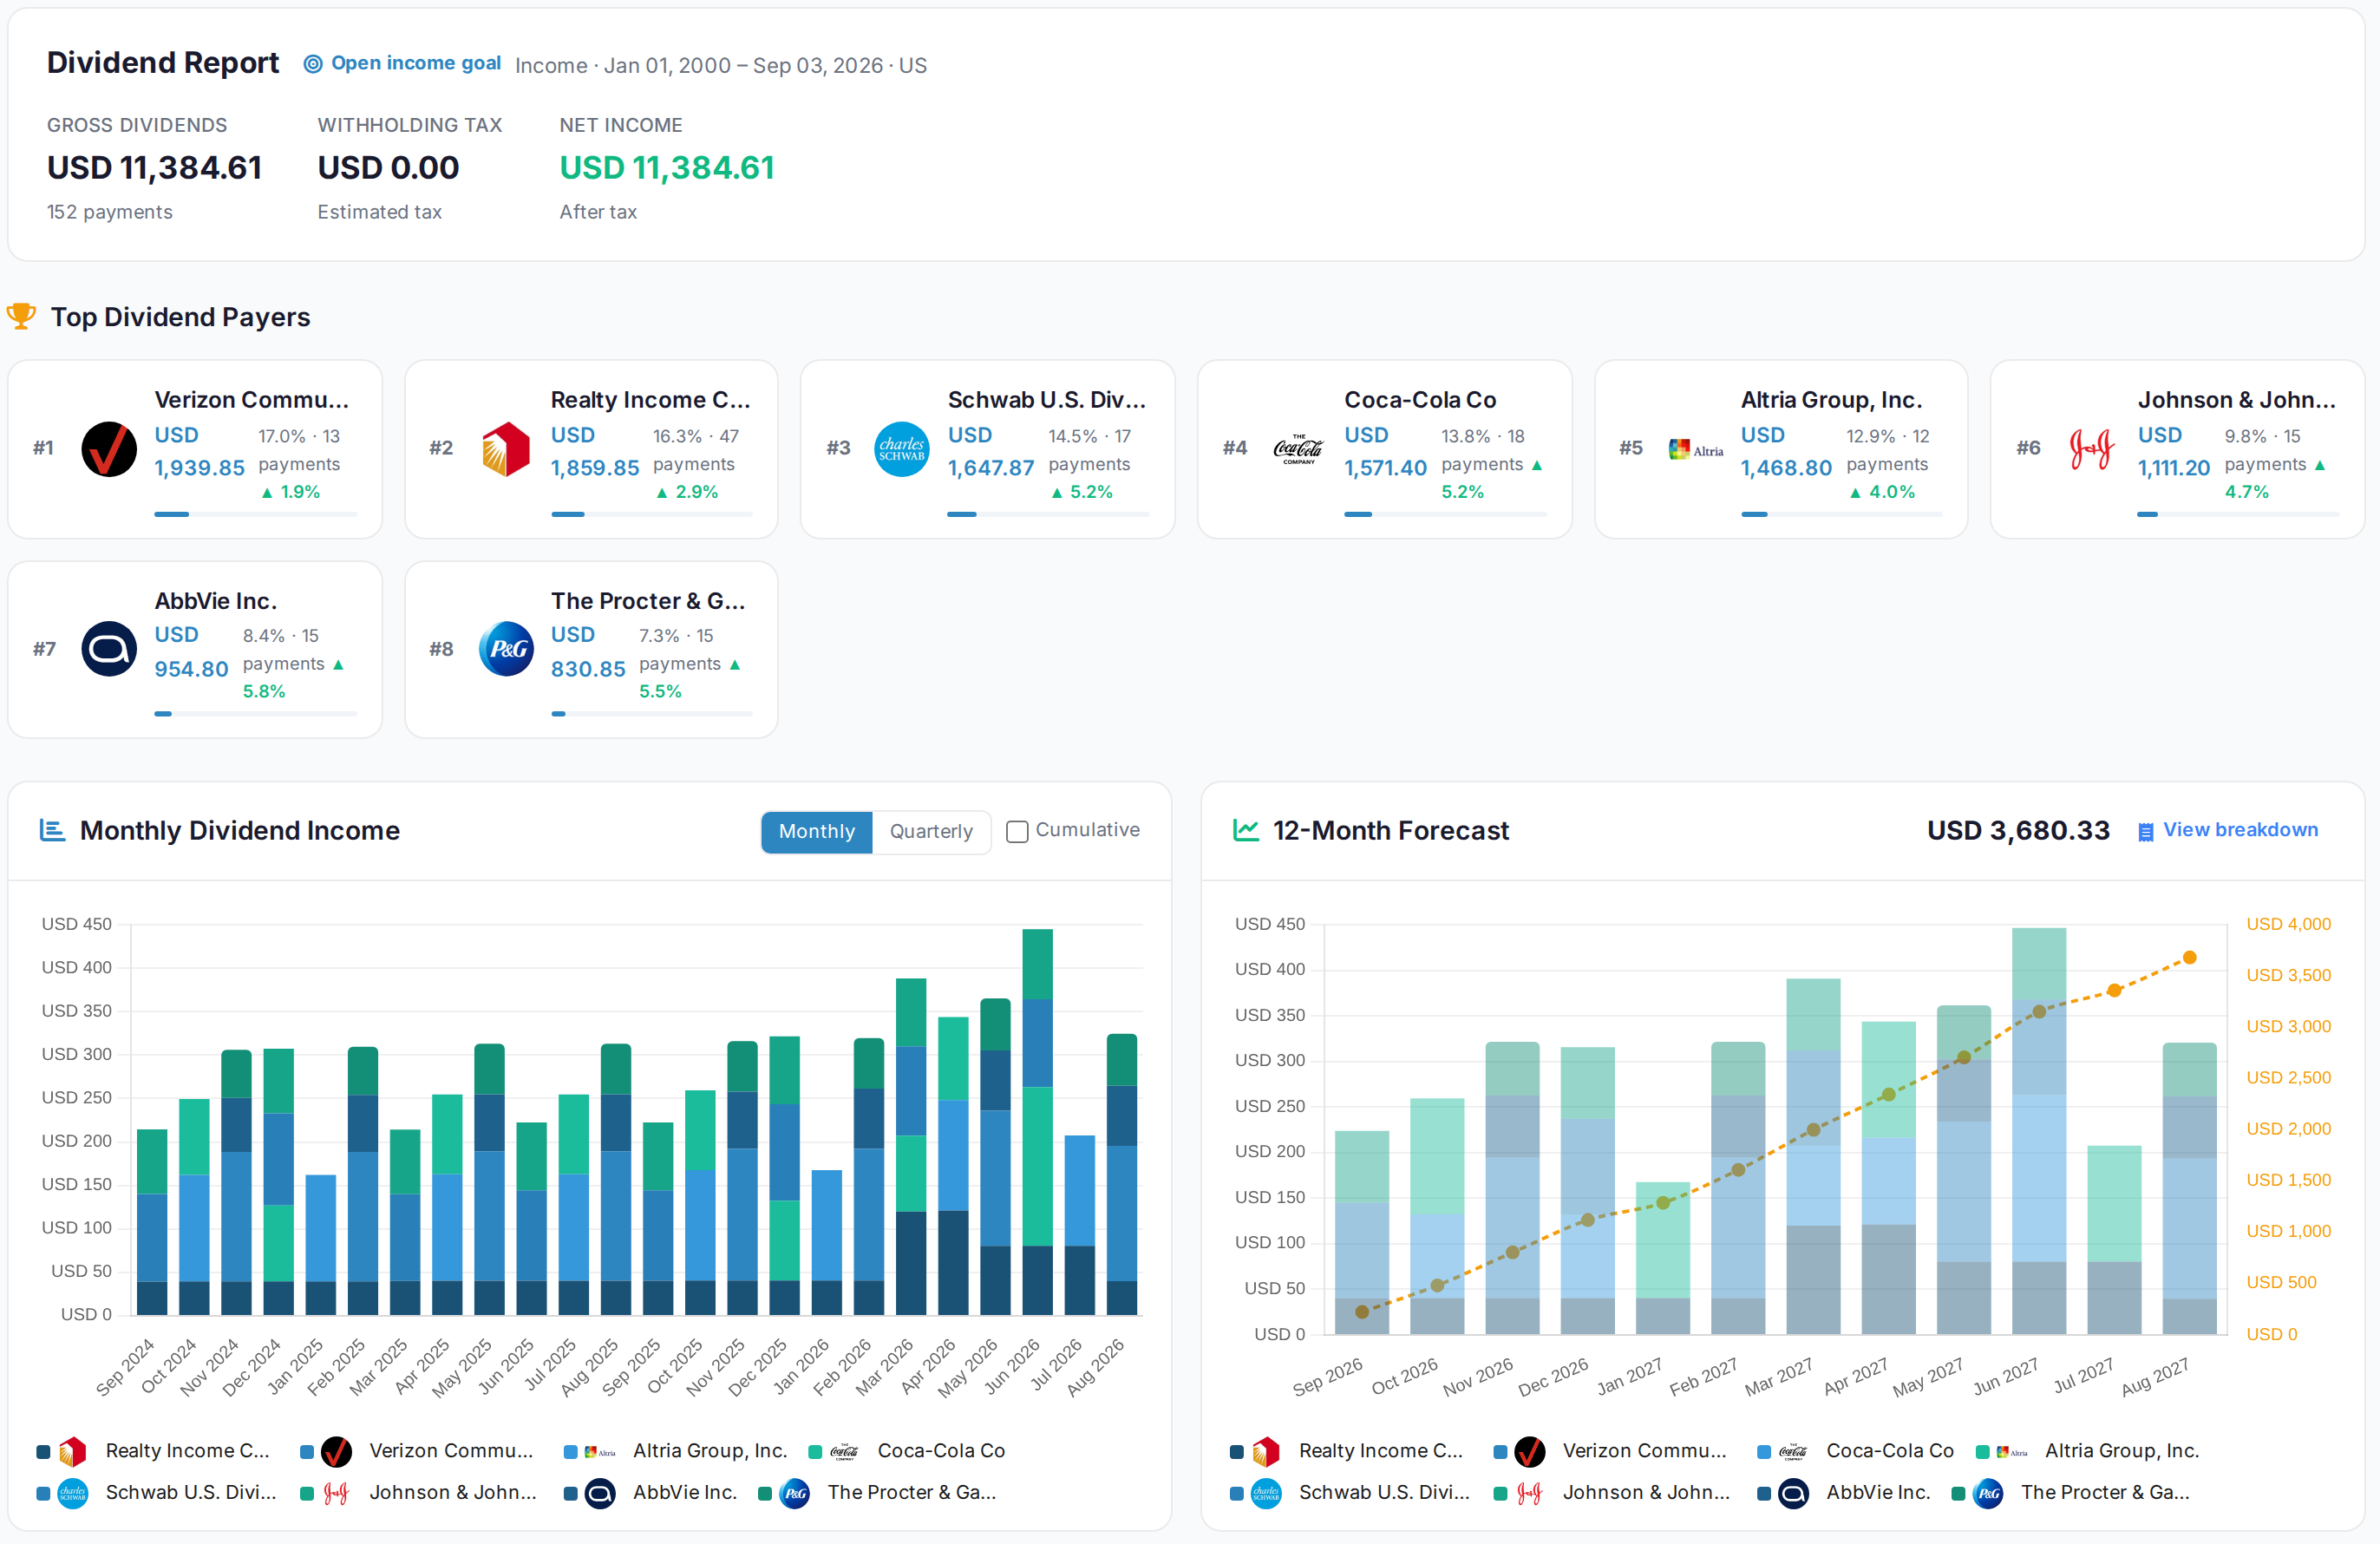 AllInvestView
See what sits inside your funds
Several Fidelity funds can own the same large companies without showing that overlap on the surface.
Portfolio X-Ray opens each fund and combines repeated underlying holdings. It shows overlap and concentration across the portfolio.
Open Portfolio X-Ray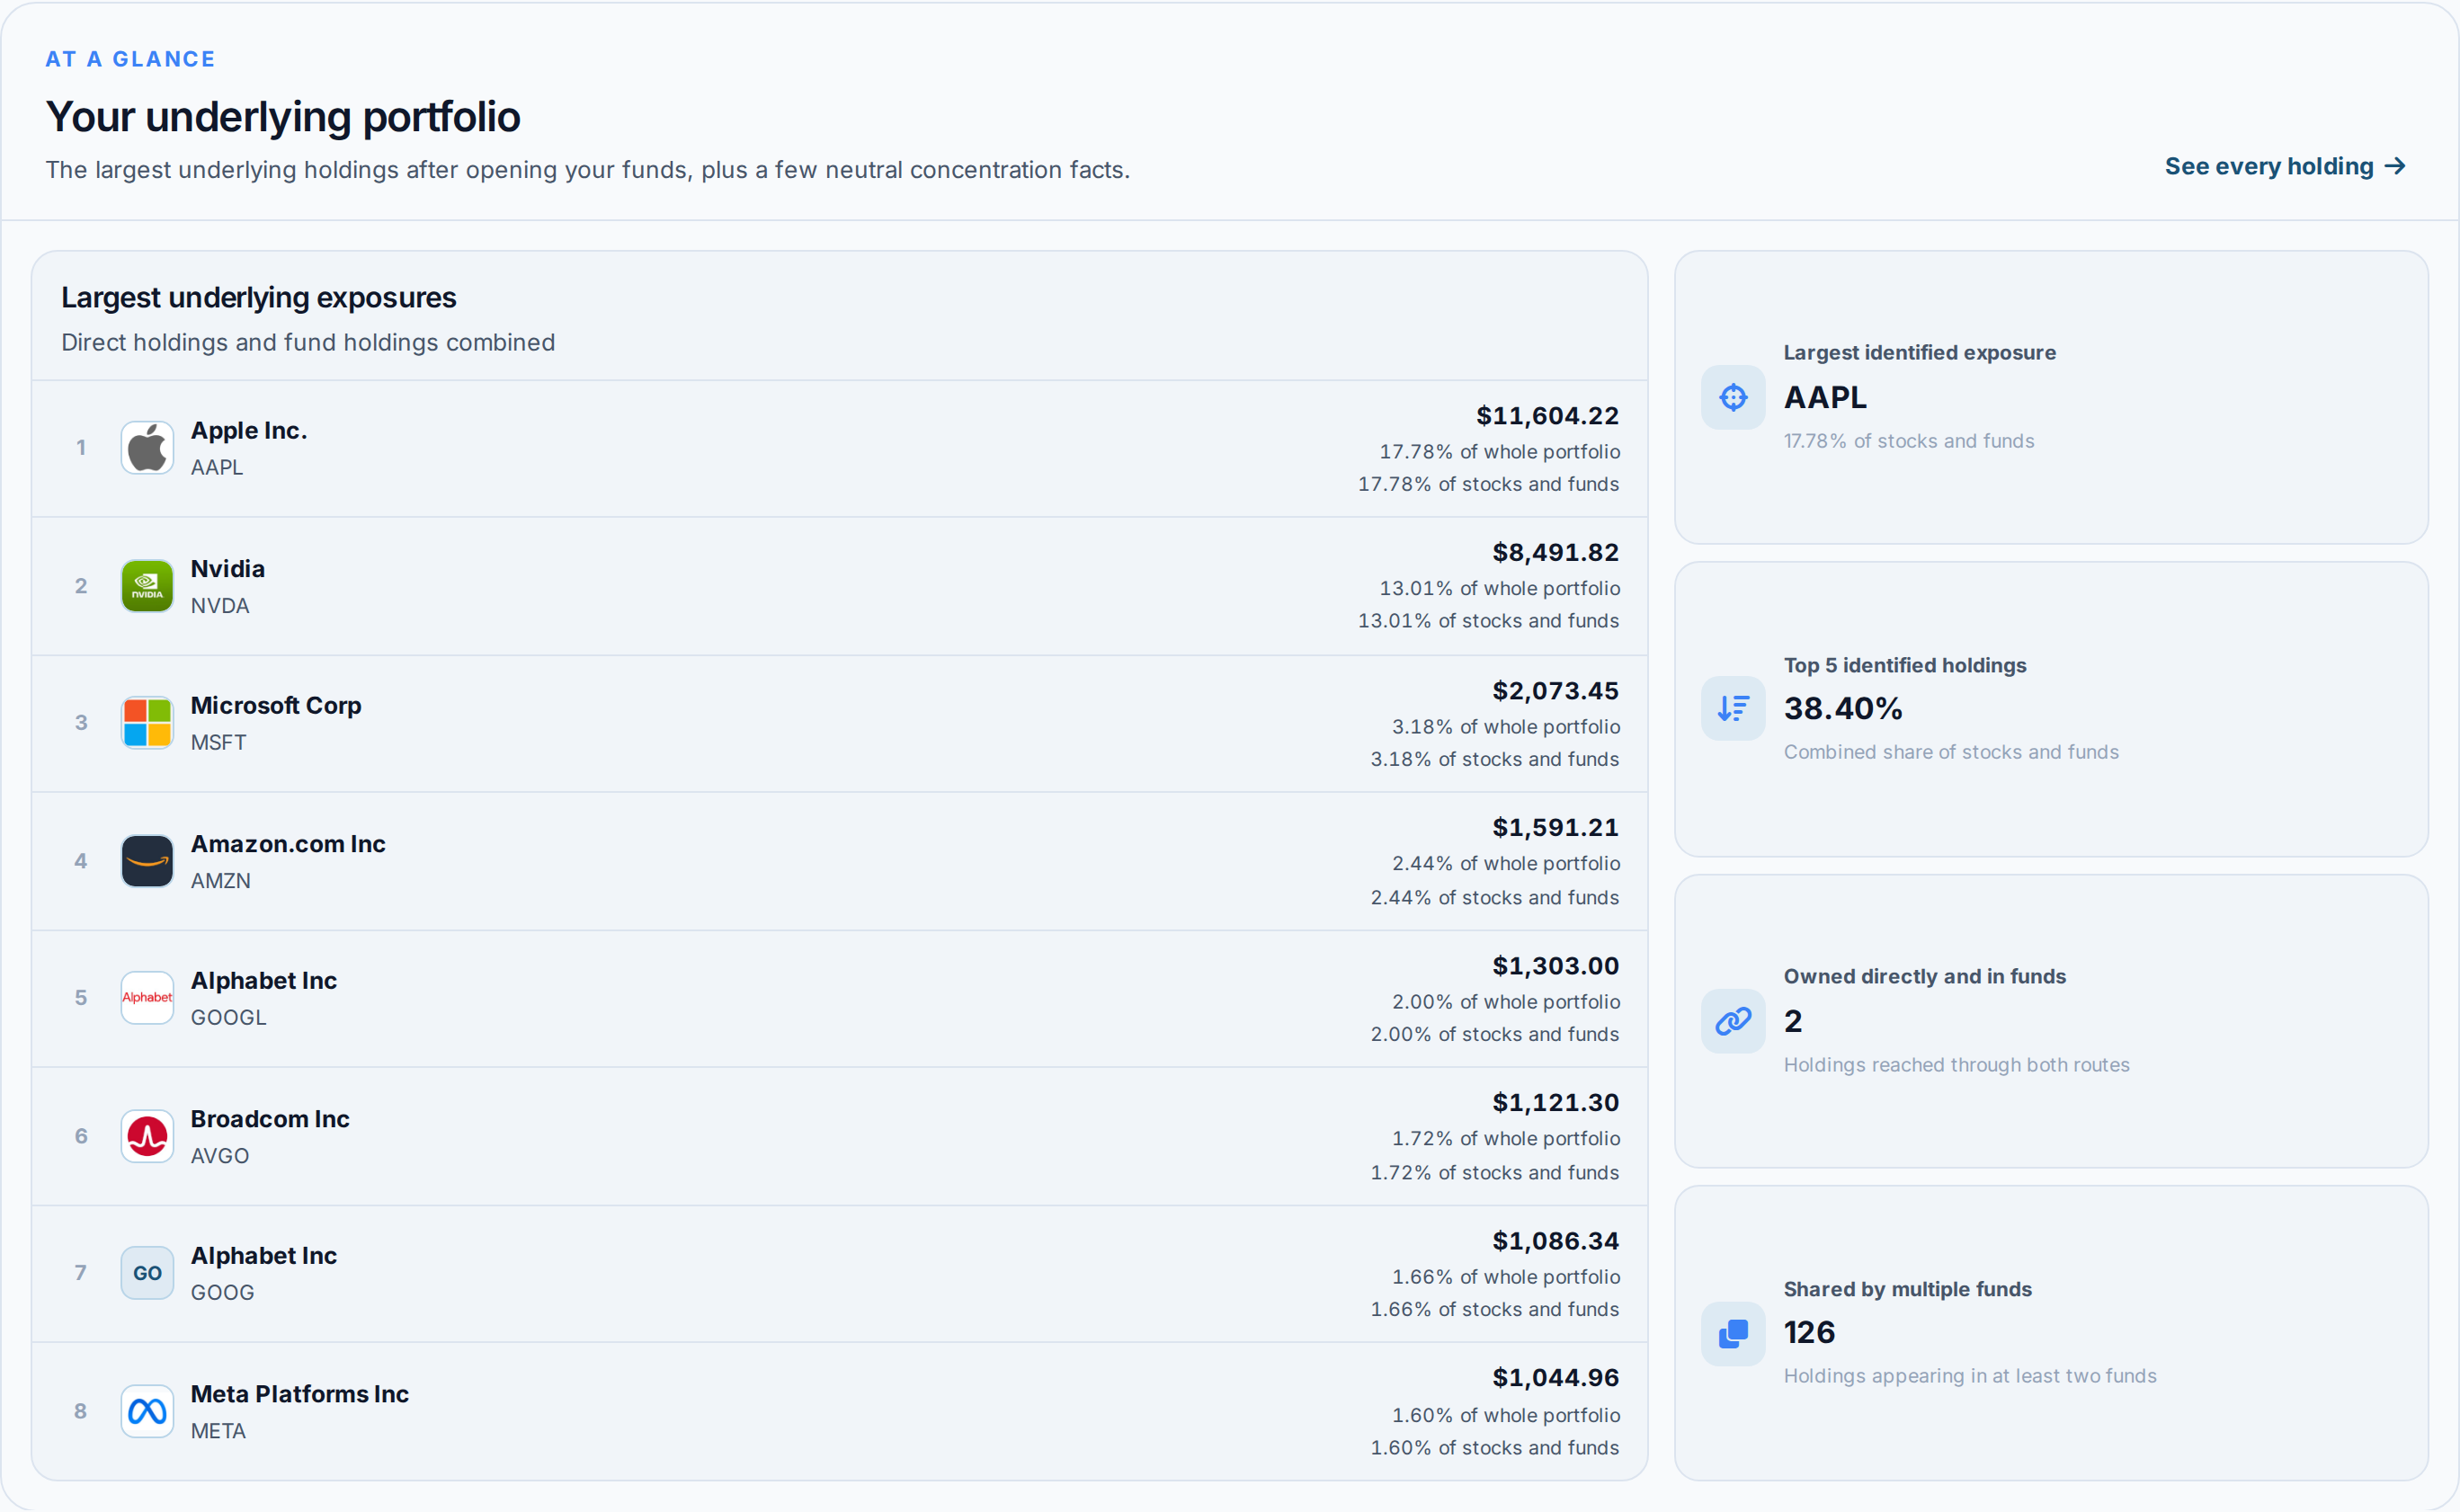 AllInvestView
What Fidelity gives you, and what is added here
| Area | Fidelity | With AllInvestView |
|---|---|---|
| Performance Analytics | The broker tools include Active Trader Pro with basic performance charts. | The dashboard calculates XIRR and return between chosen dates. |
| Tax Reporting | The broker tools include 1099-B and realized gain/loss reports. | The tax report supports FIFO, LIFO, HIFO and average cost. |
| Multi-Broker View | The broker tools include Fidelity Full View aggregates balances. | Accounts from several brokers can be viewed together. |
| Risk Analytics | The broker tools include Retirement planning with projections. | The risk view shows ratios, value at risk and simulations. |
| Dividend Tracking | The broker tools include Dividend history in account activity. | The dividend view shows the calendar, income and yield on cost. |
| Correlation Analysis | The account report does not calculate a holding correlation matrix. | The analysis includes a holding correlation matrix. |
| Bond Analytics | The broker tools include Bond screener with basic yield info. | The bond report shows yield, duration, convexity and accrued interest. |
| AI Analysis | The account tools focus on brokerage activity. | The assistant can read and explain the portfolio. |
For investors filing in the United States
Your Fidelity history turns into a capital gains report you can take to Schedule D.
Short term and long term split, so the two rates land where they belong
Wash sales flagged inside the 30 day window, across every account you hold here
FIFO, LIFO, HIFO and average cost, compared side by side before you sell
The 3,000 USD annual loss deduction applied the way the rules apply it
Getting your Fidelity history in
Export from Fidelity
In AllInvestView, open Sync Brokers and choose Fidelity. Complete the read-only connection.
Upload it
The importer reads the column layout on its own, identifies the securities and shows you every row before anything is saved.
Read your portfolio
Prices update daily, and dividends, corporate actions and splits are applied to the history you just brought in. Nothing else to keep up to date by hand.
About Fidelity
Fidelity and everywhere else you hold something
Most people end up with two or three accounts. Bring them all in and they add up to one portfolio, with one return and one tax report.
Often held alongside Fidelity
Every broker with a page here
 Trading 212
 Freetrade
 Revolut
 TradeStation Global
 Zerodha
Once your Fidelity history is in


Fidelity and AllInvestView, answered
See what your Fidelity portfolio has really done
Connect the account read only or upload the file. The return, the dividends and the tax figures are waiting on the other side.
Create a free account