It's what options cost, not what will happen
IV says how much movement buyers are paying for. Apple can move more or less than 25.2% implies, and IV says nothing about which direction.
Implied volatility (IV) is the volatility that makes an option-pricing model give back the price the option actually trades at. It's how the market prices movement, quoted as a yearly percentage. On 23 October 2026 Apple's 18 December $350 call was $13.35 bid, $13.65 ask. At the $13.50 midpoint that works out to an IV of 25.2%.
Scaled to the 56 days left, 25.2% is a move of about ±9.9%, or ±$34, from Apple's $347.73 close: roughly $313 to $382 by 18 December, one standard deviation either way. A higher IV means a dearer option. At 30% the same call would cost $16.13, at 20% just $10.70.
$347.73 × 25.15% × √(56 ÷ 365) = ±$34.26
$13.50 + $14.08 = $27.58 ≈ 0.8 × $34.26
+5 points = +$2.71 a share, $271 a contract
Every input to an option's price is known except one: how much the stock will move before expiry. The market price fills in that blank, and IV is what it fills it with.
IV says how much movement buyers are paying for. Apple can move more or less than 25.2% implies, and IV says nothing about which direction.
25.2% a year is 9.9% over 56 days and about 1.6% over one trading day (25.2% ÷ √252). Twice the time is about 1.4 times the move, not twice.
Apple's December puts at $300 carry 31.3% and its $400 calls 22.3%. The 4 November options carry 31.4% because they include the earnings report.
The call is real, from the 23 October close. Slide IV up and down: the option's price moves with it, and so does the range of prices the model expects Apple to end in on 18 December.

The $350 put on the same date was $13.85 / $14.30, an IV of 25.6%. Calls and puts at one strike usually carry close to the same IV.
| Implied volatility | Call price | Expected move by 18 Dec | Apple range, ±1 sd |
|---|---|---|---|
| 15% | $7.99 | ±5.9% | $327 to $368 |
| 20% | $10.70 | ±7.8% | $320 to $375 |
| 25.2% market, 23 Oct | $13.50 | ±9.9% | $313 to $382 |
| 30% | $16.13 | ±11.8% | $307 to $389 |
| 40% | $21.55 | ±15.7% | $293 to $402 |
| 50% | $26.96 | ±19.6% | $280 to $416 |
Near the money the price rises almost in a straight line with IV: about $2.71 a share for every 5 points. That's vega. An option holder can be right about the direction and still lose money if IV falls far enough, which is what happens after earnings.
Multiply the price by IV and by the square root of the time left as a fraction of a year. In the model, the stock ends inside that range about 68% of the time.
| Expiry | Days | IV at the money | Expected move |
|---|---|---|---|
| 30 Oct 2026 | 7 | 22.2% | ±3.1% ±$10.69 |
| 4 Nov 2026 after earnings | 12 | 31.4% | ±5.7% ±$19.80 |
| 20 Nov 2026 | 28 | 27.5% | ±7.6% ±$26.49 |
| 18 Dec 2026 the $350 call | 56 | 25.2% | ±9.9% ±$34.26 |
| 19 Mar 2027 | 147 | 26.3% | ±16.7% ±$58.04 |
| 17 Sep 2027 | 329 | 27.4% | ±26.0% ±$90.46 |
IV at the money is the average of the call and put closest to Apple's price ($347.50 where listed, otherwise $350); for December, the $350 call from the example. All solved from the 23 October midpoints.
Across 5,196 eight-week stretches from January 2006, Apple ended inside today's ±9.85% only 56.2% of the time, not 68%. Two reasons: Apple swung more than 25% a year in its earlier years, and it rose a lot, so the misses lean up. The expected move is a fair price for movement today, not a band history has to respect.
Apple reports after the close on Monday 2 November. Options expiring before the report don't carry it; every expiry after it does. That one day shows up as a jump in IV.
Each point is the average IV of the call and put nearest Apple's price for that expiry, solved from the 23 October midpoints.
Five more days nearly double the price, because they include the report. Taking the 30 October volatility out of the 4 November options leaves the report itself priced at about ±4.0%, one standard deviation.
The median next-day move since February 2018 was 3.3%, and 14 of the 35 went further than 4.0%. The last eight averaged 2.5%, but the most recent, in July 2026, was a 7.4% drop.
A model, not quotes: the 2 November IV holds the report's ±4.0% inside four days to expiry, and after the report IV drops back to the 22.2% of the 30 October options. Without that drop, a flat day would cost $173.
Per straddle of one call and one put, 100 shares each. The gap between the two lines is the crush: about $557 of the $730 lost if Apple doesn't move.
That's IV crush. The volatility that was paying for the report has nothing left to pay for once the news is out, so options lose value even when the stock moves. Here the straddle needed a 3.8% fall or a 3.5% rise just to break even, close to the ±4.0% already priced. Selling options into the report collects that premium and takes the risk of the one report that runs to 7% or 10%. A straddle or strangle is the pure version of the bet; a calendar spread sells the inflated front month against a later one.
If every strike carried the same IV, the line below would be flat. For Apple's December options it slopes down from the low strikes to the high ones, with a small curl at the far right.
Out-of-the-money contracts only, the ones that trade most, solved from the 23 October midpoints. Strikes $250 to $450.
Investors buy puts to insure shares, and stocks tend to fall faster than they rise. The $300 put, 14% below the price, carried 31.3%: 6 points more than the $350 call.
A protective put buys the expensive side. A collar pays for it with a call that carries less IV, which is why collars rarely come out free at matching distances.
In a bear put spread you sell a lower put with a higher IV than the one you buy. The debit spread guide shows an SPY one at 55% of the put alone for that reason.
An IV number alone doesn't say much. 25% is calm for Tesla and busy for a utility. Rank and percentile compare today's IV with the same option market's last year. The VIX, the 30-day implied volatility of S&P 500 options, makes a clean example.
Where today sits between the year's low and high.
(19.45 − 13.47) ÷ (31.05 − 13.47) = 34%The share of the year's days with a lower reading.
VIX was below 19.45 on 78% of the last 254 daysThe two disagree because one spike in March stretched the range. By rank the VIX is in the lower third of its year; by percentile it's higher than on most days. Rank reacts to the extremes, percentile to how the days are spread, so traders who sell premium when IV is "high" usually check both. For a single stock, use the IV of its own options, and remember that rank jumps every quarter before earnings and falls after.
Historical volatility (also called realized volatility) is the same yearly percentage measured from past daily moves. Implied is the price of future moves. Comparing them says whether options look rich or cheap against what the stock has been doing.
Apple's last month was quiet at 16.8%, but its last year ran at 24.1%, close to the 25.2% in December's options. The 4 November options sit higher because they include the report. A gap between implied and historical is normal; a big one usually has a reason on the calendar.
9,250 trading days from 2 January 1990 to 24 September 2026. 2026 runs to September.
of days since 1990 the VIX was above the volatility the S&P 500 then delivered over the next month, by 4.7 points at the median. That gap is the volatility risk premium: option buyers pay for insurance, so implied usually runs above realized. It isn't free money for sellers. In 2008 realized averaged 35.6 against a VIX of 32.7, and the worst months for sellers come in clusters.
High IV makes options expensive to buy and well paid to sell; low IV the reverse. It doesn't decide the trade on its own, but it tilts which side of it you want.
| When IV is | Tends to suit | Why |
|---|---|---|
| High against its own past | Covered calls, cash-secured puts, credit spreads, iron condors | You collect more premium for the same strikes, and a drop in IV works in your favour. |
| Low against its own past | Long calls and puts, LEAPS | Options are cheaper to buy, and a rise in IV adds to the value of what you hold. |
| High before a known event | Calendar spreads, straddles if you expect a bigger move than priced | The front month carries the event; it loses that IV the morning after. |
31.4% before earnings says Apple is expected to move, not which way. Puts and calls at the same strike carry almost the same IV.
In the model above, Apple can rise 3% the day after the report and the straddle still loses $172. The move has to come close to what the IV already priced just to break even.
Compare with the same stock's IV rank or percentile, or with its historical volatility. 30% is low for Tesla and very high for a bond fund.
One standard deviation leaves about a third of outcomes outside it in the model, and Apple went beyond December's range in 43.8% of past 8-week stretches.
The VIX was above what followed on 85.3% of days, but the worst misses come before crashes: in February 2020 it sat near 14 and the next month ran above 80. Size short options for that month, not an average one.
IV matters most on the trades you already hold. AllInvestView keeps every option you own together with your shares, ETFs and bonds, and shows what earnings and a volatility change could do to each position.
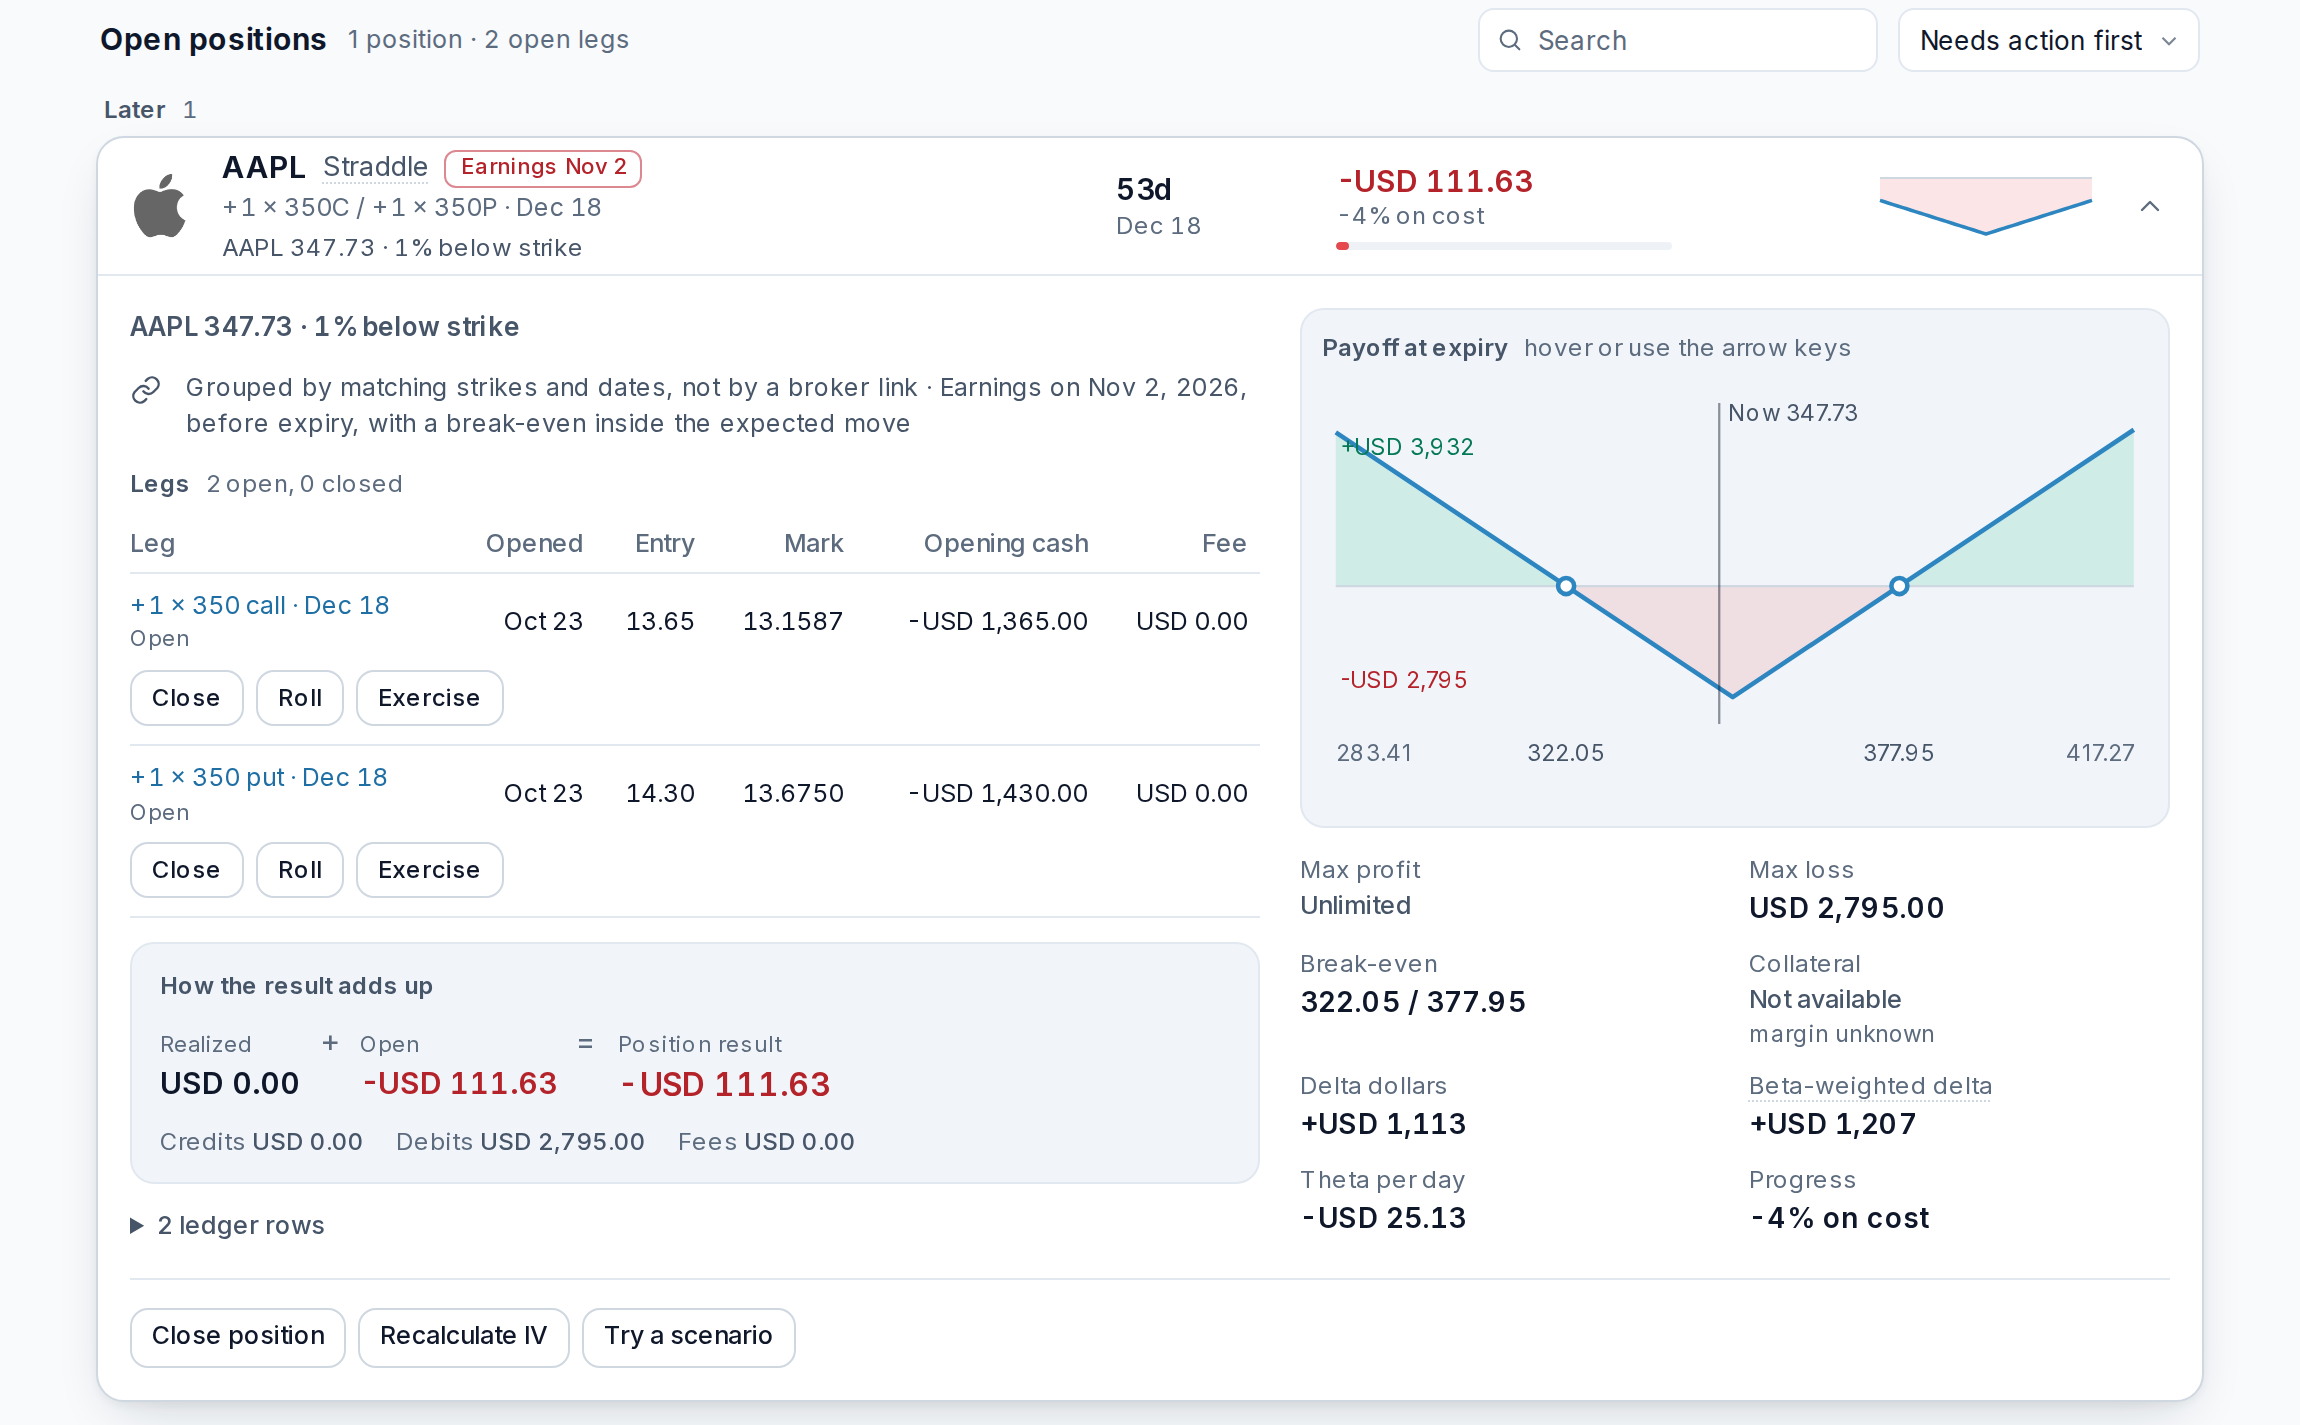
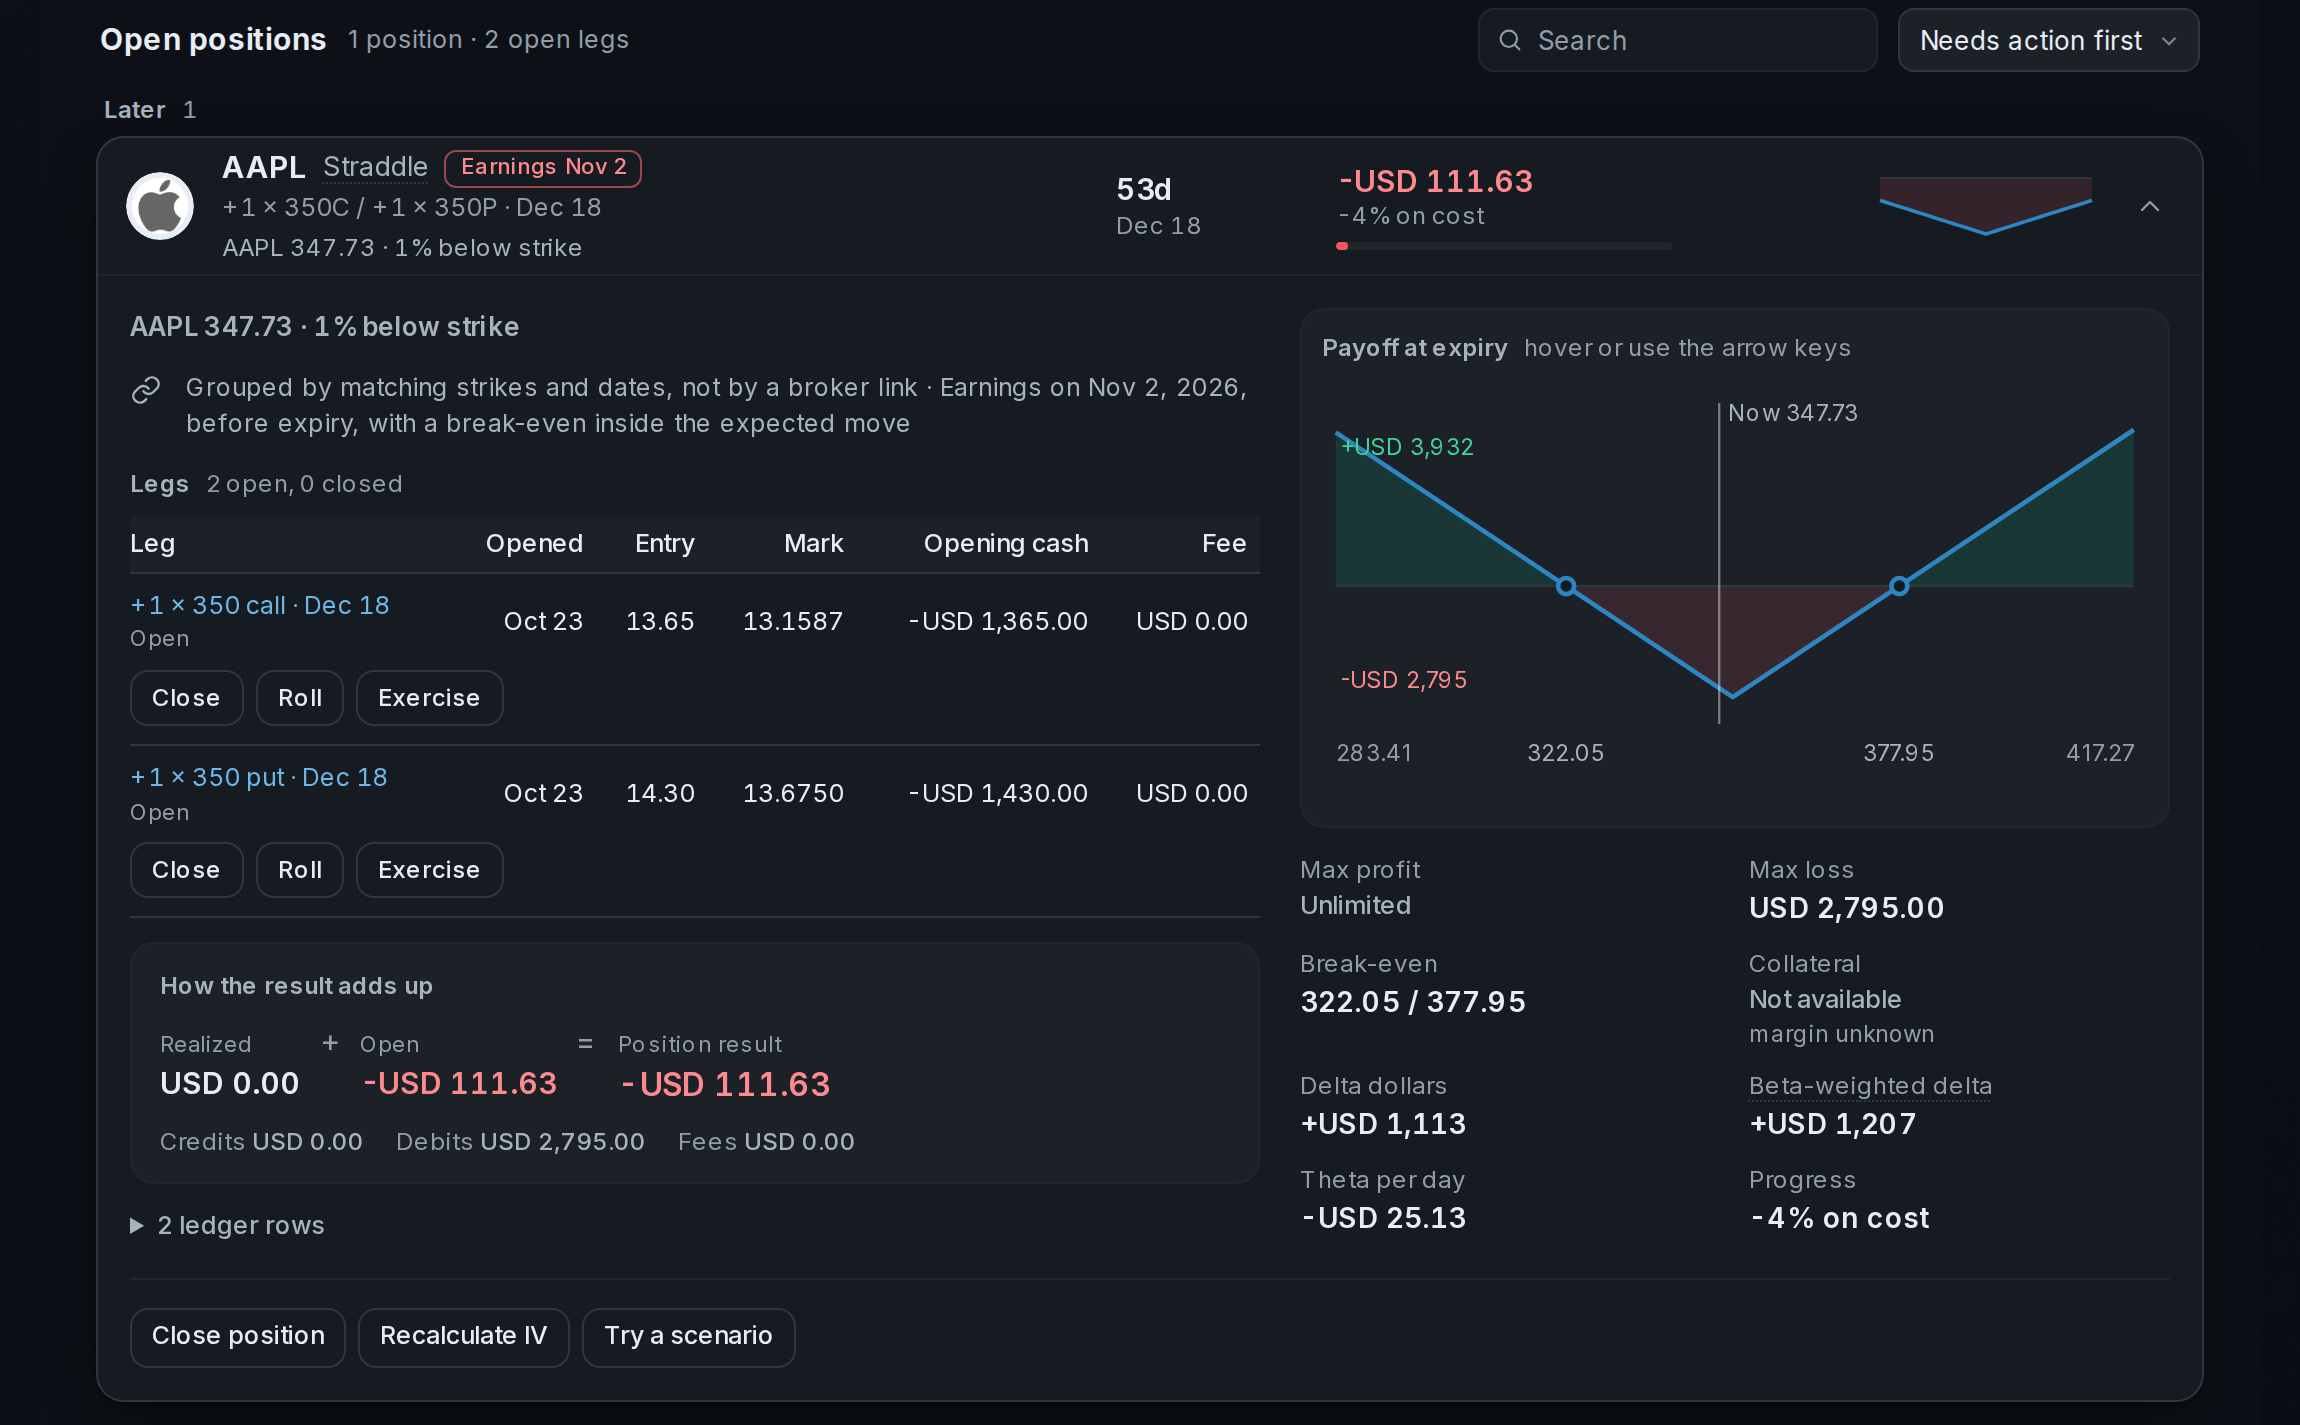
Each open position shows its days to expiry, Greeks and what it's worth now, with breakevens and the payoff at expiry when its legs share one date. When earnings fall before expiry and a breakeven sits inside the expected move, the row says so, like the Apple straddle here ahead of the 2 November report.
 AllInvestView
 AllInvestView
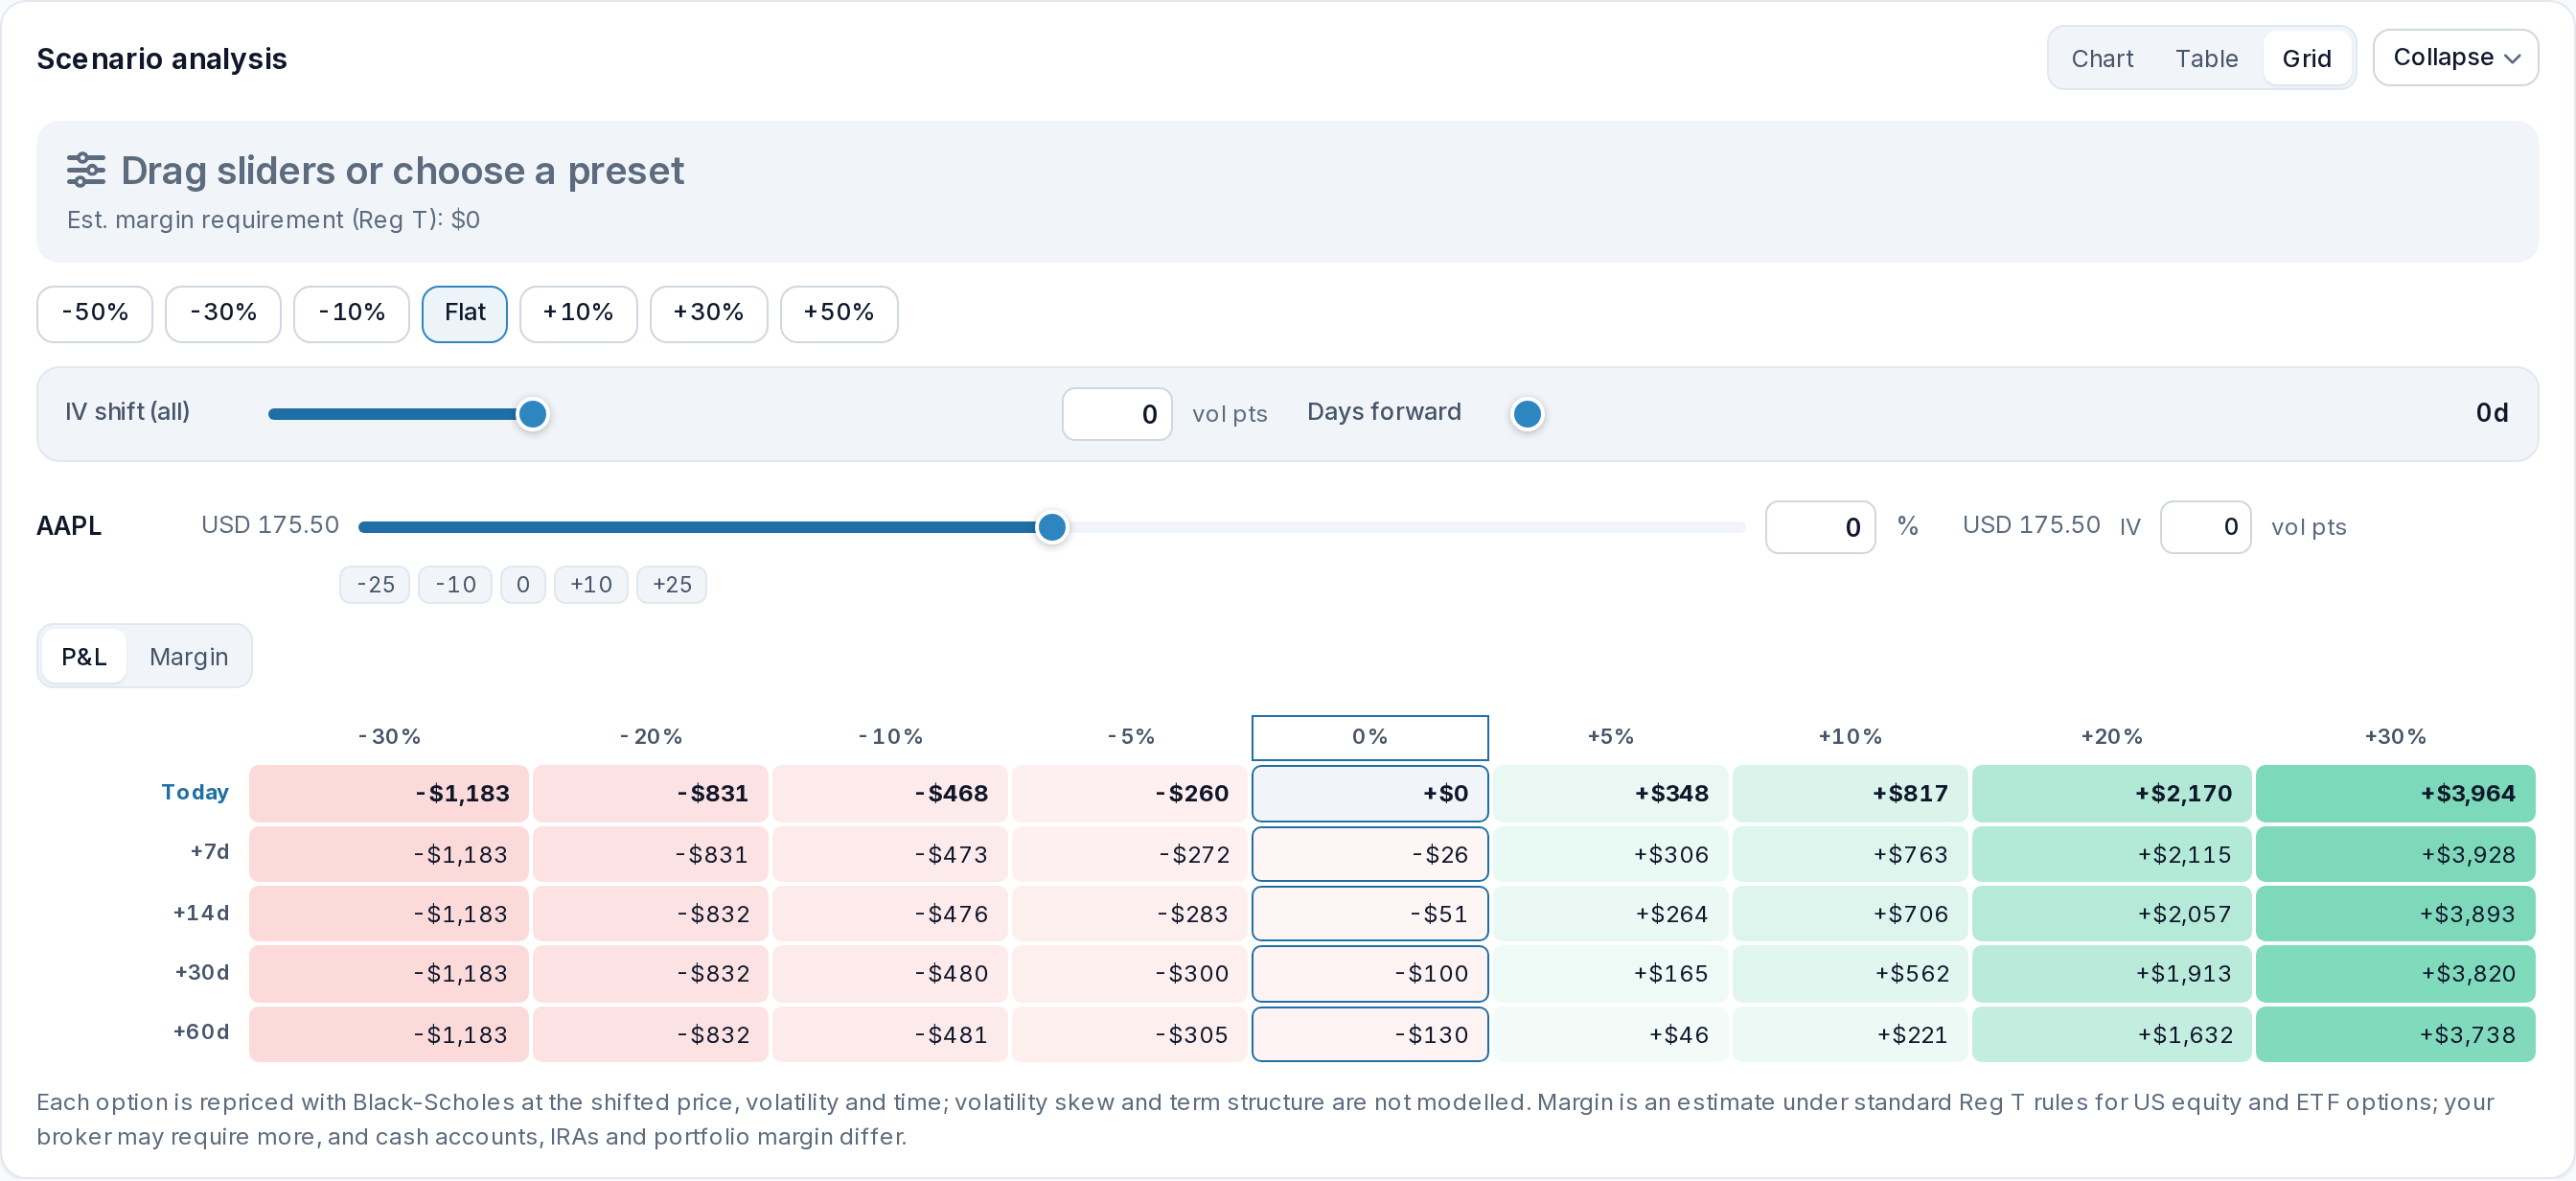
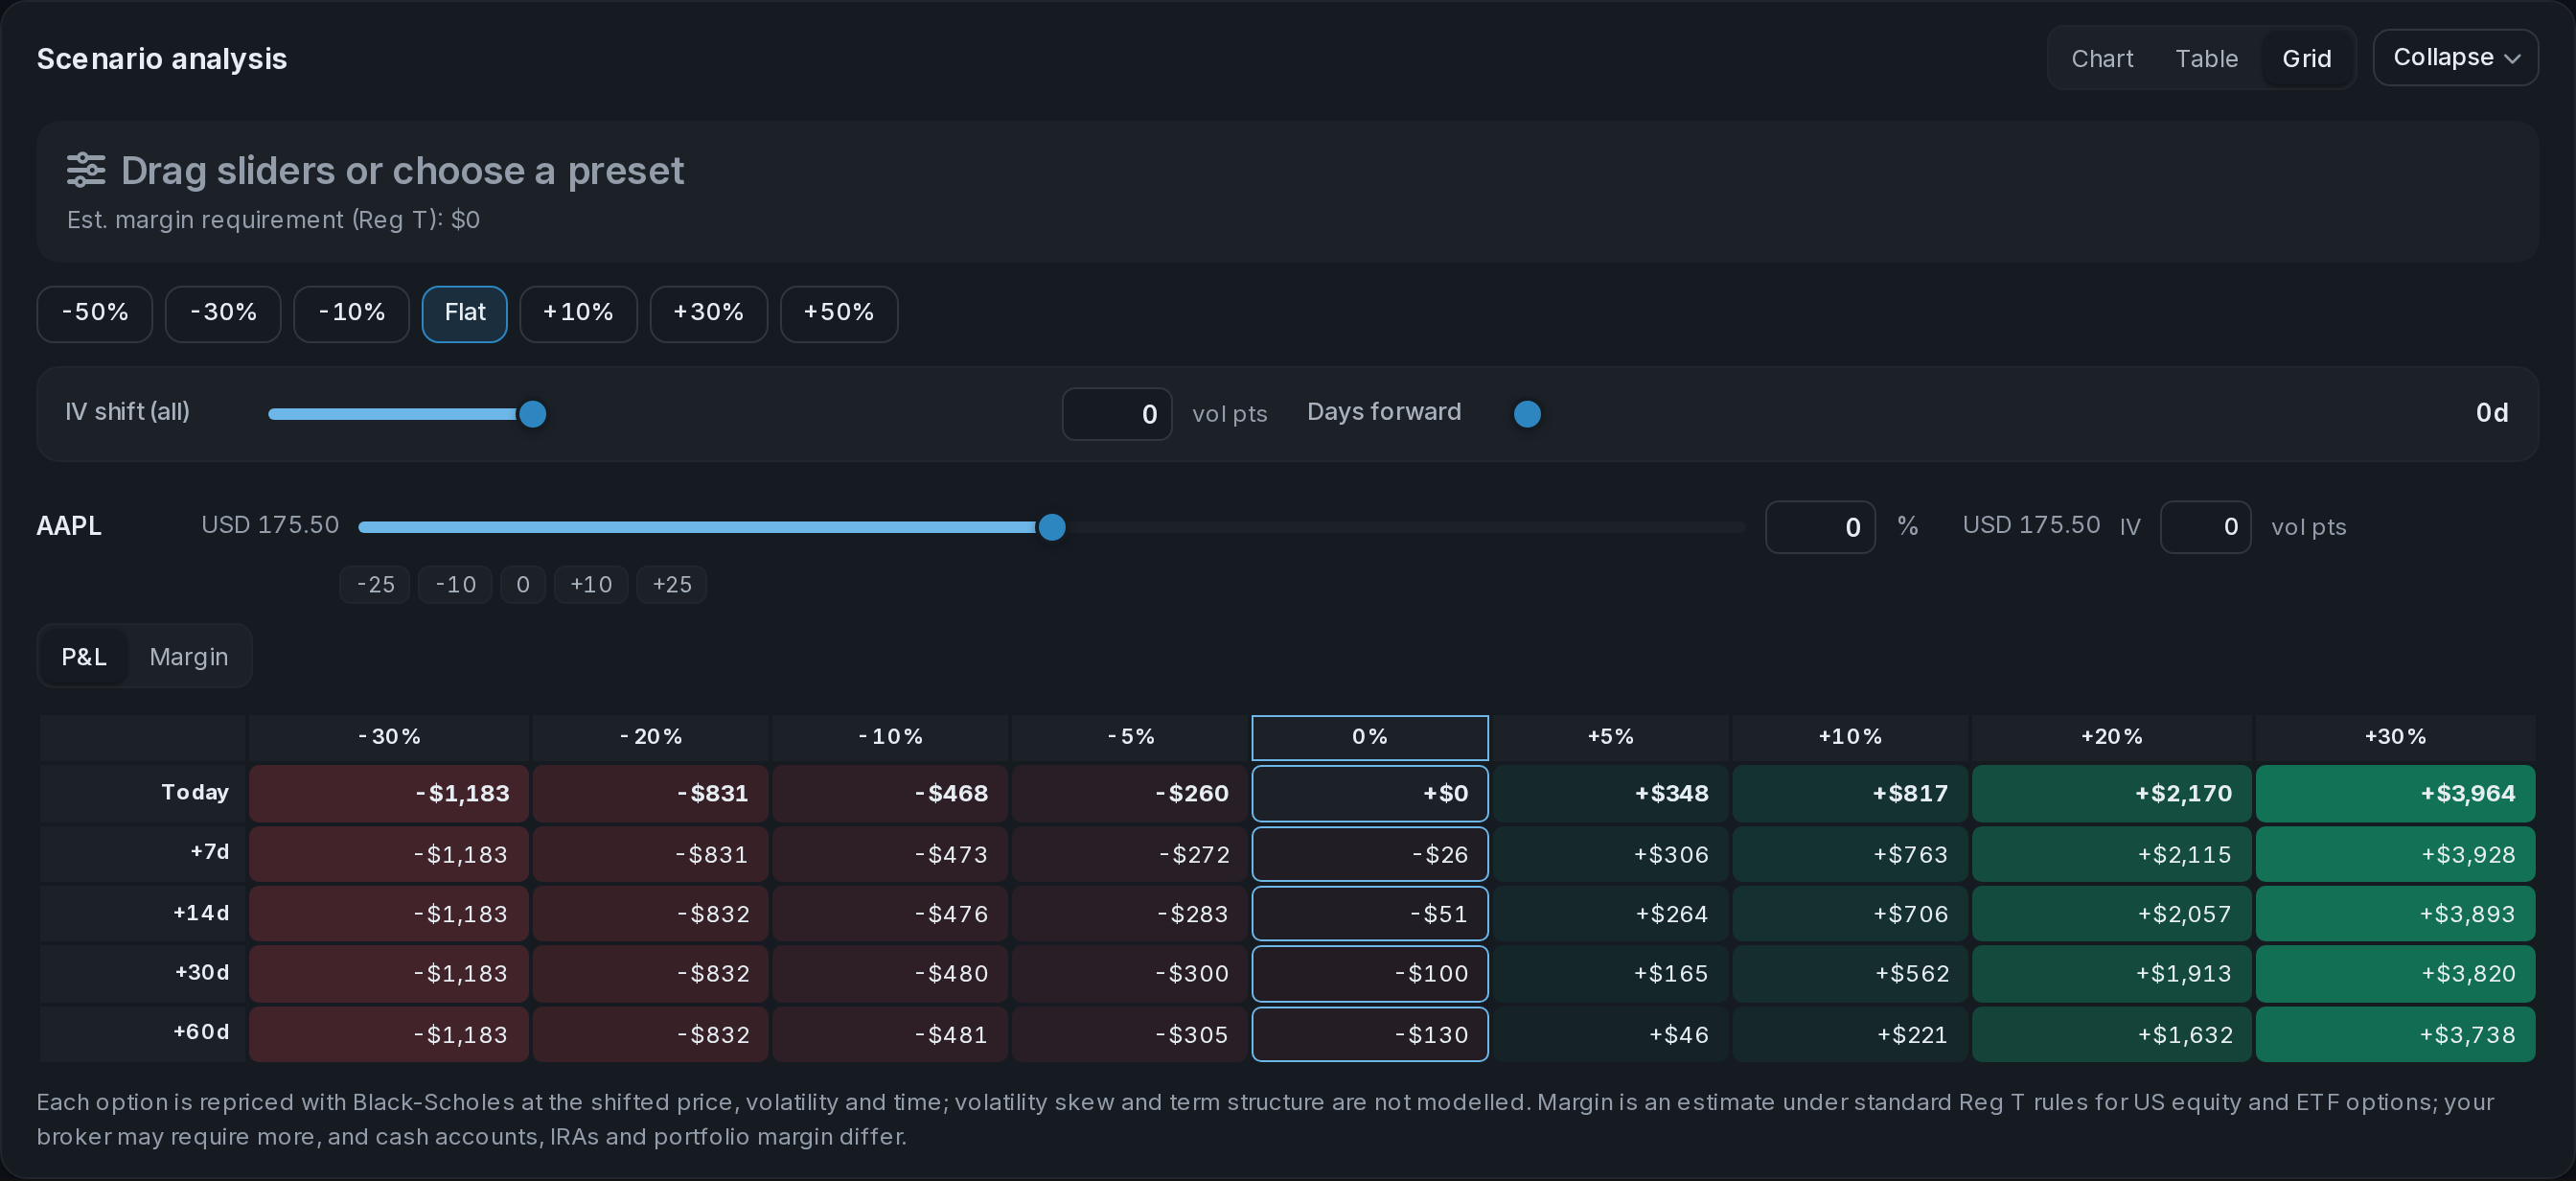
Drag IV down by 10 points across the whole book, or for one stock, move the price and the days forward, and read the profit or loss of every position in one grid. The Strategy Builder runs the same scenario on a trade before you place it.
Options, shares, ETFs, bonds and dividends on one dashboard, synced from your brokers or imported from a file, with earnings flags, Greeks and scenarios on every open option.
It's the volatility that makes an option-pricing model give back the option's market price, so it's how much movement the market is paying for, quoted per year. On 23 October 2026 Apple's 18 December $350 call traded at $13.50 at the midpoint, an implied volatility of 25.2%.
Neither. High IV makes options expensive, which suits sellers of covered calls, cash-secured puts and credit spreads and hurts buyers. Low IV makes options cheap, which suits buyers. What matters is IV against the same stock's own past and against what you expect it to do.
Multiply the stock price by IV and by the square root of the days to expiry divided by 365. Apple at $347.73 with 25.15% IV and 56 days left gives $347.73 × 0.2515 × √(56 ÷ 365) = ±$34.26, about ±9.9%. In the model the stock ends inside that range about 68% of the time.
It's the drop in implied volatility after an event the market was waiting for, usually earnings. Apple's options expiring 4 November, just after its 2 November report, carried 31.4% IV against 22.2% for 30 October. Once the report is out that extra volatility goes, and options lose value even if the stock moves a little.
IV rank places today's IV between the year's low and high: (current − low) ÷ (high − low). IV percentile is the share of the year's days with lower IV. On 23 October 2026 the VIX was 19.45 against a one-year range of 13.47 to 31.05, an IV rank of 34, but it was higher than on 78% of the year's days.
Historical volatility measures how much the stock actually moved, from past daily returns. Implied volatility is the price of future moves, read from options. Since 1990 the VIX has been above the S&P 500's volatility over the following month on 85.3% of days. That gap is what option sellers are paid for, and it reverses hard before crashes.
There's no single good number, because each stock has its own normal. Apple's options sat around 25% in October 2026 and its last year's historical volatility was 24.1%. Compare a stock's IV with its own history, its IV rank or percentile, and the dates on the calendar before calling it high or low.
No. IV prices the size of a move, not its direction. Calls and puts at the same strike and expiry carry almost the same IV: Apple's 18 December $350 call was at 25.2% and the $350 put at 25.6%.
Checked on 26 October 2026.
Implied volatilities, prices, Greeks and the earnings-night scenario come from AllInvestView's options pricing engine (Black-Scholes) with a 3.94% rate and Apple's $1.08 yearly dividend, each IV solved from the bid-ask midpoint. Expected moves are one standard deviation, price × IV × √(days ÷ 365). Historical volatility is the annualized standard deviation of daily log returns. Earnings moves compare the close on the report day with the next day's close. Nothing here is investment advice.