=B1-(B4+B3*(B2-B4))B1 the investment's yearly return, B2 the benchmark's, B3 the beta, B4 the risk-free rate. Works the same in Excel and Google Sheets.
Alpha is the part of an investment's return that its market risk doesn't explain. Take the market's return, scale it by the investment's beta, count the risk-free rate, and you have the return it should have earned. Alpha is what it actually earned above or below that. Positive alpha beat that expected return; negative alpha fell short.
Over the ten years to September 2026, ARK Innovation returned 15.85% a year and SPY, the S&P 500 fund, 15.23%. ARK moved 1.79 times as much as the market, so it should have earned 25.40% a year. Its alpha was −9.56% a year. Invesco QQQ's was +3.99%.
The bracket is the expected return for the investment's beta. The simple version, return minus the market's return, leaves beta out.
 Invesco QQQ
 The market (SPY)
 ARK Innovation
Each logo is a fund or stock, placed by its beta against SPY (across) and its yearly return (up), October 2016 to September 2026. The line starts at the risk-free rate, 2.43% a year on 3-month Treasury bills, and runs through SPY: it's the return each beta should have earned. Alpha is how far above or below the line each one ended up.
ProShares Ultra S&P500 holds twice the index and returned 23.48% a year, far more than SPY. With a beta of 2.04 the line puts it at 28.52%, so its alpha was −5.04%. Leverage doubles the swings as well as the gains, and big swings cost more once returns compound. Coca-Cola returned less than SPY, but with a beta of 0.47 it beat its line by 2.27% a year.
Enter four numbers you already have, or paste an investment's returns and the benchmark's and get the beta and the alpha together. It opens with ARK Innovation from the chart above.
Berkshire Hathaway B against SPY, over the ten years from October 2016 to September 2026, with dividends counted for SPY. Four numbers go in.
SPY's return=B1-(B4+B3*(B2-B4))B1 the investment's yearly return, B2 the benchmark's, B3 the beta, B4 the risk-free rate. Works the same in Excel and Google Sheets.
=SLOPE(C2:C121, D2:D121)The investment's returns in column C, the benchmark's in column D, same months. The investment's column goes first.
=PRODUCT(1+C2:C121)^(12/COUNT(C2:C121))-1Returns as decimals. In Google Sheets wrap it in ARRAYFORMULA; older Excel needs Ctrl+Shift+Enter.
Beta is the risk you took with the market. Alpha is what you got beyond what that risk should pay. ARK Innovation over ten years has a striking number on each side.
A beta of 1 moves with the market, 2 about twice as much. It sets where the line puts an investment: more beta should earn more over time, because it means bigger falls along the way. Beta is the slope of its returns against the market's.
1.79ARK moved about 1.8% for each 1% SPY movedAlpha is the return left over once beta has been paid for, in percentage points a year. It's the closest single number to a manager's skill, after fees. You can't get alpha by taking more beta: that only moves you along the line.
−9.56%a year below the 25.40% its beta pointed to| Measure | The question it answers | ARK Innovation against SPY, 2016 to 2026 |
|---|---|---|
| Alpha | How much did it earn beyond what its beta explains? | −9.56% a year |
| Beta | How much does it move when the market moves? | 1.79 |
| Excess return | Did it beat the benchmark, before any adjustment for risk? | +0.61 points a year: 15.85% against 15.23% |
| R-squared | How much of its movement does the benchmark explain? | 51.6%: about half of it |
| Sharpe ratio | How much return above cash for each unit of total volatility? | 0.35, against 0.84 for SPY |
| Treynor ratio | How much return above cash for each unit of beta? | 7.48%, against 12.80% for SPY |
| Information ratio | How much excess return for each unit of tracking error? | 0.02: almost nothing for 29.3% a year of tracking error |
Many sites call any return above the benchmark "alpha". Jensen's alpha first takes beta out. For these four the two answers point in opposite directions, ten years to September 2026, against SPY.

Twice the market's risk should have paid much more. Leverage is beta you can buy, not alpha.
Level with SPY after ten years, with a 77.1% fall on the way and far more risk taken.
Behind SPY, with a lot less market risk. For the risk it took, it did better than the market.

About half the market's beta, so it only needed 8.46% a year. It made 10.74%.
Bars on a scale of −10 to +10 percentage points a year. Excess return is the yearly return minus SPY's, before rounding.
Well-known index, factor and actively managed funds, all against SPY, October 2016 to September 2026. Returns are after each fund's fees, with dividends and distributions reinvested.





Low-volatility and dividend funds sit below the line because their stocks lagged the S&P 500's tech giants, not because they took too much risk. Leveraged and concentrated funds sit far below it because their risk didn't pay. Only one active fund here beat its line, by 2.45% a year.
Michael Jensen introduced this measure in 1968 and tested 115 mutual funds over 1945 to 1964. After expenses, 76 had a negative alpha and 39 a positive one, and the average was about −1.1% a year. Half a century on, most funds still fall short.
Mutual funds at their net asset value, before any sales charge; Growth Fund of America is the A share. These are funds that still exist today, which flatters active funds as a group: the ones that closed after poor years aren't here.
Fund sites often report alpha the way Jensen first measured it: the intercept of a regression of the fund's returns above T-bills on the market's, here on monthly returns, times 12. This page and AllInvestView put the compounded yearly returns straight into the formula. Same funds, same ten years:
| Fund or stock | Formula alphacompounded yearly returns | Regression alphamonthly intercept × 12 | Volatilitya year |
|---|---|---|---|
| QQQ | +3.99 | +3.78 | 19.0% |
| FCNTX | +2.45 | +2.33 | 16.6% |
| KO | +2.27 | +3.02 | 16.3% |
| BRK-B | +1.26 | +1.95 | 18.0% |
| SSO | −5.04 | −2.71 | 31.3% |
| ARKK | −9.56 | −3.82 | 38.3% |
Big swings cost more when returns compound. The yearly version is built on the returns you actually got, so it counts that cost; the regression averages months and mostly doesn't. That's why the most volatile funds, ARK and SSO, show the widest gaps. Compare alphas only when they were measured the same way.
Fund sites often measure a fund against its own category index, such as the Russell 1000 Growth for a growth fund. Against a different index, the same fund gets a different beta and a different alpha.
Three, five and ten years can tell different stories. ARK's ten-year alpha includes 2020's huge gain and the falls that followed; a three-year figure ending in 2021 would look nothing like it.
A higher rate lowers alpha for funds with a beta below 1 and raises it for funds above 1. T-bills averaged 2.43% over these ten years, but 3.94% in September 2026.
Any alpha above zero that lasts for years is good, because most funds don't manage it. These bands use the ten-year figures on this page.
Below 0: the risk didn't payWhere most actively managed funds end up over ten years, once fees are paid.ARKK −9.56SSO −5.04DODGX −2.68
About 0: an index fundIt earns what its beta says, minus a small fee. That's the job.VOO +0.06IVV +0.05SPY 0.00
0 to 2% a year: goodA real edge kept up for a decade. Small numbers add up: 1.26% a year is about 12% more money after ten years.BRK-B +1.26
Above 2% a year: rareFew funds keep this up over ten years. Check R-squared and the benchmark before you believe it.FCNTX +2.45
ARK Innovation's alpha in each calendar year, with its ten-year beta of 1.79 and that year's T-bill rate:
+120.1% in 2020, then −74.9% in 2021. A great year or two says very little about the next.

Gold (GLD) shows an alpha of +7.53% a year against SPY, with an R-squared of just 1.9%: gold barely moves with stocks, so the S&P 500 is the wrong yardstick and the number means little. Coca-Cola's +2.27% comes with an R-squared of 19.6%, Fidelity Contrafund's +2.45% with 88.0%. The higher it is, the more the alpha tells you.
QQQ's +3.99% against SPY is the Nasdaq-100 beating the S&P 500, not anyone picking stocks: QQQ simply follows its own index. VTI's −0.85% is smaller US companies lagging the largest. Measure a fund against the index that matches what it buys.



Over the same ten years NVIDIA's alpha was +37.65% a year, Apple's +11.98% and Microsoft's +11.19%. We picked them because we know today how they did. Alpha is a measure of the past, and it only counts as skill if it was there before you knew.
Your broker shows how the accounts you hold there did. AllInvestView puts every account you add together and works out your portfolio's Jensen's alpha, beta and excess return against the index you choose.
The Analytics tab works out your portfolio's Jensen's alpha from its daily returns against the index you choose, with the risk-free rate you set. Next to it: beta, correlation, R-squared, tracking error, information ratio and Treynor ratio. It covers every account you add, so a fund at one broker and your stocks at another come out as one alpha.
See the portfolio analyzer AllInvestView
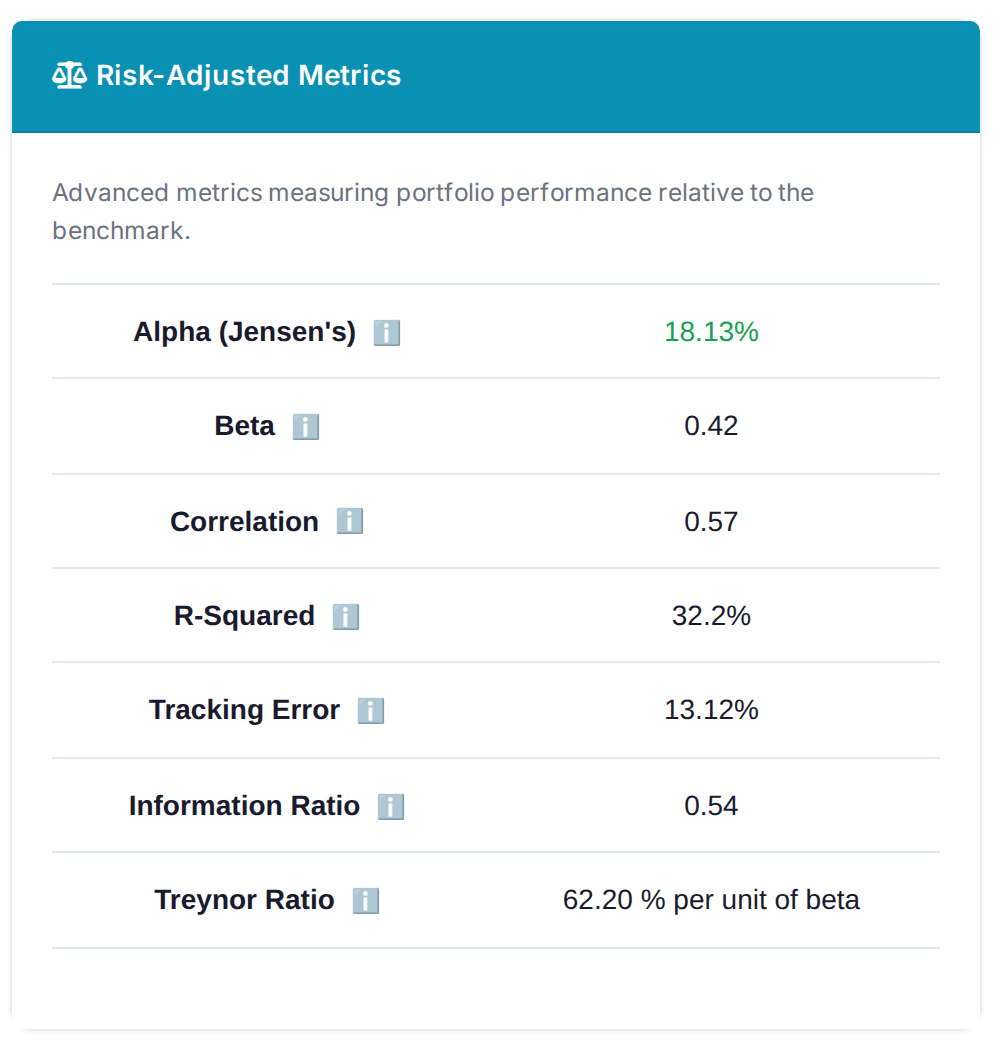
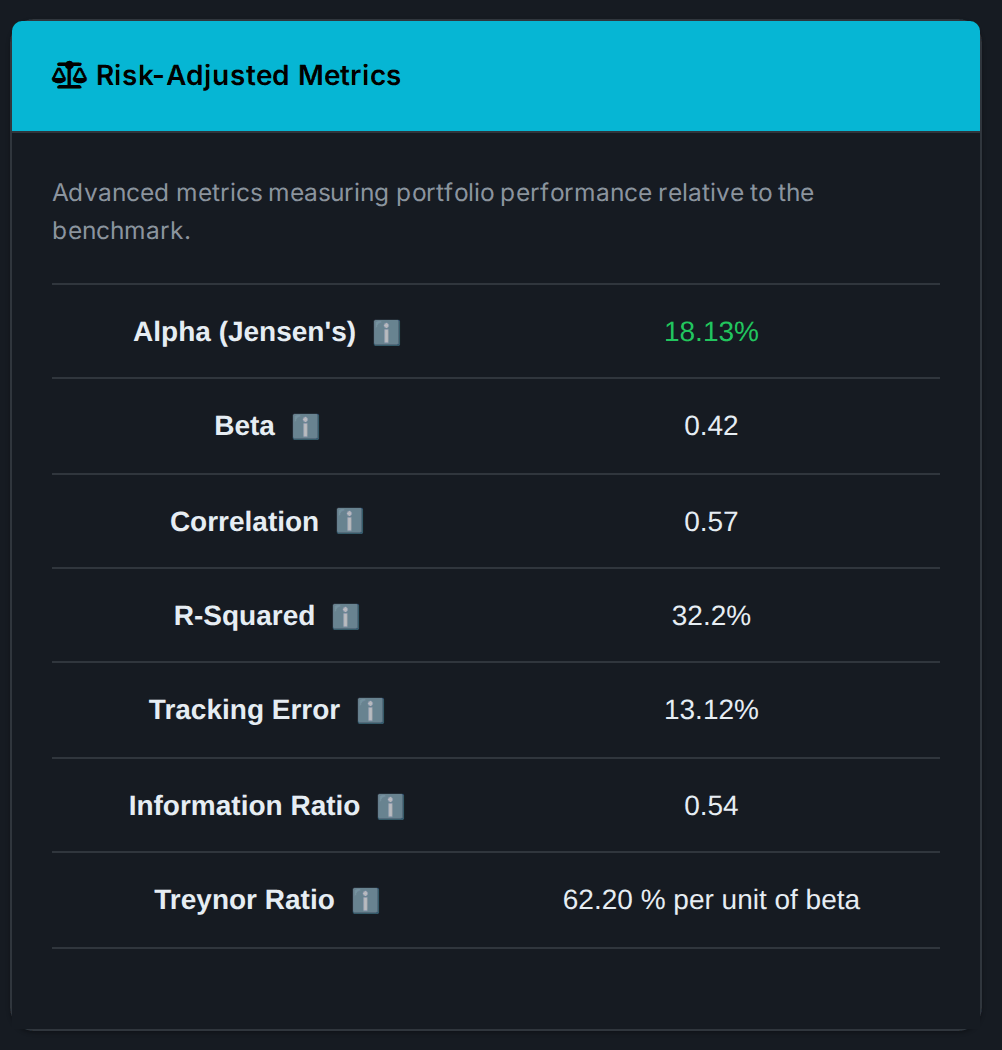
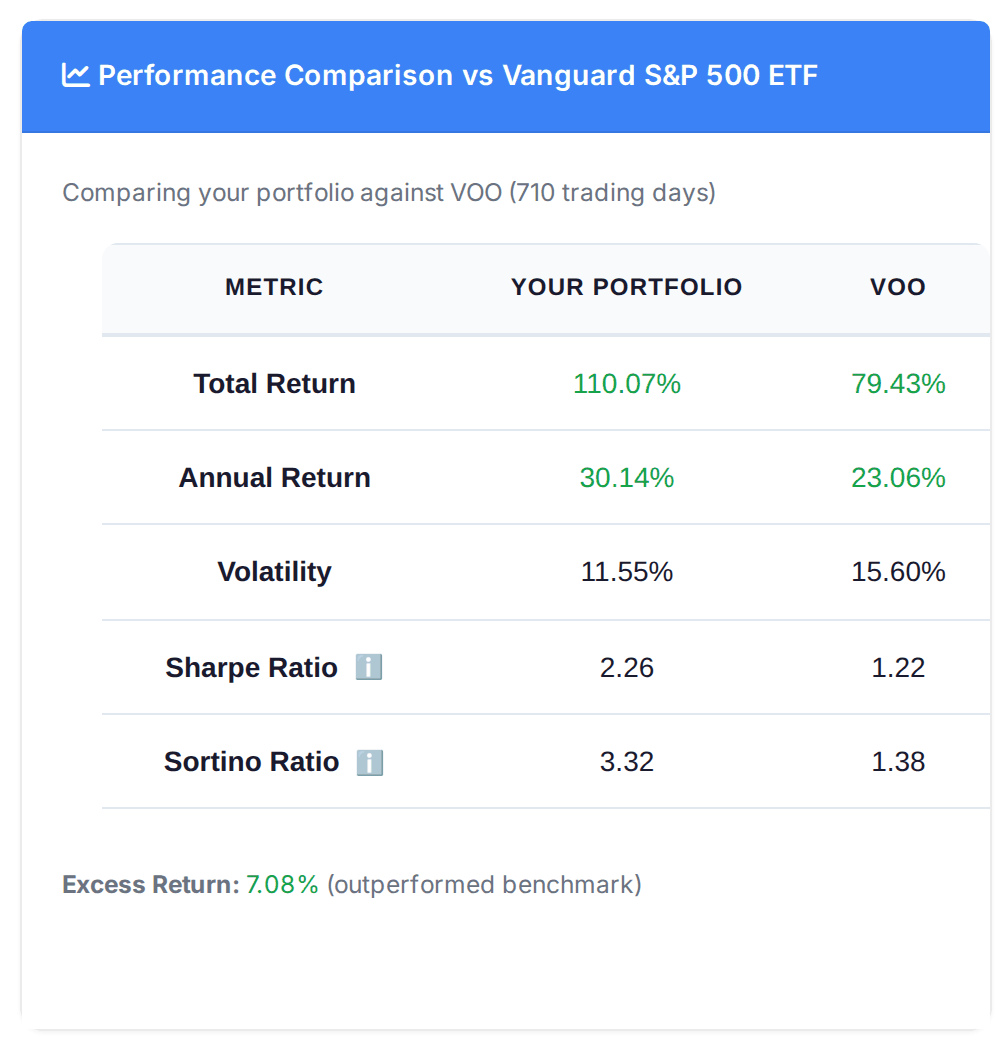
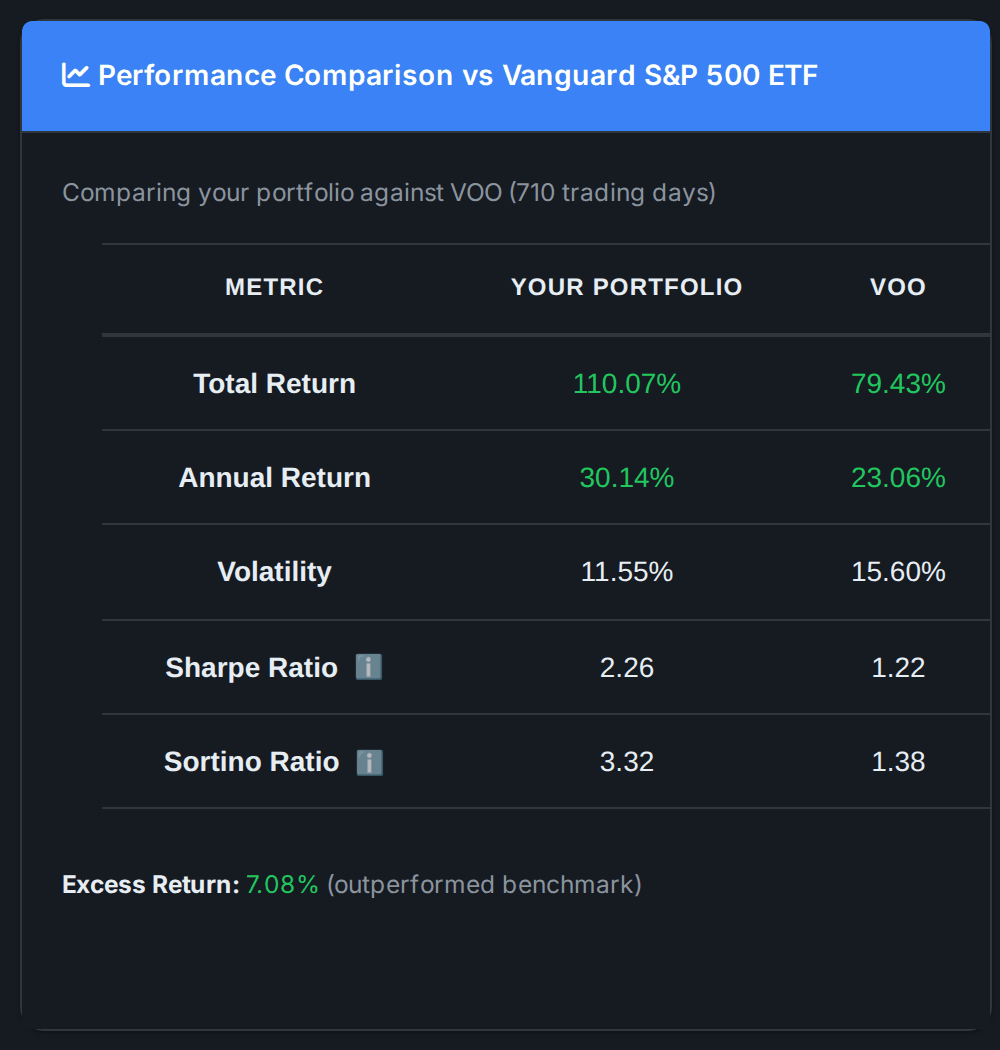
The same comparison shows how far ahead of or behind the benchmark you are each year, before any adjustment for beta. This demo portfolio beat VOO by 7.08% a year with a beta of 0.42, so its alpha came out much higher, at 18.13%. Volatility, Sharpe and Sortino ratios sit in the same card, for your portfolio and the benchmark.
How the Sharpe ratio worksAllInvestView
Add every account you hold and see your alpha, beta, excess return and Sharpe ratio against the index you pick. No spreadsheet of monthly returns to keep up to date.
The investment earned 2 percentage points a year more than its beta and the market's return said it should. Over the ten years to September 2026, Fidelity Contrafund's alpha against SPY was 2.45%: with a beta of 1.01 its expected return was 15.42% a year, and it returned 17.88%.
It means the investment earned less than the market risk it took should have paid, after its fees. A tiny negative alpha is normal for an index fund, because its fee comes out of the return. A large one, like ARK Innovation's -9.56% a year over ten years, means the extra risk wasn't paid for.
Beta is how much an investment moves when the market moves: the market risk you take. Alpha is the return it earned beyond what that risk explains. ARK Innovation's beta against SPY was 1.79, so it should have earned 25.40% a year over the ten years to September 2026. It earned 15.85%, an alpha of -9.56%.
Alpha = return - [risk-free rate + beta x (market return - risk-free rate)]. Berkshire Hathaway B returned 13.17% a year over ten years, SPY 15.23% and Treasury bills 2.43%, and its beta was 0.741. 0.741 x 12.80 = 9.48, plus 2.43 gives 11.91% expected, so its alpha was 13.17 - 11.91 = 1.26% a year.
It's alpha measured against the line in the formula above, named after Michael Jensen, who introduced it in 1968 to test 115 US mutual funds over 1945 to 1964. After expenses, 76 had a negative alpha and 39 a positive one, and the average was about -1.1% a year. Jensen estimated it with a regression on yearly returns; AllInvestView puts your compounded yearly returns straight into the formula.
Any alpha above zero that lasts for many years is good, and above 2% a year over a decade is rare. Over the ten years to June 2026, 83% of US large-cap funds trailed the S&P 500. Check R-squared too: when the benchmark explains little of an investment's moves, its alpha says little.
Against its own index, an index fund's alpha is about zero, a touch below by its fee. VOO and IVV came out at +0.06% and +0.05% against SPY, which charges more than they do. Against a different index it can show a big alpha: QQQ's was +3.99% against SPY because the Nasdaq-100 beat the S&P 500, not because anyone picked stocks.
You need the portfolio's returns and the benchmark's over the same dates, which is hard to keep up across several brokers. AllInvestView works out your portfolio's alpha from its daily returns against the benchmark and risk-free rate you choose, across every account you add.
Checked on 29 October 2026.
Alphas, betas, returns, R-squared and volatilities are worked out by AllInvestView from month-end closing prices with dividends and distributions reinvested, October 2016 to September 2026 (120 monthly returns), against SPY. Yearly returns are compounded; beta is the sample covariance over the sample variance; alpha puts the yearly returns into Jensen's formula, with the average 3-month T-bill rate over the same months (2.43%) as the risk-free rate; volatility is the standard deviation of the monthly returns × √12. The regression alphas are the intercept of monthly returns above that month's T-bill rate, times 12. Calendar-year alphas use each year's own returns and T-bill rate with the ten-year beta. Past returns don't predict future ones.