(26.18% − 5%) ÷ 6.79%SPY returned 26.18% in 2023. The 21.18 points above the target, divided by the downside deviation, give 3.12.
The Sortino ratio measures how much return you got for each unit of bad volatility. Take the annual return, subtract a target (usually the risk-free rate), and divide by the downside deviation, which only counts the periods that fell short of that target. Big up months don't count against you. That's the difference from the Sharpe ratio, which treats every swing as risk.
On monthly returns from 2021 to 2025, the S&P 500 fund SPY had a Sortino ratio of 1.14 and a Sharpe ratio of 0.74. Gold (GLD) scored 1.93 against a Sharpe of 0.98, because most of its big months were up.
Downside deviation: take each period's shortfall below the target, square it, average over all periods, take the square root and annualize. SPY in 2023: (26.18% − 5%) ÷ 6.79% = 3.12.
SPY's 12 monthly returns in 2023, with dividends reinvested, against a target of 5% a year, about what a 3-month Treasury bill paid that year.
(26.18% − 5%) ÷ 6.79%SPY returned 26.18% in 2023. The 21.18 points above the target, divided by the downside deviation, give 3.12.
(26.18% − 5%) ÷ 14.75%Sharpe divides by the volatility of all 12 months, so November's +9.13% and June's +6.48% count as risk too.
Paste your returns, one per period, from a broker statement or a spreadsheet. You get the Sortino ratio, the Sharpe ratio beside it, and every step in between. It opens with SPY's 2023 from the example above.
Orange bars are the periods that fell short of the target. They are the only ones the downside deviation counts.
Sixty monthly returns each, with distributions reinvested, and the same 3.2% target and risk-free rate for all of them: the average 3-month Treasury bill rate over the five years. Sorted by Sortino ratio.




| Fund | Annual return | Volatility | Downside deviation | Sharpe | Sortino | Worst fall | Months below target |
|---|---|---|---|---|---|---|---|
| GLD | 17.32% | 14.47% | 7.33% | 0.98 | 1.93 | −15.9% | 26 of 60 |
| SPY | 14.34% | 15.14% | 9.75% | 0.74 | 1.14 | −23.9% | 23 of 60 |
| JEPI | 9.40% | 10.11% | 6.39% | 0.61 | 0.97 | −13.0% | 24 of 60 |
| QQQ | 15.06% | 19.33% | 12.59% | 0.61 | 0.94 | −32.6% | 23 of 60 |
| SCHD | 8.89% | 14.57% | 9.20% | 0.39 | 0.62 | −15.7% | 28 of 60 |
| VXUS | 8.07% | 14.06% | 9.27% | 0.35 | 0.52 | −27.8% | 25 of 60 |
| BND | −0.44% | 6.37% | 5.00% | −0.57 | −0.73 | −17.1% | 34 of 60 |
Worst fall is the largest drop from a peak, measured on month-end values. Fund returns are before any taxes and after the funds' own costs.
GLD and SPY swung about as much: 14.47% and 15.14% volatility. But gold's three biggest months, in 2024 and 2025, were all gains. Sharpe puts GLD 0.24 ahead of SPY. Sortino, which ignores those months, puts it nearly 0.8 ahead.
Both had a Sharpe of 0.61, and their Sortino ratios were 0.97 and 0.94. Yet QQQ fell 32.6% from its peak through 2022, and JEPI 13.0%. Sortino looks at how far each month fell short, not at how losses piled up month after month, so read it next to the maximum drawdown.
BND returned −0.44% a year, below the 3.2% target, so both ratios are negative. Its Sortino of −0.73 is lower than its Sharpe of −0.57 only because the downside deviation is smaller than the volatility. Below zero, compare the returns and the falls instead.
Same top half, a different idea of risk underneath. For the six funds above that beat the target, the Sortino came out 1.5 to 2 times the Sharpe.
| Question | Sortino ratio | Sharpe ratio |
|---|---|---|
| Formula | (Return − Target) ÷ Downside deviation | (Return − Risk-free rate) ÷ Standard deviation |
| Counts as risk | Only periods below the target. | Every move away from the average, up or down. |
| A big up month | Raises the return and leaves the risk alone. | Raises the return and the risk. |
| Best for | Lopsided returns: options income, gold, single stocks, trend strategies. | Broad, diversified portfolios with fairly even ups and downs. |
| Weak spot | Needs enough losing periods; a short record with few of them can give a huge number. | Penalizes the upside you wanted. |
| Created by | Frank Sortino, described with Lee Price in 1994. | William F. Sharpe, in 1966. |
When what worries you is losing money, not the ups and downs, and when the returns aren't symmetrical. Covered-call funds, options sellers, gold and concentrated stock picks all fit. Read it next to the Sharpe ratio: when the two tell different stories, the returns are often lopsided.
For broad index funds the two usually rank things the same way. In the chart above the order barely changes: JEPI edges past QQQ, which it tied on Sharpe. Sharpe is also the number fund factsheets and most screeners publish, so it's easier to compare. More on it in what the Sharpe ratio measures.
There's no official scale. These bands come from the funds on this page, measured on monthly returns over five years.
Below 0: under the targetThe return didn't beat the target. Don't rank these; look at the return.BND −0.73
0 to 1: beat it, with real downsidePositive, but the shortfalls were large for the return.JEPI 0.97QQQ 0.94SCHD 0.62VXUS 0.52
1 to 2: strong over several yearsThe S&P 500 itself sits here for 2021 to 2025, a stretch with a bear market in it.GLD 1.93SPY 1.14
Above 2: check the recordNone of the seven reached it over five years. One good year can: SPY scored 3.12 in 2023.SPY 2023 3.12
A ratio from 2023 alone isn't comparable with one from 2021 to 2025. Put two funds or portfolios side by side over the same dates.
Daily, weekly and monthly returns give different numbers for the same fund, even after annualizing. Don't compare a daily Sortino with a monthly one.
A target of 0% makes every ratio look better than a target of 5%. When a site quotes a Sortino ratio, check which target it used.
Each one worked on SPY's 2023, where the right answer is 3.12.
Divide the squared shortfalls by all 12 months, not by the 4 that fell short. Dividing by 4 makes the downside deviation 11.75% and the ratio 1.80. A month above the target is a month with no shortfall, and it belongs in the average.
Subtracting 5% from the return but measuring shortfalls below 0% gives a downside deviation of 6.01% and 3.52. Use the same target in both places.
An annual return over a monthly downside deviation gives 21.18 ÷ 1.96 = 10.8. Annualize both: the return as a yearly rate, the downside deviation with √12 for months, √52 for weeks or √252 for trading days.
One year with four small down months gave SPY 3.12. Five years with 2022 in them gave 1.14. With few losing periods, a single month can swing the ratio a lot. Use at least three years of monthly returns when you can.
Your broker's numbers usually cover the accounts you hold there. AllInvestView puts the accounts you add together and works out the Sortino and Sharpe ratios of the stocks and funds you hold, next to the index you choose.
The analytics page puts your portfolio and the index you chose side by side: total and annual return, volatility, Sharpe and Sortino. It takes the stocks and funds you hold now, across the accounts you add at any broker, and measures them over their past prices against the index, with the risk-free rate you set in your settings.
See the portfolio analyzer AllInvestView
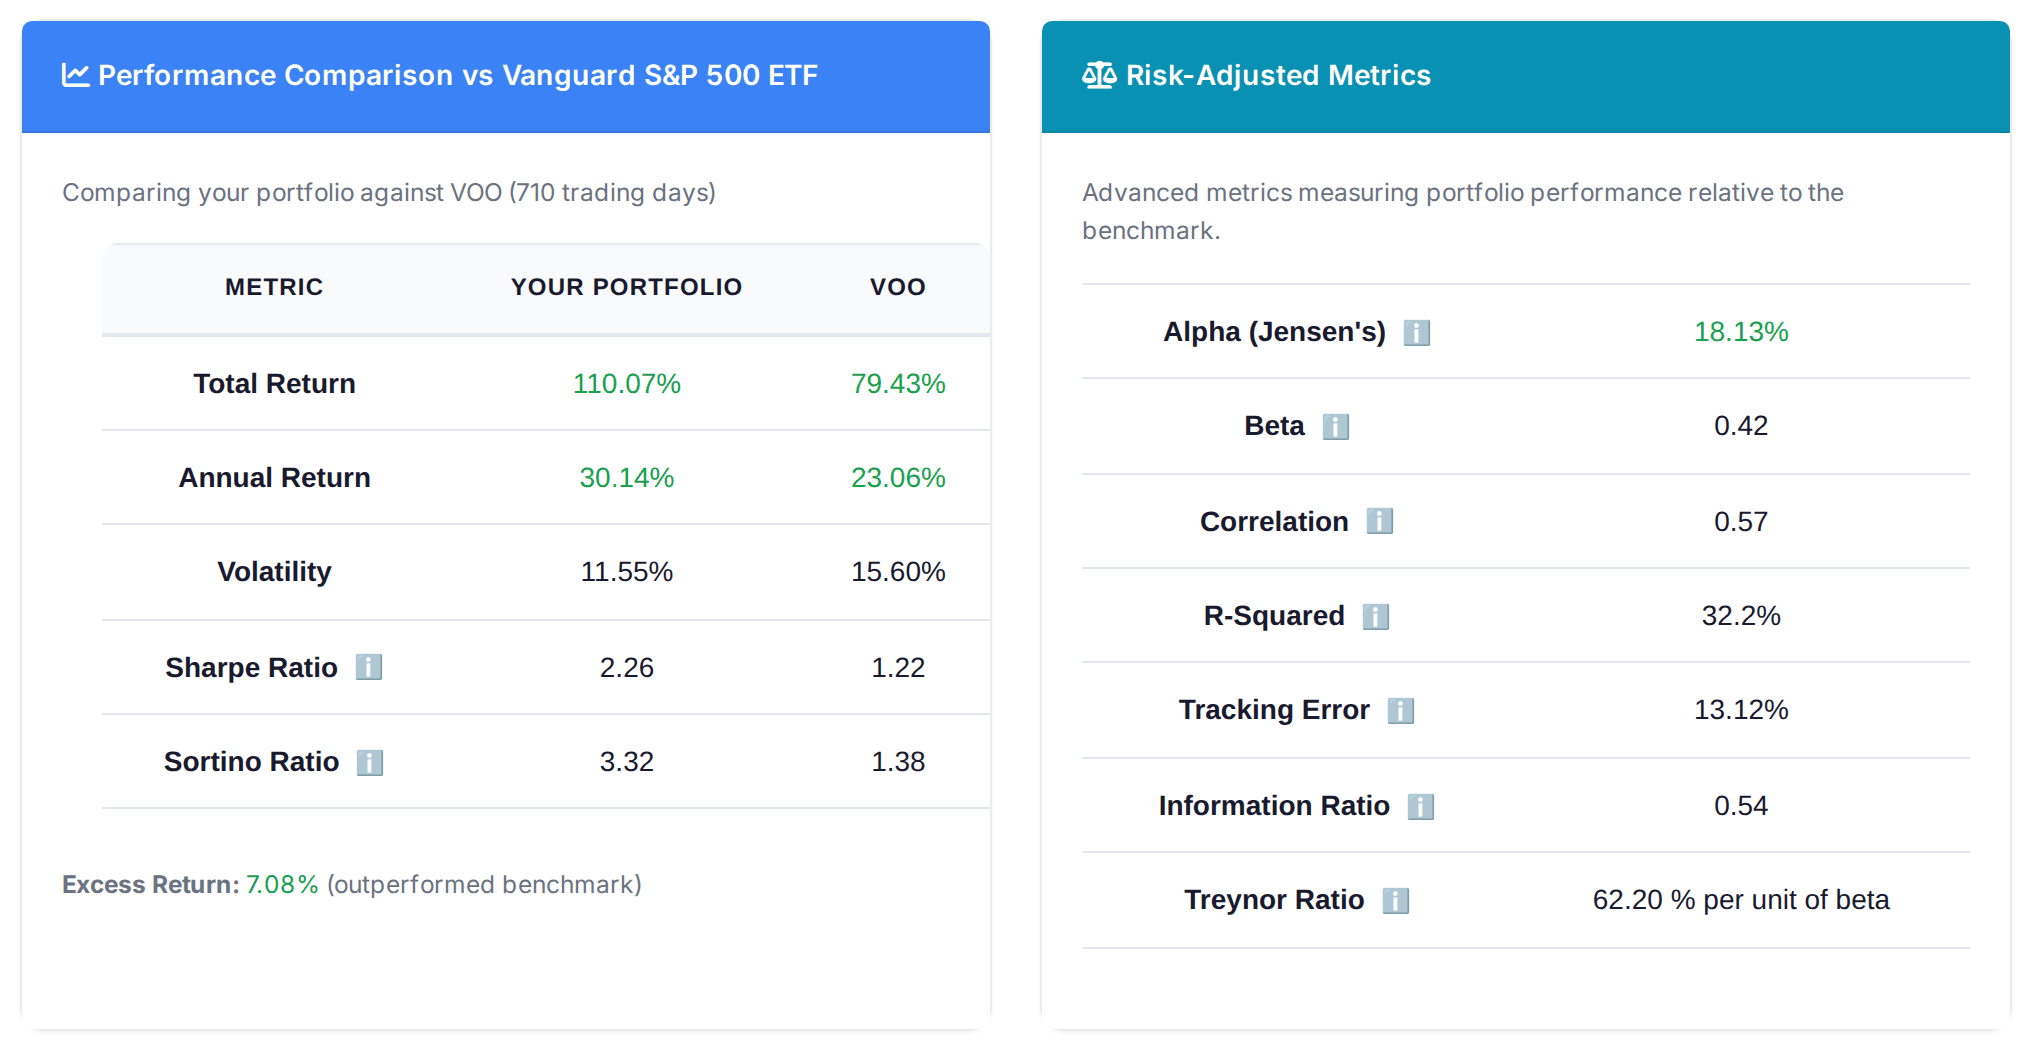
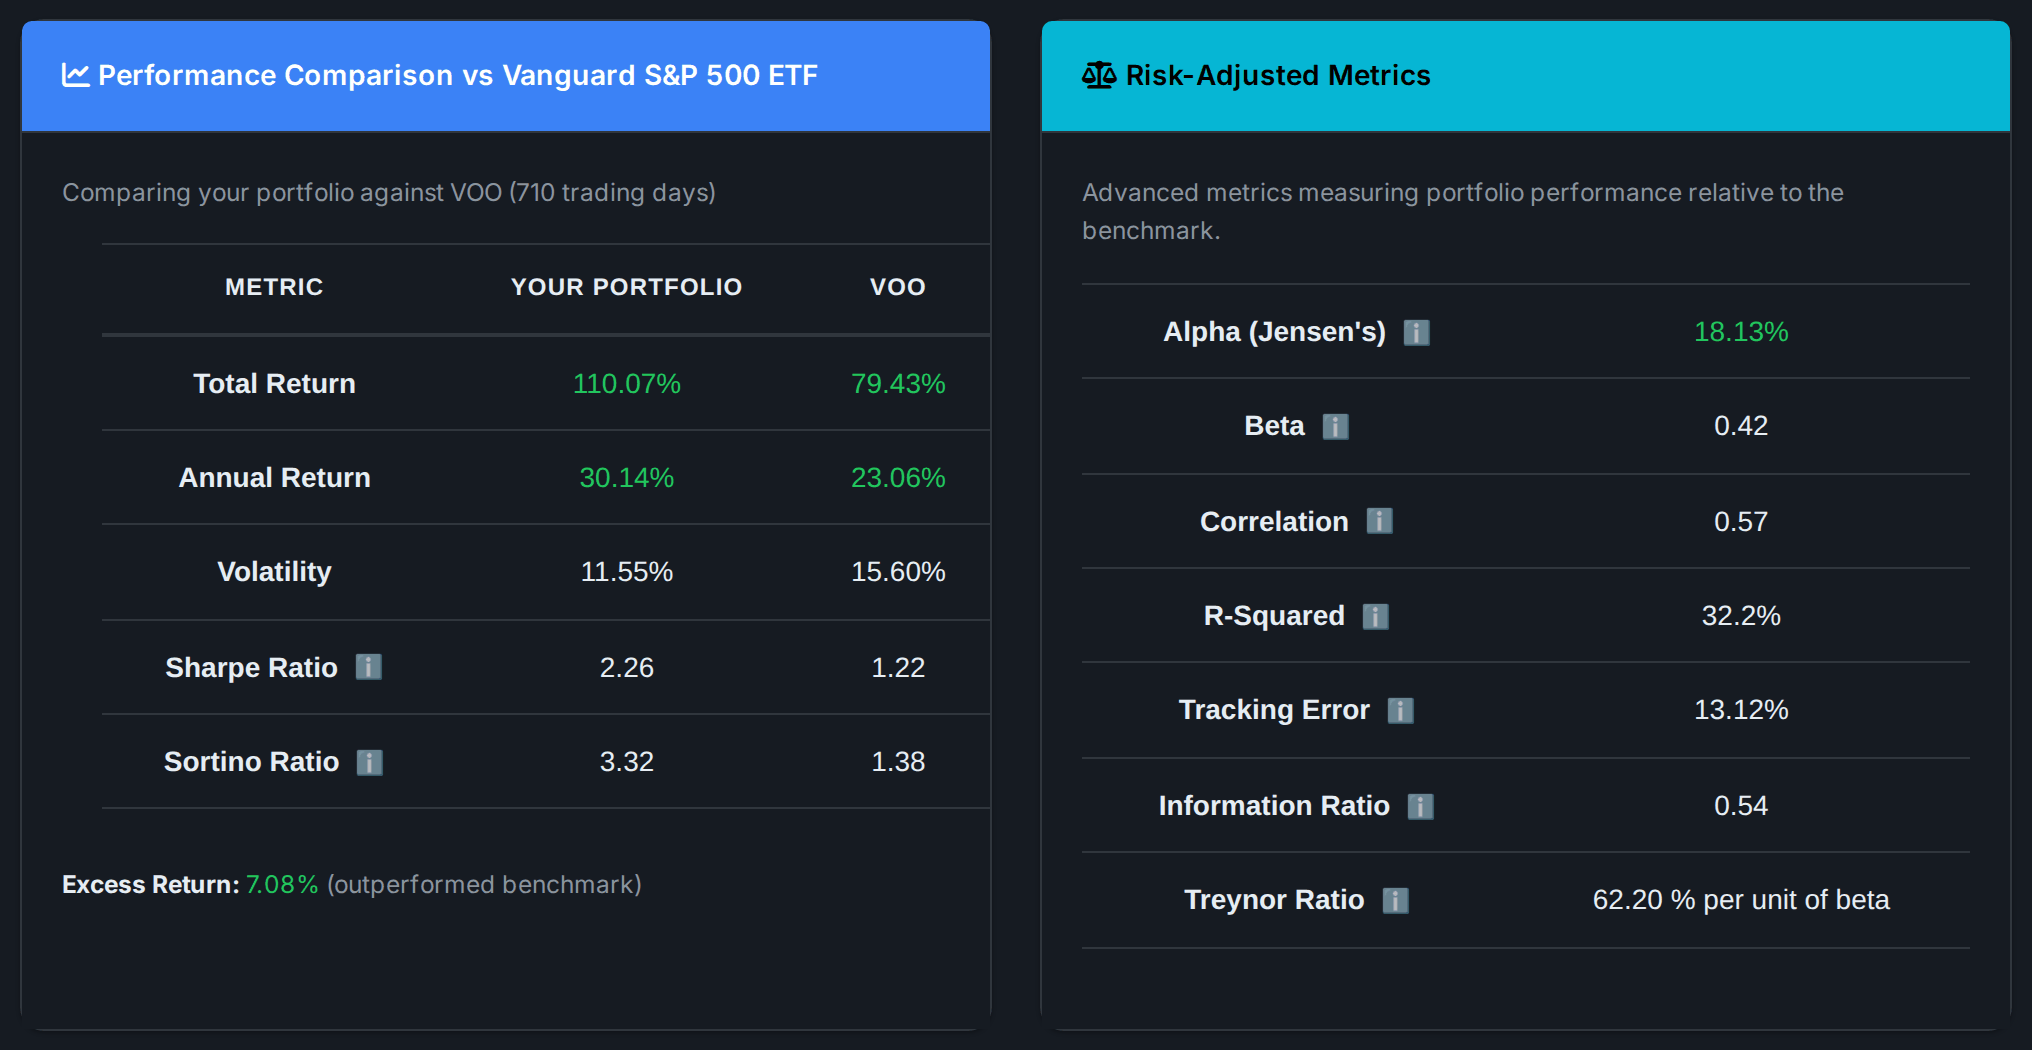
Add every account you hold and see the Sortino and Sharpe ratios, volatility and return of your stocks and funds beside the index you pick. No spreadsheet of monthly returns to keep.
A risk-adjusted return that only counts downside as risk. It takes the return above a target, usually the risk-free rate, and divides it by the downside deviation: how far, on average, the periods fell short of that target. A higher number means more return for each unit of bad volatility.
Take each period's return and subtract the target for that period. Keep only the shortfalls (set the rest to zero), square them, average them over all periods, take the square root and annualize it: × √12 for monthly returns. Then divide the annualized return minus the target by that downside deviation. SPY in 2023: (26.18% − 5%) ÷ 6.79% = 3.12.
It depends on the period and the target, so compare like with like. Measured on monthly returns from 2021 to 2025 against a 3.2% target, the S&P 500 (SPY) scored 1.14 and gold 1.93. Above 1 over several years means the return beat the target comfortably for the downside it took. A single good year can show 3 or more: SPY scored 3.12 in 2023.
When the ups and downs aren't symmetrical. Sharpe counts a big up month as risk, the same as a big down month; Sortino doesn't. That matters for options strategies, gold, single stocks and anything with lopsided returns. For a broad index fund the two usually rank things the same way, and showing both is the safest choice.
Yes, as long as you compare ratios over the same period, with the same return frequency and the same target. A Sortino from one strong year isn't comparable with one from five years. And when returns are below the target, the ratio is negative and ranking negative ratios can mislead, so look at the return and the drawdown instead.
Because downside deviation only counts the periods below the target, so it is usually smaller than the standard deviation. For the six funds on this page that beat the target, the Sortino came out 1.5 to 2 times the Sharpe. The gap is widest when the big moves are mostly up, like gold in 2024 and 2025.
With monthly returns in B2:B61 and the monthly target in E1 (the annual target ÷ 12), the annual downside deviation is =SQRT(SUMPRODUCT((B2:B61<E1)*(B2:B61-E1)^2)/COUNT(B2:B61))*SQRT(12). The annualized return is =PRODUCT(1+B2:B61)^(12/COUNT(B2:B61))-1. Subtract the annual target from it and divide by the downside deviation.
Checked on 23 October 2026.
Fund returns are worked out by AllInvestView from month-end closing prices with every distribution reinvested, January 2021 to December 2025. Ratios use the compounded annual return; the Sharpe ratio uses the sample standard deviation of the monthly returns × √12. Some sources use the average monthly excess return × 12 instead, which changes the figures: for SPY in 2023, a Sharpe of 1.32 and a Sortino of 2.87. None of it is investment advice.