Earnings per share barely moved from 2022 to 2024, then jumped to $7.46 in 2025, partly because 2024 carried a one-off $10.2 billion tax charge for the European Commission's state aid case. One window makes Apple look fair, another very expensive.
PEG Ratio: What It Is, the Formula and What a Good PEG Is
The PEG ratio is a stock's P/E ratio divided by how fast its earnings grow each year, in percent. It tells you whether a high P/E is paid for by fast growth. Alphabet ended 2025 at 29.0 times its earnings, which had grown 29.8% a year since 2020, a PEG of 0.97.
Peter Lynch's rule of thumb: a PEG of 1 is a fair price for the growth, 0.5 is a bargain and 2 is expensive. In January 2026 the whole US market sat at 1.90 on the growth analysts expected, and only three of the 16 companies below with a PEG were under 1 at the end of 2025.
Use 15 for 15% growth, not 0.15. Alphabet: 29.0 ÷ 29.8 = 0.97.
PEG ratio calculator
Enter the share price and earnings per share, then the growth: a yearly rate, or an older year's EPS and we work the rate out. Add the dividend to see the PEGY. It starts with Alphabet at the end of 2025.
The same P/E at other growth rates
At a P/E of 29.0, the PEG falls as the growth rises. Light bars are under 1, gold bars over 2, and striped bars are cut short at 4.
Quote sites usually divide the P/E by the yearly growth analysts expect over the next five years, so their PEG looks forward. Growth worked out from past earnings gives a trailing PEG. Both are fine; just compare like with like.
What is a good PEG ratio?
Under 1 has been the classic buy signal since Peter Lynch made the PEG famous in 1989. Among big companies it is rare.
"The p/e ratio of any company that's fairly priced will equal its growth rate."
"In general, a p/e ratio that's half the growth rate is very positive, and one that's twice the growth rate is very negative."
Peter Lynch, One Up on Wall Street, 1989
Cheap for the growth, if it lasts. Nvidia, JPMorgan Chase and Alphabet on past growth; regional banks and insurers on forecasts.
Around the whole market's 1.90. Amazon, Meta, Microsoft and Mastercard on past growth.
Paying up. Apple and Coca-Cola: steady businesses, but not growing as fast as their P/E implies.
The price runs ahead of the growth. Costco and Walmart, prized for reliability, and slow growers like PepsiCo.
PEG at the end of 2025: P/E ÷ yearly EPS growth over five years
P/E is the 31 December 2025 close over diluted earnings per share for the last fiscal year ended by then, from each annual report; growth is the yearly rate from the fiscal year five years earlier, split-adjusted (Nvidia's and Walmart's years end in January, so theirs is the year to January 2025; Microsoft's in June, Apple's in September, Costco's in August). The dashed line is a PEG of 1. Bars past 4 are cut short: Walmart was at 6.74, PepsiCo at 7.42 and Tesla at 10.75. 2020 was a weak year for some of them, which flatters their five-year growth.
Nvidia at 63 times earnings had a lower PEG than JPMorgan Chase at 16, because its earnings grew more than five times as fast. That is what the PEG is for: it lets you put a fast grower and a steady one on the same scale. It only works if the growth keeps coming, which is the part nobody can look up.
PEG ratio by industry
US companies in January 2026, from Aswath Damodaran's data at NYU Stern: each industry's P/E (the combined market value of its money-making companies over their combined profit) divided by the yearly earnings growth analysts expect over the next five years.
The dashed line is a PEG of 1; bars past 4 are cut short. Growth is the yearly earnings growth analysts expected in January 2026 for the next five years.
Homebuilders had the lowest P/E of these industries, 11.3, and one of the highest PEGs, 5.72, because analysts expected their earnings to grow about 2% a year. A low P/E on earnings that aren't growing is not cheap.
Chipmakers had the highest P/E, 48.8, but a PEG of 2.13, close to the whole market's 1.90, because their earnings were expected to grow 22.9% a year. A high P/E on fast growth can be fair.
One stock, three PEGs: the growth figure decides it
The P/E is a fact on the day. The growth is a choice: last year, the last three or five years, or a forecast. Here is the same price at the end of 2025 divided by three past growth rates.
Earnings per share edged up from $19.75 to $20.02 in 2025 after three strong years. On one year of growth its PEG is 11.8; on three or five years it is under 1.
Sales of Mounjaro and Zepbound helped nearly double earnings per share in 2025, to $22.95. On last year's growth the highest P/E here looks like a bargain; five years smooth that out.
Use the same growth window for every stock you compare, and prefer several years to one. A single year often holds a one-off charge or gain, and a PEG on it can swing from under 1 to over 10.
When the PEG ratio breaks
The PEG divides by growth, so it fails when growth is negative, tiny or measured from a weak year.
Earnings per share went from $1.63 to $1.36, with a Covid-vaccine peak of $5.47 in 2022 in between. With shrinking earnings the PEG is negative, and a negative PEG means nothing, so it is left blank.
Slow growth makes the PEG explode: 23.9 ÷ 3.2. That does not make PepsiCo seven times overpriced. Investors pay for its steady profit and a 4% dividend, which the PEG leaves out.
Five years of 38.8% growth sounds fast, but it starts from a tiny $0.21 a share in 2020, and 2025's $1.08 was down 47% on 2024. Even so, the P/E is so high that the PEG is above 10.
Add the dividend: PEGY
For companies that pay out much of their profit, divide the P/E by growth plus dividend yield. Coca-Cola: 23.0 ÷ (11.2 + 2.9) = 1.63, against a PEG of 2.06. Lynch used the same idea, turned upside down.
Forecasts are guesses
A forward PEG uses analysts' growth estimates, which run high for popular stocks. Check the forecast against the last five years of real growth before you trust a PEG under 1.
Compare like with like
A bank, a chipmaker and a soft-drink maker carry different risk and debt. The PEG is most useful between companies in the same industry; see the industry table.
PEG vs P/E, forward P/E and PEGY
Coca-Cola at the end of 2025 on each of them.
| Ratio | Formula | Coca-Cola | Tells you |
|---|---|---|---|
| P/E ratio | Price ÷ earnings per share | 23.0 | What you pay for each $1 of last year's profit |
| Forward P/E | Price ÷ next year's expected EPS | 20.7 at 11.2% growth | The same, on the profit expected next year |
| PEG ratio | P/E ÷ yearly EPS growth, in % | 2.06 | Whether the P/E is paid for by growth |
| PEGY ratio | P/E ÷ (growth + dividend yield) | 1.63 | The same, counting the dividend as part of the return |
| P/S ratio | Price ÷ revenue per share | 6.3 | A value when there is no profit to divide by |
Find the P/E and the growth for any stock you own
Each stock page shows the P/E with the earnings per share and forward EPS behind it; the comparisons put earnings growth for two stocks side by side.
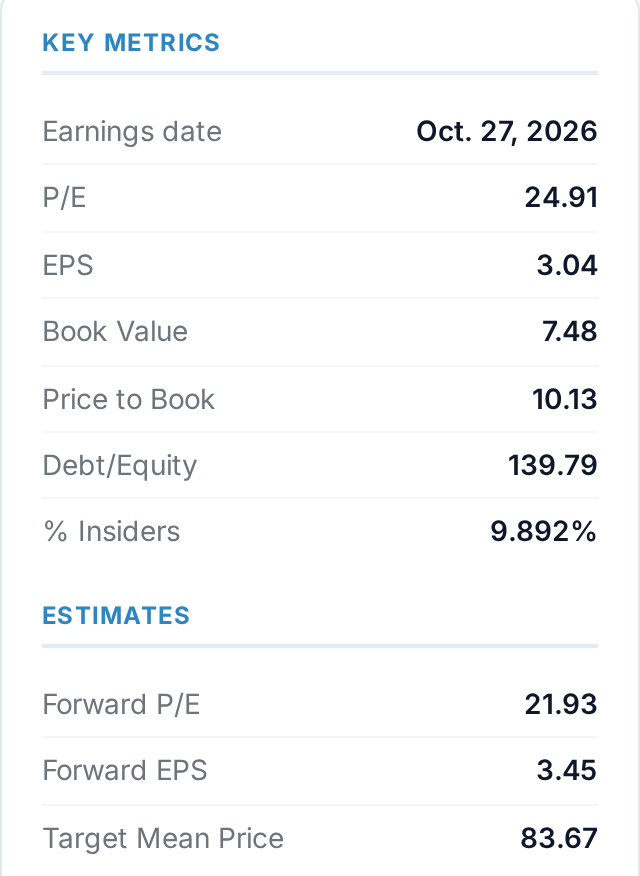
Coca-Cola: P/E, EPS and forward EPS
Every stock page lists the trailing P/E with the earnings per share behind it. The estimates underneath give the forward P/E and the EPS analysts expect next year, so the expected growth is one division away. The same page has the price chart, dividends and a DCF valuation.
Open Coca-Cola's stock page
AllInvestView
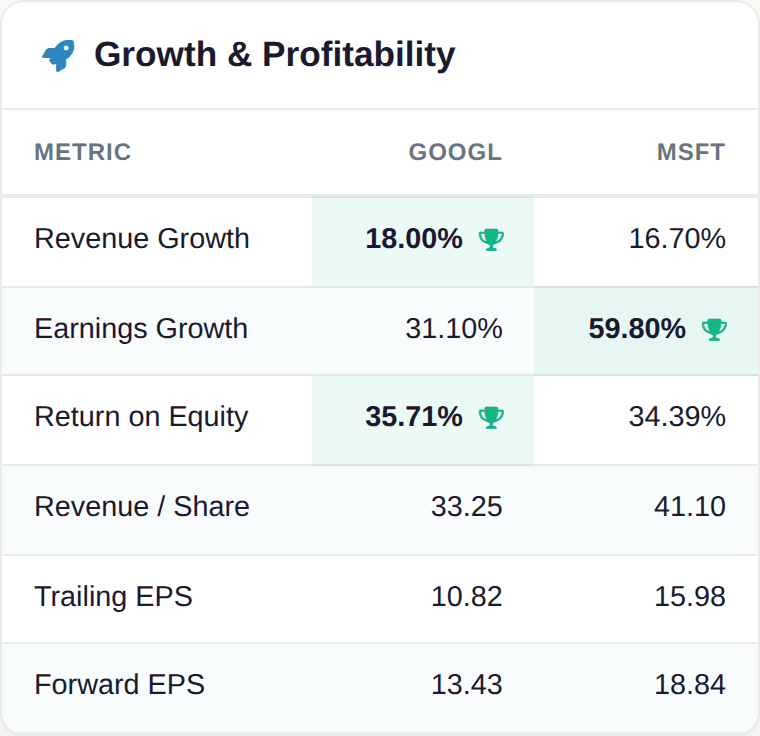
Alphabet vs Microsoft: growth side by side
Pick any two stocks and see revenue and earnings growth, return on equity and trailing and forward EPS in one table, with the higher of each marked. Their trailing and forward P/E sit in the valuation table just above it. Dividends, risk and analysts' targets are on the same page.
Compare Alphabet and Microsoft
AllInvestView
Your holdings, their valuations and your returns together
All your accounts in one portfolio, with each holding's P/E, EPS and forward EPS on its stock page, side-by-side comparisons, and your returns, dividends and tax in the same place.
Questions about the PEG ratio
How do you calculate the PEG ratio?
Divide the P/E ratio by the yearly earnings growth rate, written as a whole number. Alphabet closed 2025 at $313.00 on $10.81 of earnings per share, a P/E of 29.0. Its earnings per share grew from $2.93 in 2020, 29.8% a year, so its PEG was 29.0 / 29.8 = 0.97.
What is a good PEG ratio?
Around 1 is a fair price for the growth, under 1 is cheap if the growth lasts, and 2 or more is expensive. That is Peter Lynch's rule from One Up on Wall Street. In January 2026 the whole US market had a PEG of 1.90 on analysts' growth forecasts, so under 1 is rare among big companies; compare a stock with others in its industry.
Is a lower PEG ratio better?
Yes, as long as the growth figure is believable. A low PEG means you pay less for each point of growth. But a PEG built on one exceptional year, or on a forecast that is too rosy, can look low just before the growth slows.
What is the difference between the P/E and the PEG ratio?
The P/E compares the price with a year of earnings. The PEG divides that P/E by how fast the earnings are growing, so a fast grower on a high P/E can have a lower PEG than a slow grower on a low P/E. Homebuilders traded at 11.3 times earnings in January 2026 with a PEG of 5.72; chipmakers at 48.8 times with a PEG of 2.13.
Can the PEG ratio be negative?
Only if earnings are shrinking or the company made a loss, and then it means nothing. Most sites show N/A. Pfizer's earnings per share fell from $1.63 in 2020 to $1.36 in 2025, so it has no meaningful five-year PEG.
Which growth rate should I use for the PEG?
Quote sites usually use analysts' expected yearly growth over the next five years. You can also use past growth, which is a fact rather than a forecast. Use the same window for every stock you compare: Apple's PEG at the end of 2025 was 1.61 on one year of growth, 5.30 on three years and 2.04 on five.
What is the PEGY ratio?
The PEG with the dividend added: P/E divided by earnings growth plus dividend yield. It helps with companies that pay out much of their profit. Coca-Cola's PEG at the end of 2025 was 2.06; with its 2.9% dividend yield the PEGY was 1.63.
Who invented the PEG ratio?
Mario Farina described it in his 1969 book A Beginner's Guide to Successful Investing in the Stock Market. Peter Lynch made it popular in One Up on Wall Street in 1989, where he wrote that a fairly priced company's P/E equals its growth rate.
Sources
Checked on 29 October 2026.
- Alphabet 2025 annual report (Form 10-K), diluted earnings per share of $10.81 for 2025; the 2022 report gives 2020 on the post-split basis ($2.93).
- SEC EDGAR: company financial data (XBRL), diluted earnings per share by fiscal year as filed in each 10-K for the 17 companies, adjusted for later splits (Nvidia 10-for-1 in 2024, Walmart 3-for-1 in 2024, Netflix 10-for-1 in 2025).
- Nasdaq: Alphabet historical prices, the 31 December 2025 close of $313.00; the other 16 companies have the same page.
- Aswath Damodaran, NYU Stern: price earnings ratios by industry (US), January 2026 P/E of money-making firms, expected five-year earnings growth and PEG by industry.
- Peter Lynch, One Up on Wall Street (Simon & Schuster, 1989), the P/E-equals-growth rule and its dividend-adjusted version.
- Apple 2024 annual report (Form 10-K), the one-time $10.2 billion income tax charge for the State Aid Decision in fiscal 2024.
- Coca-Cola 2025 annual report (Form 10-K), diluted earnings per share of $3.04 and dividends of $2.04 a share for 2025.
Company figures are worked from each annual report's diluted earnings per share and the end-of-2025 share price. None of this is personal investment advice.