25 years of raises
The total dividend per share has to go up every year for at least 25 years in a row. A year at the same level ends the run as surely as a cut.
The Dividend Aristocrats are the S&P 500 companies that have raised their dividend every year for at least 25 years. There are 69 in October 2026, from Dover, with 71 years of raises, to J.M. Smucker with 25. Together they yield 2.50% on average, against about 1% for the S&P 500 as a whole.
S&P Dow Jones Indices keeps the list and reviews it every January. A company drops off when it cuts its dividend, holds it flat for a year, or leaves the S&P 500. To own all of them in one go, the ProShares S&P 500 Dividend Aristocrats ETF (NOBL) holds the 69 at equal weights, reset every quarter, for 0.35% a year.

Every Dividend Aristocrat, with the years in a row it has raised its dividend and its yield at the close on 23 October 2026. Sort any column, pick a sector or search for a company.
| Sector | Pays | ||||
|---|---|---|---|---|---|
DOVKingDover |
Industrials | 71 | 1.05% | $2.10 | Quarterly |
 EMRKingEmerson Electric |
Industrials | 70 | 1.37% | $2.22 | Quarterly |
 GPCKingGenuine Parts |
Consumer Discretionary | 70 | 3.45% | $4.25 | Quarterly |
 PGKingProcter & Gamble |
Consumer Staples | 70 | 2.70% | $4.35 | Quarterly |
 CINFKingCincinnati Financial |
Financials | 66 | 2.13% | $3.76 | Quarterly |
 KOKingCoca-Cola |
Consumer Staples | 64 | 2.29% | $2.12 | Quarterly |
 JNJKingJohnson & Johnson |
Health Care | 64 | 2.03% | $5.36 | Quarterly |
 KVUEKingKenvue |
Consumer Staples | 64 | 4.29% | $0.84 | Quarterly |
 CLKingColgate-Palmolive |
Consumer Staples | 63 | 2.25% | $2.12 | Quarterly |
 ITWKingIllinois Tool Works |
Industrials | 63 | 2.50% | $6.88 | Quarterly |
 LOWKingLowe's |
Consumer Discretionary | 63 | 2.52% | $5.00 | Quarterly |
 NDSNKingNordson |
Industrials | 63 | 1.18% | $3.76 | Quarterly |
 HRLKingHormel Foods |
Consumer Staples | 60 | 5.56% | $1.17 | Quarterly |
 FRTKingFederal Realty Investment Trust |
Real Estate | 59 | 4.27% | $4.64 | Quarterly |
 SWKKingStanley Black & Decker |
Industrials | 59 | 3.39% | $3.36 | Quarterly |
 SYYKingSysco |
Consumer Staples | 56 | 2.70% | $2.20 | Quarterly |
 PPGKingPPG Industries |
Materials | 55 | 2.68% | $2.96 | Quarterly |
 TGTKingTarget |
Consumer Staples | 55 | 3.04% | $4.64 | Quarterly |
 GWWKingW.W. Grainger |
Industrials | 55 | 0.74% | $9.96 | Quarterly |
 ABBVKingAbbVie |
Health Care | 54 | 2.42% | $6.92 | Quarterly |
 ABTKingAbbott Laboratories |
Health Care | 54 | 2.43% | $2.52 | Quarterly |
 BDXKingBecton, Dickinson and Company |
Health Care | 54 | 2.11% | $4.20 | Quarterly |
 KMBKingKimberly-Clark |
Consumer Staples | 54 | 4.65% | $5.12 | Quarterly |
 PEPKingPepsiCo |
Consumer Staples | 54 | 4.36% | $5.92 | Quarterly |
 ADMKingArcher-Daniels-Midland |
Consumer Staples | 53 | 2.60% | $2.08 | Quarterly |
 NUEKingNucor |
Materials | 53 | 0.87% | $2.24 | Quarterly |
 SPGIKingS&P Global |
Financials | 53 | 0.86% | $3.88 | Quarterly |
 WMTKingWalmart |
Consumer Staples | 53 | 0.83% | $0.99 | Quarterly |
 EDKingConsolidated Edison |
Utilities | 52 | 3.07% | $3.55 | Quarterly |
 ADPKingAutomatic Data Processing |
Industrials | 51 | 2.24% | $6.80 | Quarterly |
 MCDKingMcDonald's |
Consumer Discretionary | 50 | 3.11% | $7.72 | Quarterly |
 PNRKingPentair |
Industrials | 50 | 1.95% | $1.08 | Quarterly |
CLXClorox |
Consumer Staples | 49 | 5.79% | $5.00 | Quarterly |
 MDTMedtronic |
Health Care | 49 | 3.02% | $2.88 | Quarterly |
 SHWSherwin-Williams |
Materials | 48 | 0.95% | $3.20 | Quarterly |
 BENFranklin Resources |
Financials | 46 | 4.25% | $1.32 | Quarterly |
 AFLAflac |
Financials | 44 | 2.02% | $2.44 | Quarterly |
 APDAir Products and Chemicals |
Materials | 44 | 2.36% | $7.24 | Quarterly |
 CTASCintas |
Industrials | 43 | 0.93% | $2.08 | Quarterly |
 XOMExxon Mobil |
Energy | 43 | 2.25% | $4.12 | Quarterly |
 AMCRAmcor |
Materials | 42 | 5.64% | $2.60 | Quarterly |
 ATOAtmos Energy |
Utilities | 42 | 2.32% | $4.00 | Quarterly |
 BF.BBrown-Forman |
Consumer Staples | 42 | 3.14% | $0.92 | Quarterly |
 CAHCardinal Health |
Health Care | 40 | 0.83% | $2.06 | Quarterly |
 MKCMcCormick |
Consumer Staples | 40 | 3.99% | $1.92 | Quarterly |
 TROWT. Rowe Price |
Financials | 40 | 4.99% | $5.20 | Quarterly |
 CVXChevron |
Energy | 39 | 3.05% | $7.12 | Quarterly |
 ERIEErie Indemnity |
Financials | 36 | 2.31% | $5.85 | Quarterly |
 AOSA. O. Smith |
Industrials | 35 | 2.47% | $1.52 | Quarterly |
 ECLEcolab |
Materials | 34 | 1.01% | $2.92 | Quarterly |
 WSTWest Pharmaceutical Services |
Health Care | 34 | 0.27% | $1.04 | Quarterly |
 BROBrown & Brown |
Financials | 33 | 0.99% | $0.72 | Quarterly |
 CATCaterpillar |
Industrials | 33 | 0.95% | $6.52 | Quarterly |
 CBChubb |
Financials | 33 | 1.15% | $4.08 | Quarterly |
 LINLinde |
Materials | 33 | 1.26% | $6.40 | Quarterly |
 ROPRoper Technologies |
Information Technology | 33 | 0.83% | $3.64 | Quarterly |
 ALBAlbemarle |
Materials | 32 | 1.75% | $1.64 | Quarterly |
 ESSEssex Property Trust |
Real Estate | 32 | 3.72% | $10.36 | Quarterly |
 EXPDExpeditors International |
Industrials | 32 | 0.83% | $1.62 | Twice a year |
 NEENextEra Energy |
Utilities | 32 | 3.04% | $2.49 | Quarterly |
 ORealty Income |
Real Estate | 32 | 5.73% | $3.26 | Monthly |
 IBMIBM |
Information Technology | 31 | 2.67% | $6.76 | Quarterly |
 CHDChurch & Dwight |
Consumer Staples | 30 | 1.17% | $1.23 | Quarterly |
 GDGeneral Dynamics |
Industrials | 29 | 1.82% | $6.36 | Quarterly |
 ESEversource Energy |
Utilities | 28 | 4.67% | $3.15 | Quarterly |
 CHRWC.H. Robinson Worldwide |
Industrials | 27 | 1.79% | $2.52 | Quarterly |
 FDSFactSet Research Systems |
Financials | 27 | 1.40% | $4.64 | Quarterly |
 FASTFastenal |
Industrials | 27 | 2.00% | $1.04 | Quarterly |
 SJMJ.M. Smucker |
Consumer Staples | 25 | 3.45% | $4.48 | Quarterly |
No Dividend Aristocrat matches that search.
Yield is the latest regular dividend for a full year, divided by the closing price on 23 October 2026, from AllInvestView's market data. Years of raises run to October 2026 and count a 2026 raise once it has been declared. They come from each company's own count where it gives one and from compiled dividend histories where it doesn't. A few companies count fiscal years, and AbbVie, Amcor and Kenvue include the history of the company they came from. Sectors are GICS sectors.
Nearly half the list, 32 companies, are also Dividend Kings with 50 years of raises or more. The highest yields come from food and household names, real estate trusts, a utility and two fund managers.
Consecutive years each company has raised its dividend.
DoverEmersonGenuine PartsProcter & GambleCincinnati FinancialCoca-ColaJohnson & JohnsonKenvueColgate-PalmoliveIllinois Tool WorksLowe'sNordsonLatest regular dividend for a full year over the close on 23 October 2026.
CloroxRealty IncomeAmcorHormelT. Rowe PriceEversourceKimberly-ClarkPepsiCoKenvueFederal RealtyFranklinMcCormickNumber of Dividend Aristocrats by years of raises.
Average yield of each group. However long the record, the groups average between about 2% and 3%. The business sets the yield: West Pharmaceutical yields 0.27% after 34 years of raises, Hormel 5.56% after 60.
S&P Dow Jones Indices runs the index and publishes the rules. The membership changes once a year, apart from companies that cut or leave the S&P 500.
The total dividend per share has to go up every year for at least 25 years in a row. A year at the same level ends the run as surely as a cut.
S&P announces the changes in January, from data to the end of December, and they take effect after the last trading day of the month. No sector can be more than 30% at that review. Each company holds the same weight, reset every January, April, July and October. If fewer than 40 qualify, S&P adds companies with more than 20 years of raises, highest yield first.
A company that leaves the S&P 500 leaves the Aristocrats at the same time. S&P also checks dividend news every month, and can remove a company that cuts or suspends its dividend before the next January review.



Total return of the S&P 500 Dividend Aristocrats index each calendar year since 2016, against the S&P 500, with dividends reinvested.
| Total return | 2016 | 2017 | 2018 | 2019 | 2020 | 2021 | 2022 | 2023 | 2024 | 2025 |
|---|---|---|---|---|---|---|---|---|---|---|
| Aristocrats | 11.8% | 21.7% | -2.7% | 28.0% | 8.7% | 26.0% | -6.2% | 8.4% | 7.1% | 7.3% |
| S&P 500 | 12.0% | 21.8% | -4.4% | 31.5% | 18.4% | 28.7% | -18.1% | 26.3% | 25.0% | 17.9% |
Aristocrats7.68%
S&P 50015.74%
Aristocrats9.61%
S&P 50022.89%
Aristocrats6.68%
S&P 50013.79%
Aristocrats9.85%
S&P 50015.33%
Over ten years to 30 September 2026 the Aristocrats returned 9.85% a year, against 15.33% for the S&P 500. They kept up in 2016 and 2017, then trailed in most years since, when the market was led by large technology companies that pay small dividends or none. They lost less when the market fell: 2.73% against 4.38% in 2018, and 6.21% against 18.11% in 2022.
Index returns before fund fees. Calendar years from S&P Dow Jones Indices; the four periods above run to 30 September 2026, from ProShares for the Aristocrats and State Street for the S&P 500. NOBL charges 0.35% a year, so it returns a little less than the index.
The Aristocrats are one of several lists of steady dividend raisers. They differ in how many years they ask for, which companies count, and whether anyone runs an index on them.
| List | Years of raises | Which companies | Who keeps it | Fund that tracks it |
|---|---|---|---|---|
| S&P 500 Dividend Aristocrats | 25+ | S&P 500 companies worth $3 billion or more | S&P Dow Jones Indices | ProShares NOBL |
| Dividend Kings | 50+ | Any US-listed company | Dividend publishers; there is no single official list | None tracks the list |
| Dividend Champions | 25+ | Any US-listed company, any size | Dividend Champions list, started by David Fish | None tracks the list |
| S&P High Yield Dividend Aristocrats | 20+ | S&P Composite 1500: large, mid and small US companies | S&P Dow Jones Indices | SPDR S&P Dividend ETF (SDY) |
| S&P MidCap 400 Dividend Aristocrats | 15+ | S&P MidCap 400 companies | S&P Dow Jones Indices | ProShares REGL |
| Nasdaq US Broad Dividend Achievers | 10+ | US-listed companies | Nasdaq | Invesco Dividend Achievers ETF (PFM) |
Every Dividend Aristocrat with 50 years of raises or more is also a Dividend King, and carries a King tag in the list above. S&P's Dividend Monarchs index also asks for 50 years, from a wider pool of large, mid and small US companies. S&P also runs Aristocrats indices for Canada, Japan, the UK and the eurozone, where some accept a dividend held flat for a year.
Every holding from every broker you add, how much more each one paid you than the year before, its yield and yield on cost, and what's coming next.
The report ranks your top dividend payers and shows, for each, how its payments to you in the last full year compare with the year before. Income month by month, before and after tax withheld at source, and what the coming year should pay. Every coming payment also sits in a calendar on its pay date.
See the dividend tracker AllInvestView
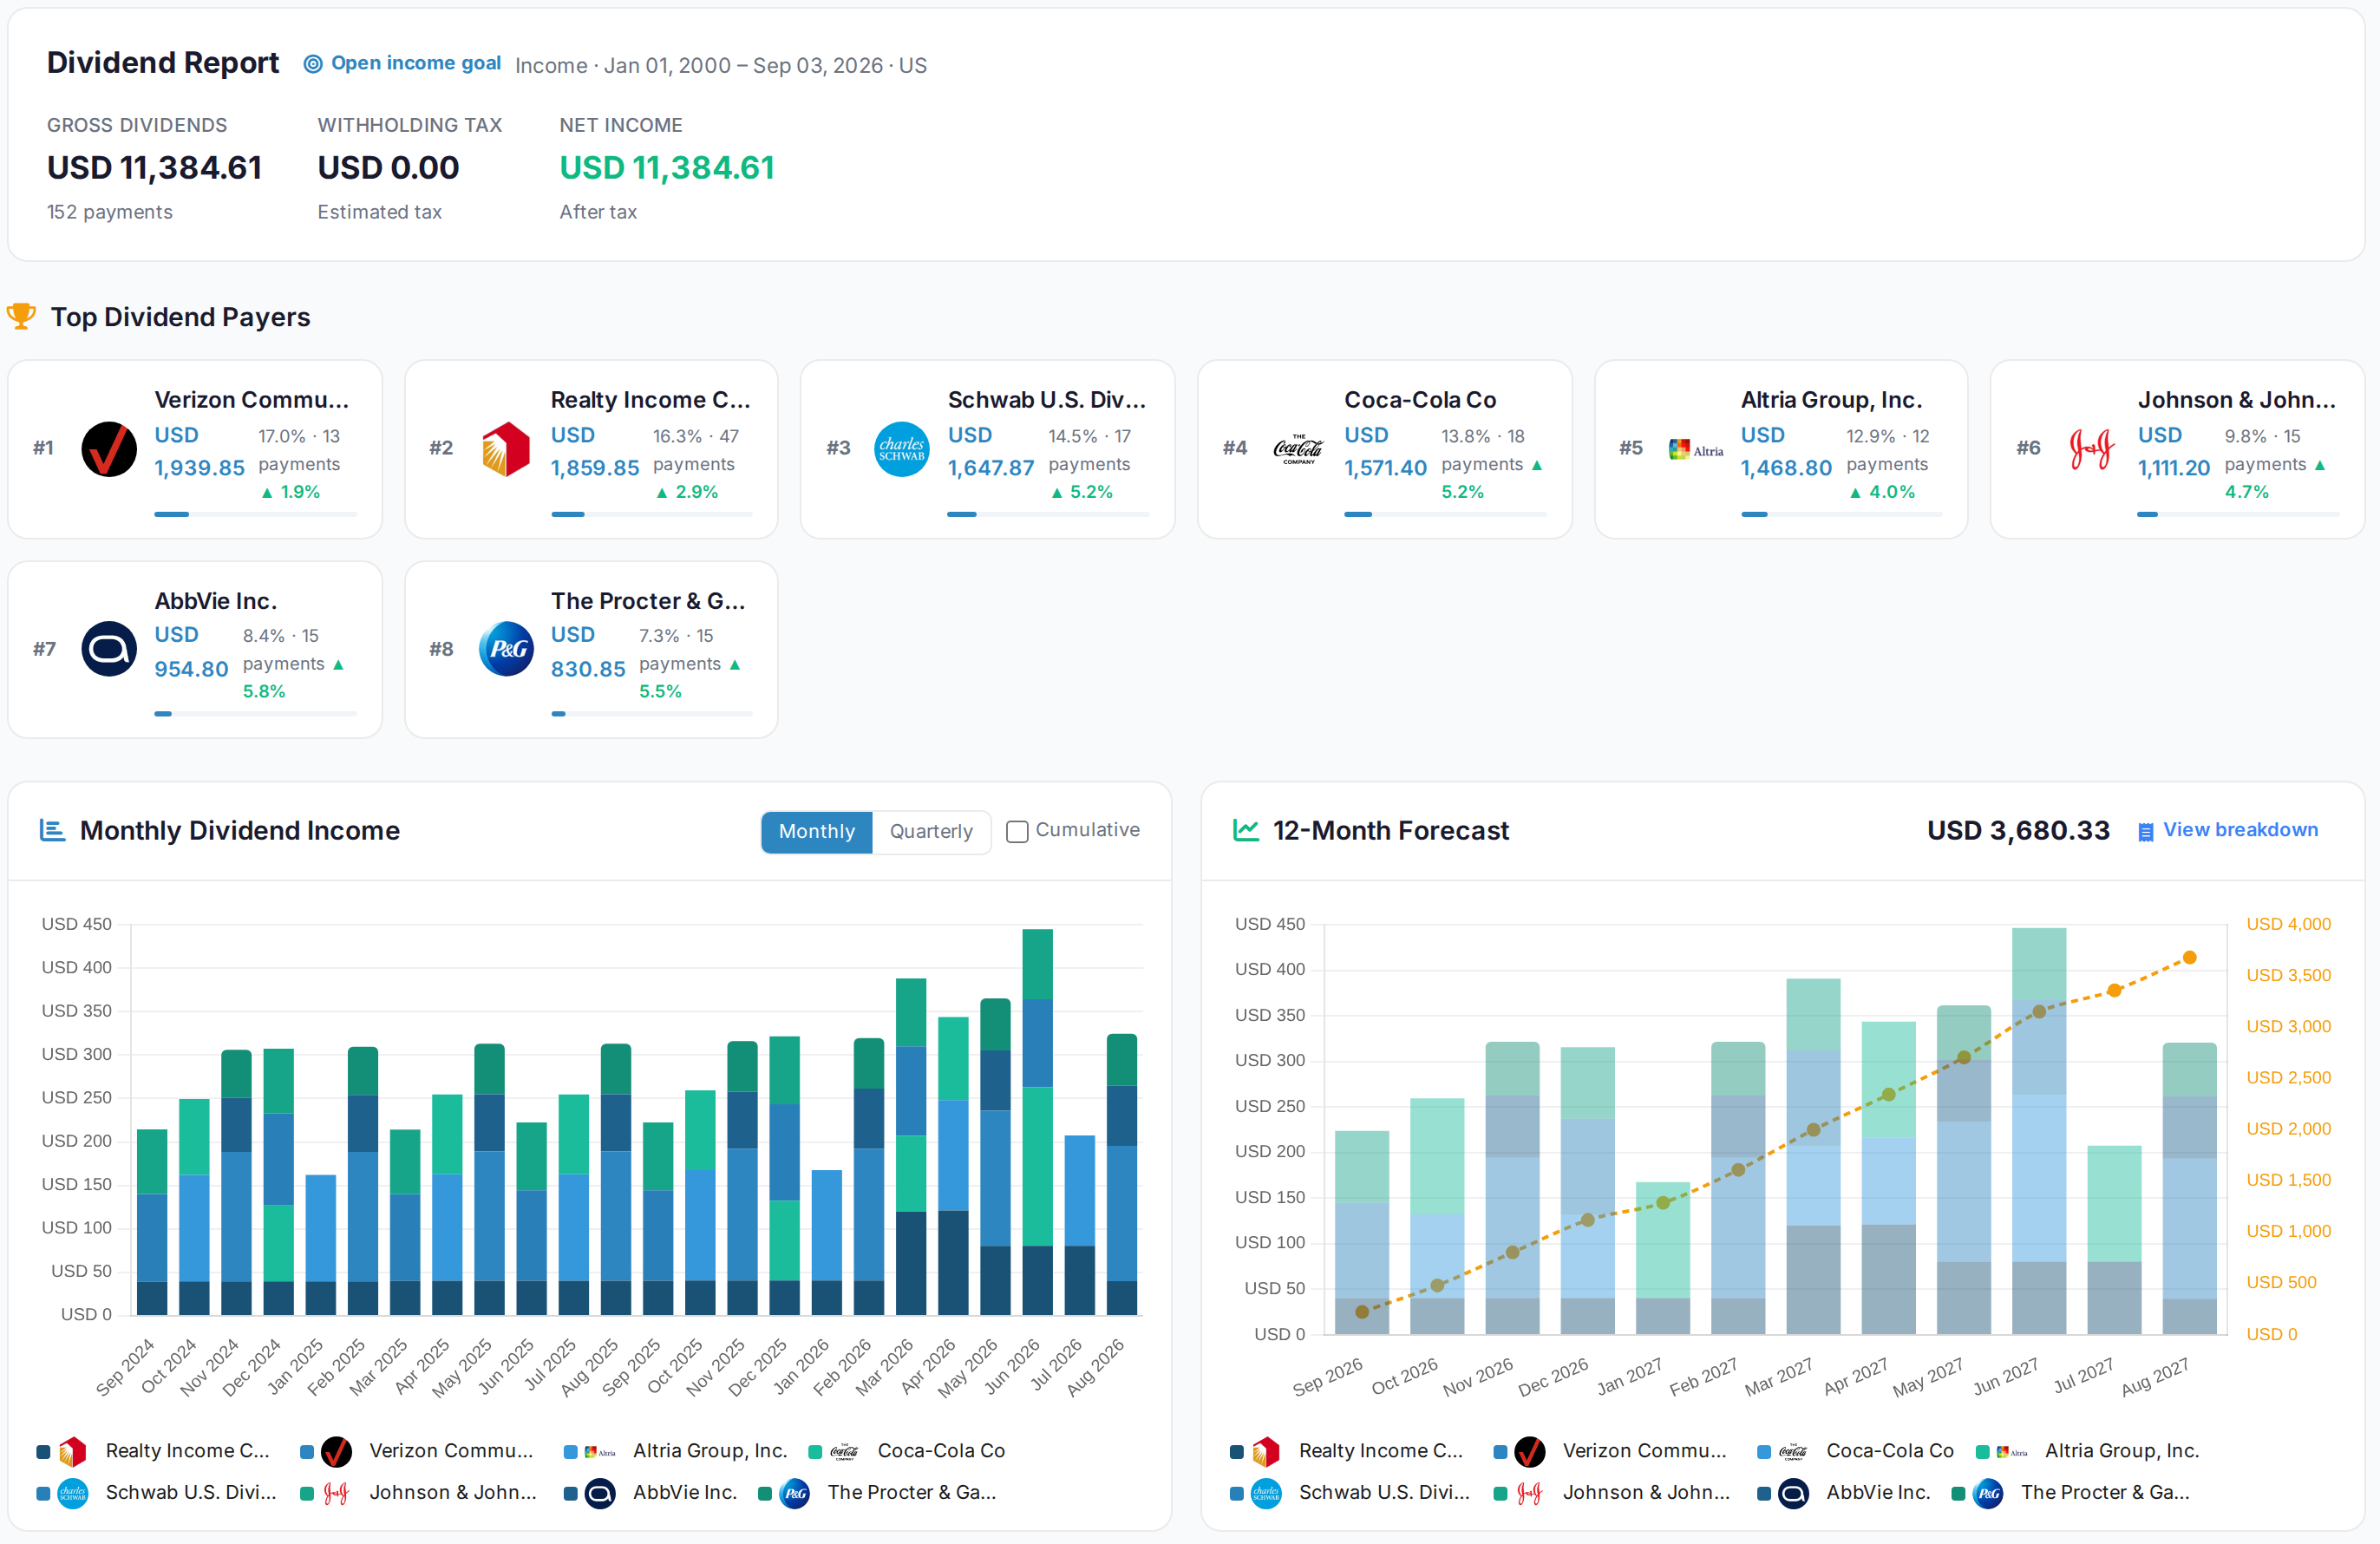
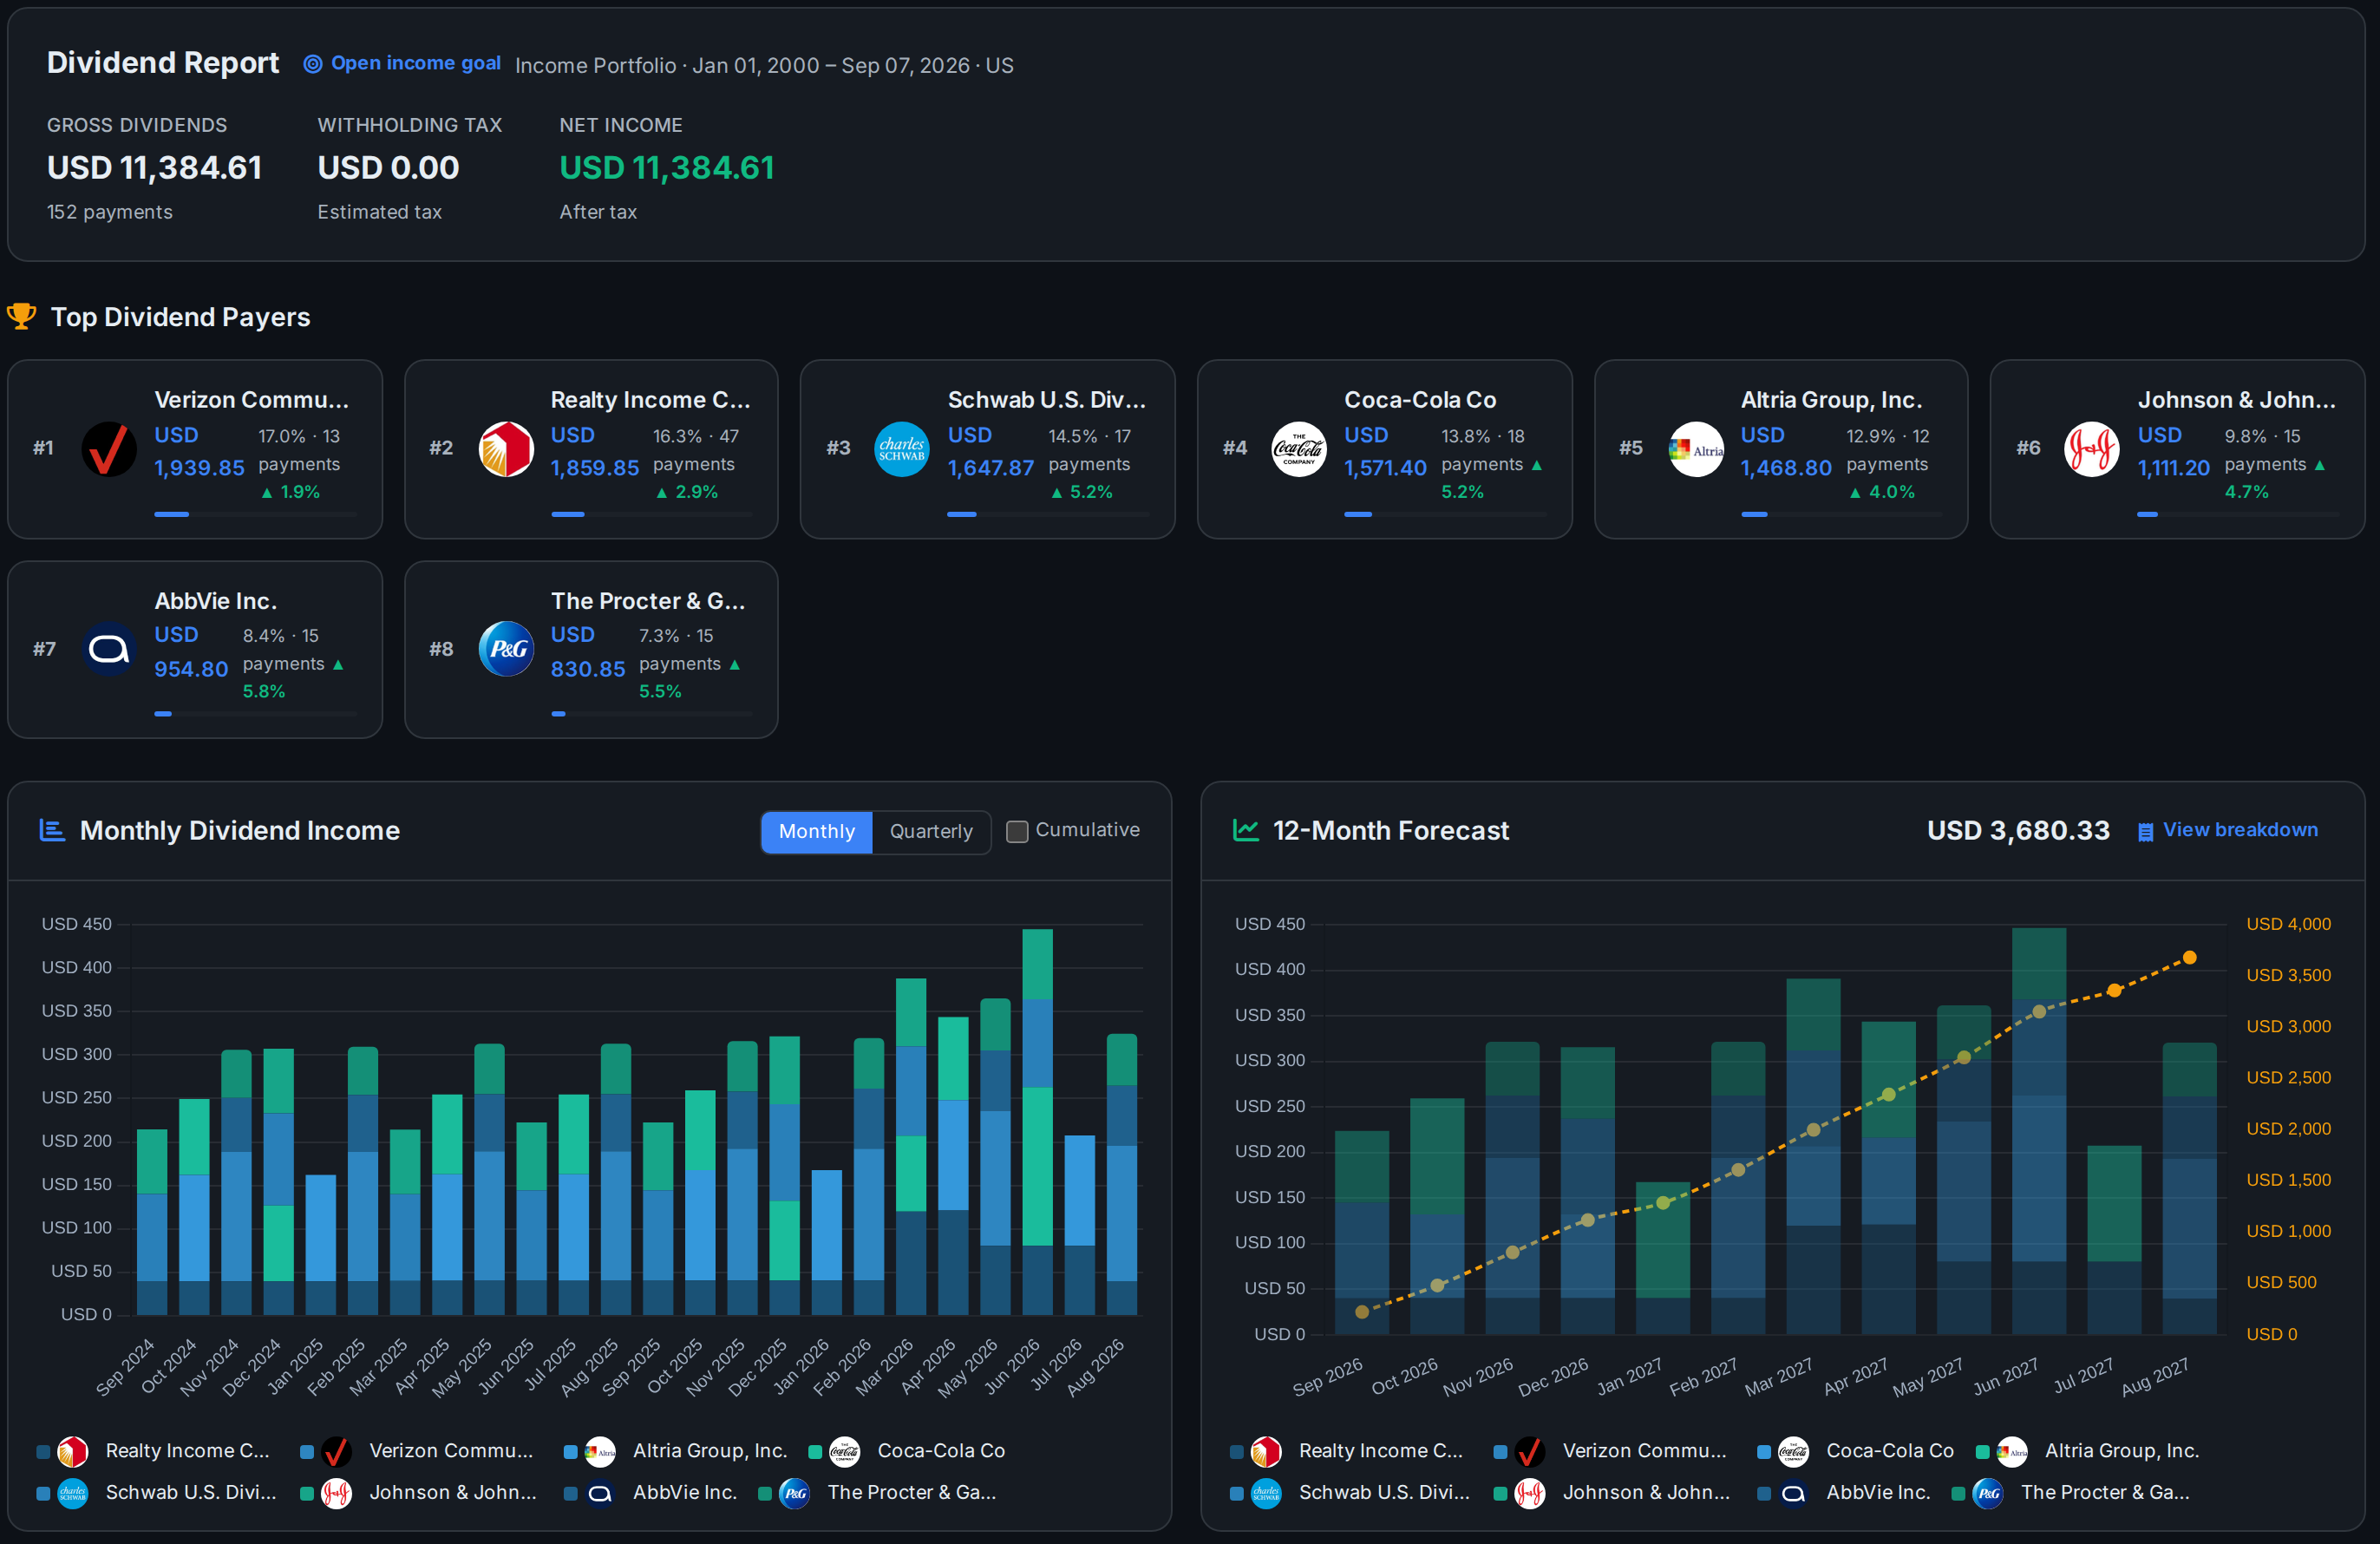
Each holding's current yield sits next to its yield on cost, the dividend against the price you paid. Shares of a company that keeps raising its dividend pay more on your money every year you hold them.
Dividend yield and yield on costAllInvestView
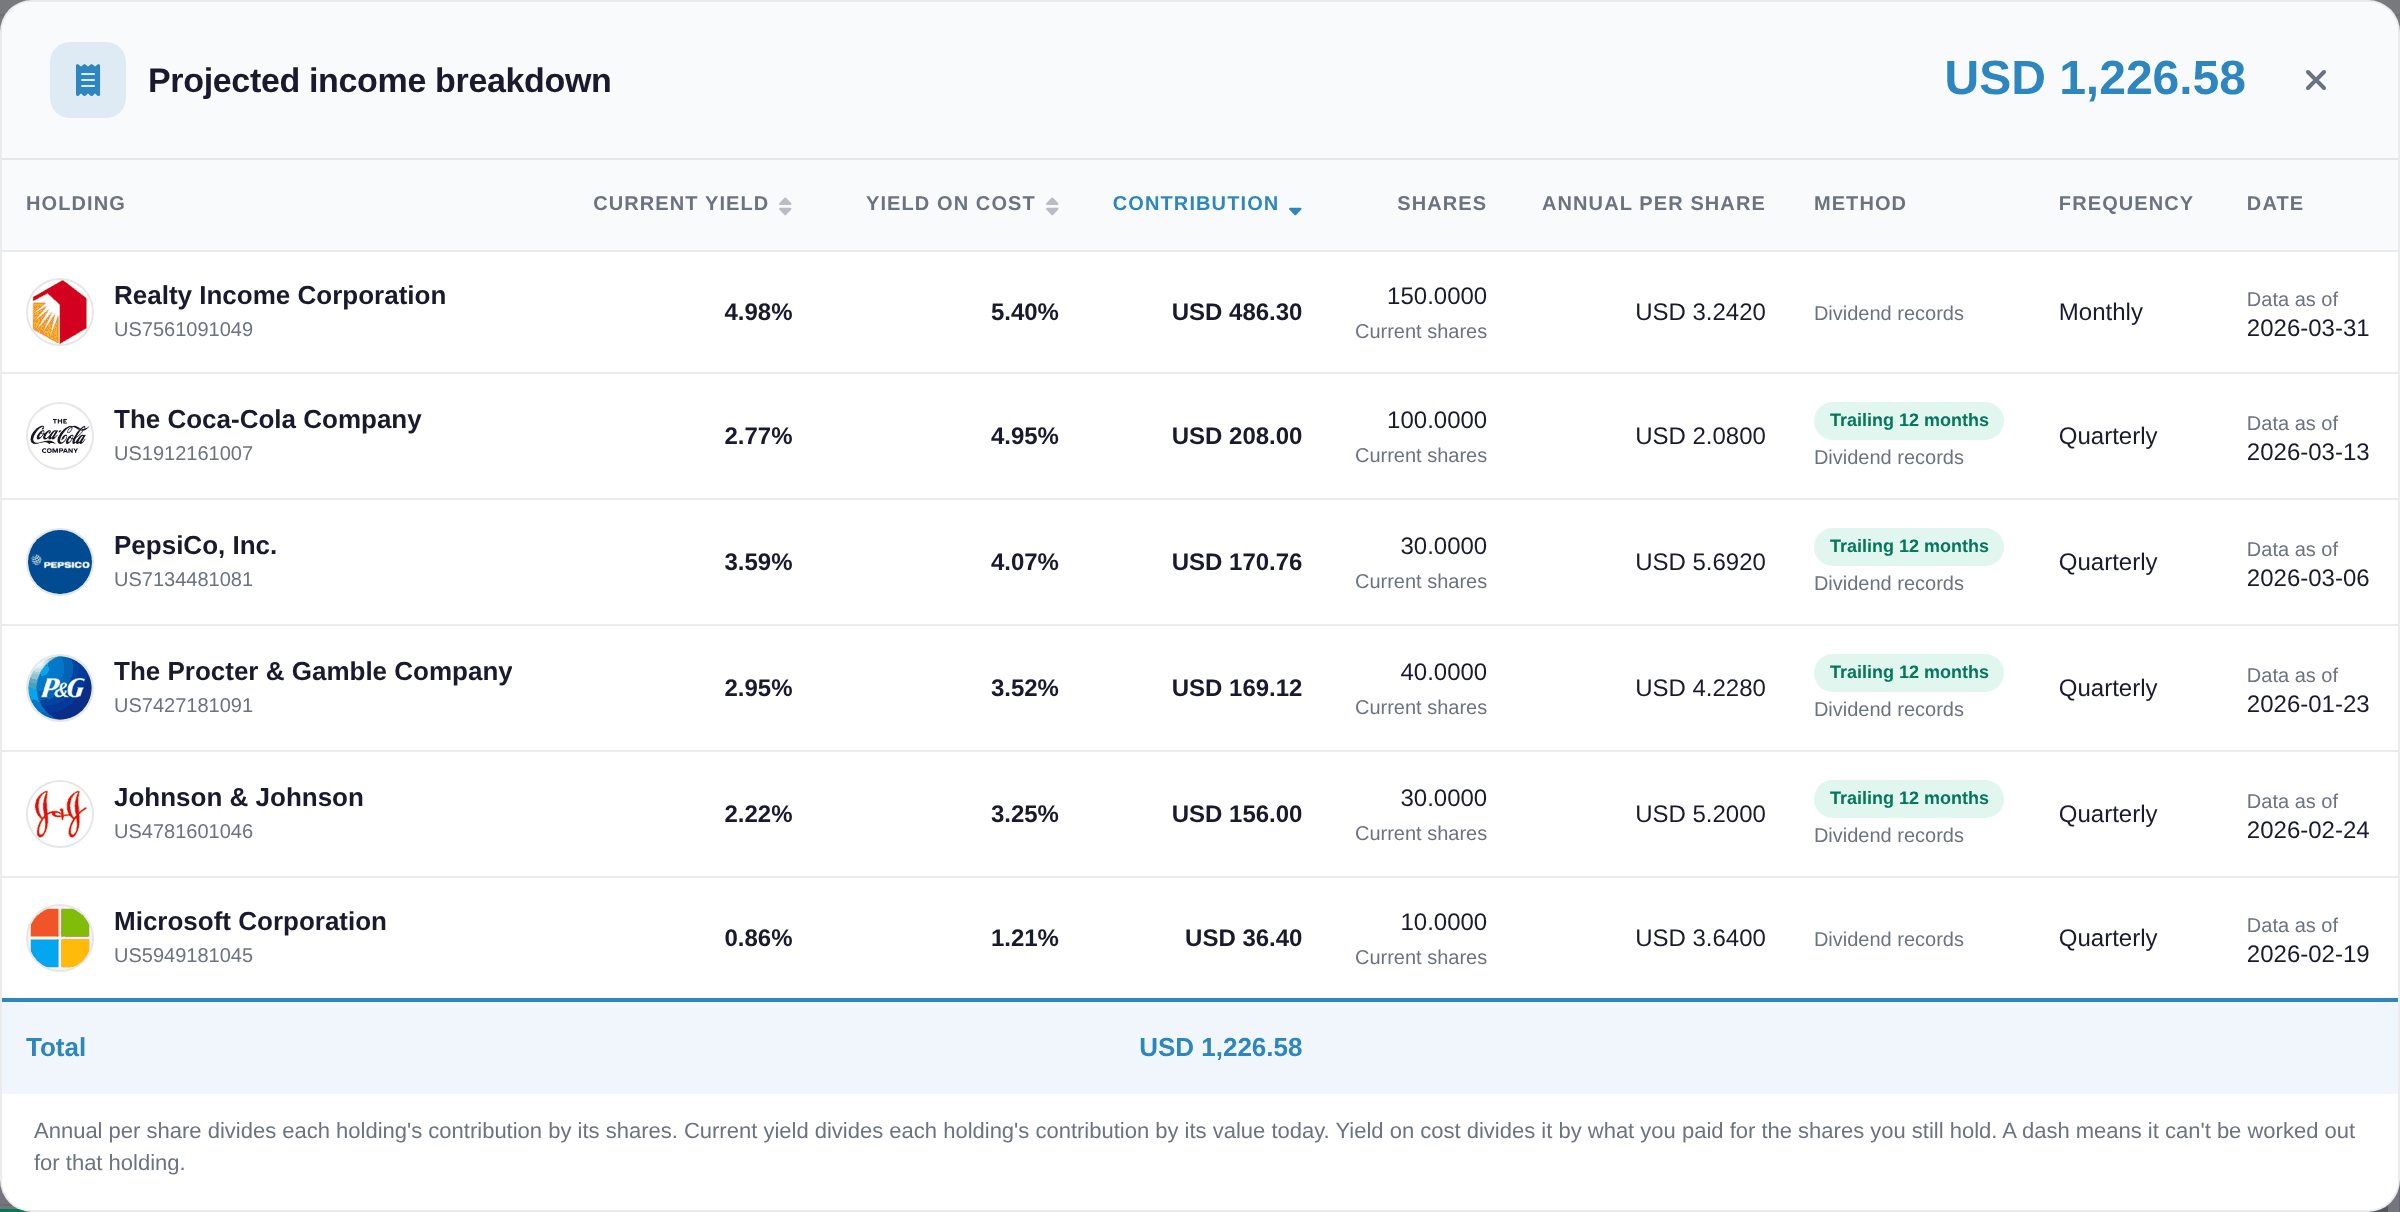
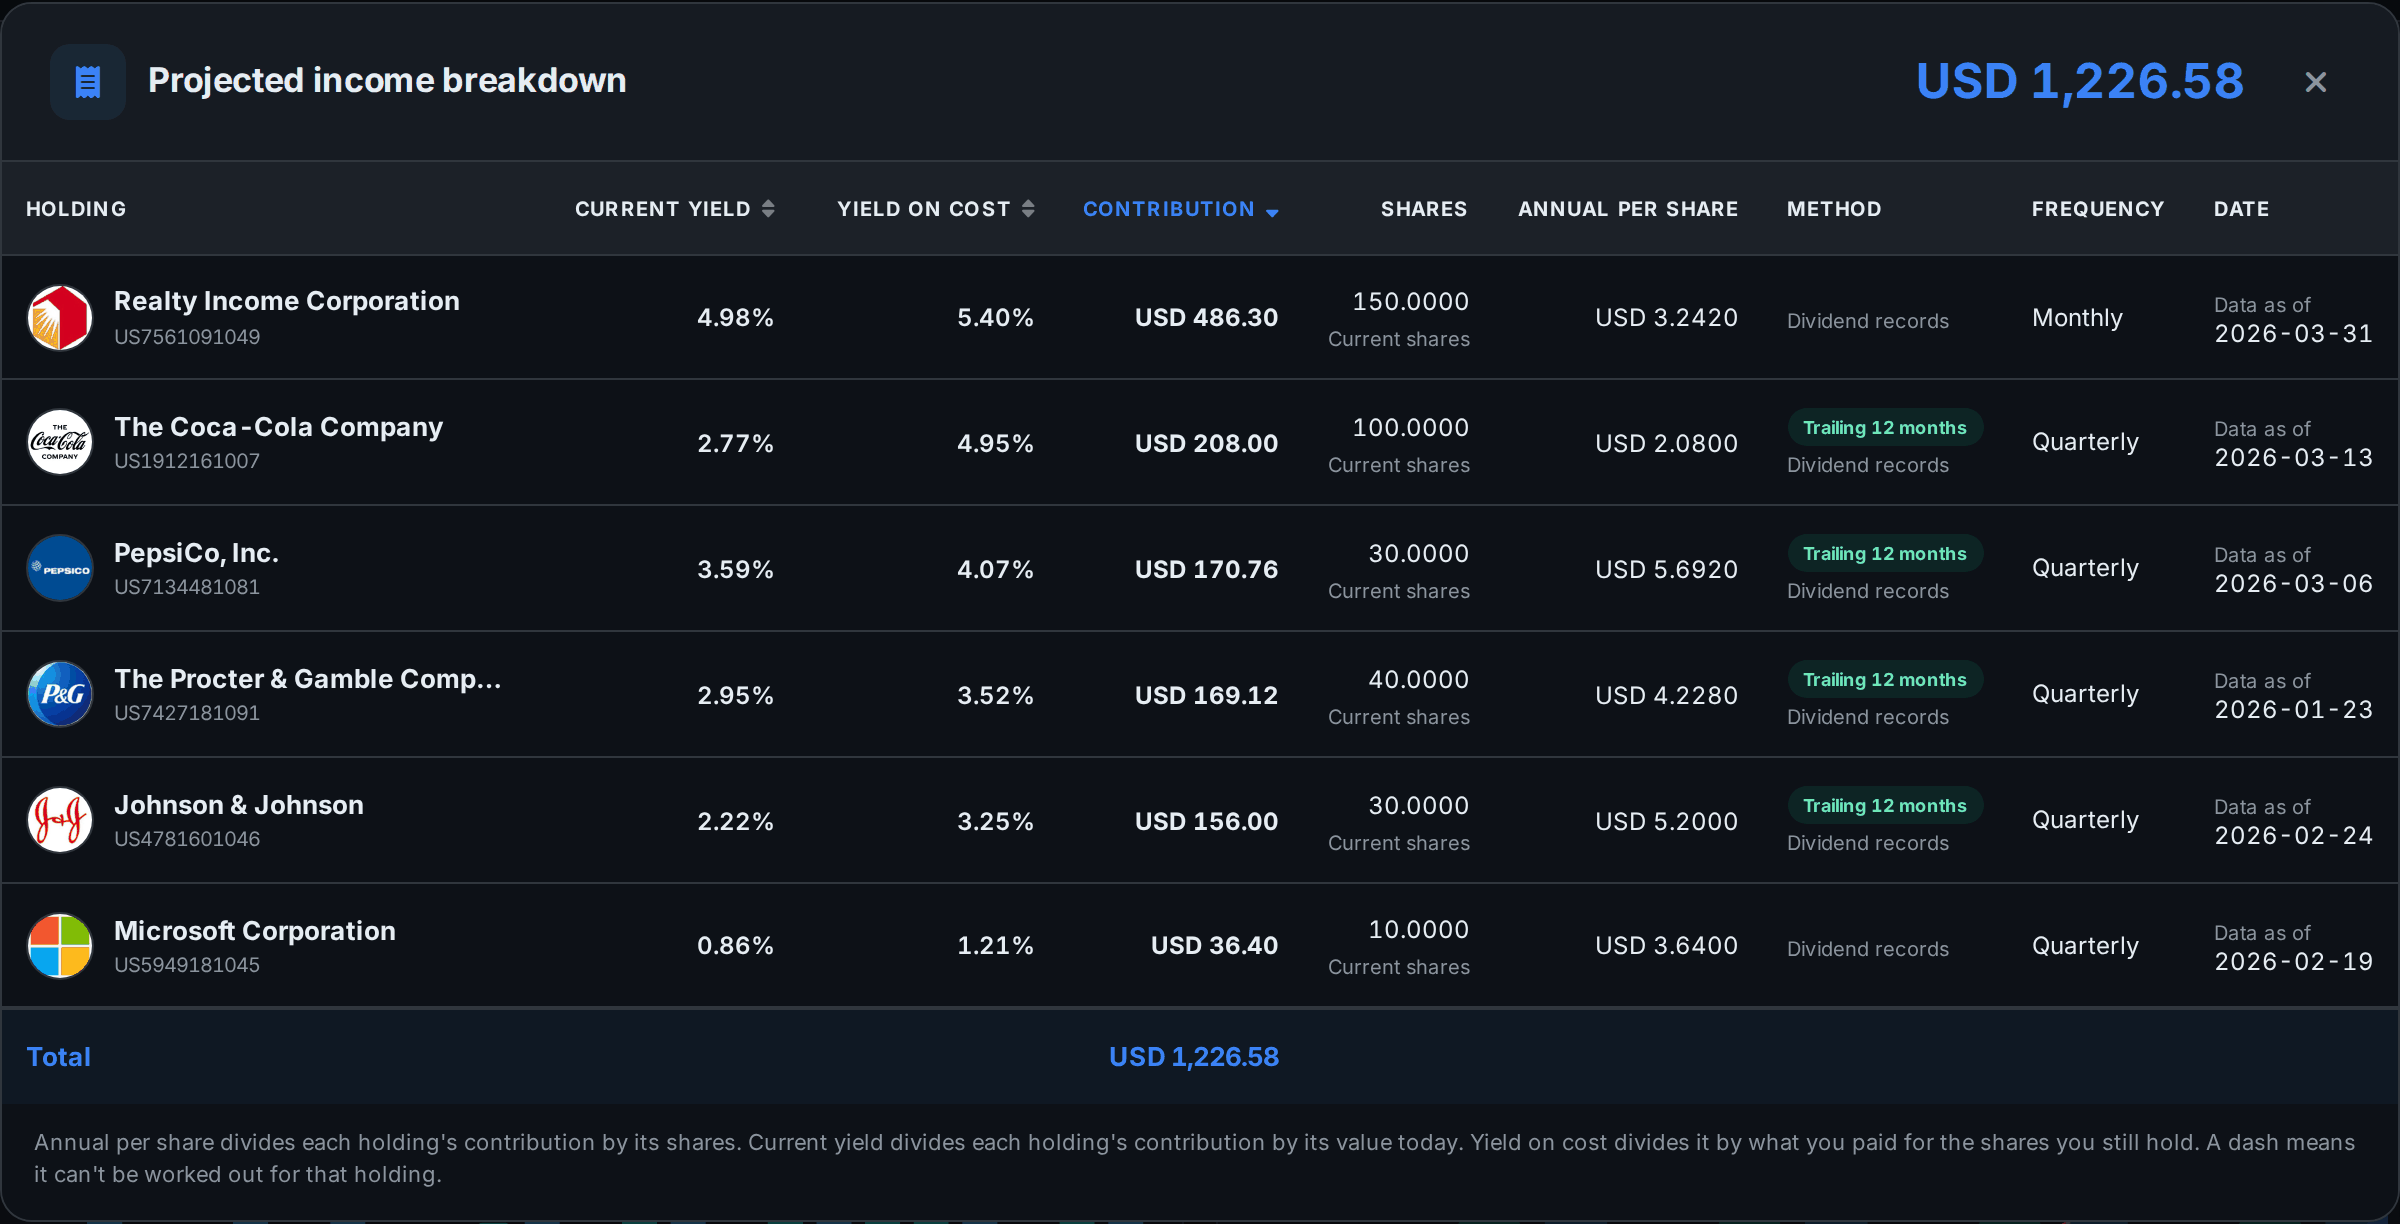
All your accounts in one place, how much more each payer sent you than last year, the payments coming up and what the next year should bring, before and after withholding.
A company in the S&P 500 that has raised its dividend every year for at least 25 years in a row, and is large and liquid enough for S&P Dow Jones Indices to include it in the S&P 500 Dividend Aristocrats index. Coca-Cola, Johnson & Johnson and Procter & Gamble are among the best-known.
There are 69. S&P made no changes at its January 2026 review, so the list is the same one it set in February 2025, when Erie Indemnity, Eversource Energy and FactSet joined.
Dover, with 71 years of raises in a row. Emerson Electric, Genuine Parts and Procter & Gamble follow with 70.
On 23 October 2026 it was Clorox at 5.79%, ahead of Realty Income at 5.73%, Amcor at 5.64% and Hormel Foods at 5.56%. Yields move with the share price every day, and a high one can follow a price fall, so check the payout ratio before you buy for the yield.
Aristocrats need 25 years of raises and a place in the S&P 500. Kings need 50 years of raises and can be any US-listed company, of any size. 32 of today's 69 Aristocrats are also Kings. Kings outside the S&P 500, like American States Water, can't be Aristocrats while they stay outside it.
Buy the ProShares S&P 500 Dividend Aristocrats ETF (NOBL), which holds all 69 at equal weights, reset every quarter, and charges 0.35% a year, or buy the companies you want one by one. A dividend tracker shows the income from either and each raise as it comes.
Not in the last ten years: 9.85% a year against 15.33% to 30 September 2026. They fell less in the bad years, 6.21% against 18.11% in 2022, but recent returns were led by technology companies that pay small dividends or none.
Checked on 24 October 2026.
Yields are from AllInvestView's market data for the date shown and move every day. None of this is personal investment advice.