4.26% × √12SPY returned 26.18% in 2023 with a fairly calm ride. Over 2021 to 2025, with the 2022 bear market inside, its standard deviation was 15.14%.
Standard deviation tells you how far an investment's returns usually land from their average. Take a run of returns, measure how far each one sits from the average, square those gaps, average them and take the square root. Quoted as a yearly figure, it's the number most people mean by volatility: the bigger it is, the wider the swings, up and down.
On monthly returns from 2021 to 2025, the S&P 500 fund SPY had a standard deviation of 15.14% a year and Nvidia 50.76%. A portfolio's is lower than the average of its holdings: 60% SPY and 40% of the bond fund BND came to 10.89%, not the 11.63% you'd get by averaging the two.
Times √12 turns monthly returns into a yearly figure. SPY in 2023: the 12 squared gaps add up to 199.30. Divided by 11 and square-rooted, that's 4.26% a month, and × √12 = 14.75% a year.
SPY's 12 monthly returns in 2023, with dividends reinvested. The shaded band is one standard deviation either side of the average: 8 of the 12 months landed inside it.
4.26% × √12SPY returned 26.18% in 2023 with a fairly calm ride. Over 2021 to 2025, with the 2022 bear market inside, its standard deviation was 15.14%.
=STDEV.S(B2:B13)*SQRT(12)With the 12 monthly returns in B2:B13. STDEV.S divides by n − 1, the right choice for a price history. Use SQRT(52) for weekly and SQRT(252) for daily returns.
Paste the returns of one stock or fund, or build a portfolio from each holding's standard deviation and the correlations between them. It opens with SPY's 2023 from the example above.
The shaded band is one standard deviation either side of the average. The highlighted bars landed outside it.
Each holding's standard deviation, the weighted average, and the portfolio's own figure once the correlations are in.
A portfolio's standard deviation isn't the weighted average of its holdings'. When two holdings don't rise and fall together, part of one's swing cancels part of the other's, and the correlation between them decides how much.
SPY's standard deviation was 15.14%, BND's 6.37%, and the correlation of their monthly returns 0.64. Add three terms, then take the square root:
0.6² × 15.14² = 82.52SPY's own swings
0.4² × 6.37² = 6.49BND's own swings
2 × 0.6 × 0.4 × 0.64 × 15.14 × 6.37 = 29.63how the two move together
Stocks and bonds moved together in these years. In 2022 both fell as rates rose: SPY about 18%, BND about 13%. Gold moved more on its own.
| SPY | BND | GLD | |
|---|---|---|---|
| SPY | 1 | 0.64 | 0.14 |
| BND | 0.64 | 1 | 0.41 |
| GLD | 0.14 | 0.41 | 1 |
If SPY and BND had moved in perfect lockstep, the 60/40 would have swung by the full weighted average, 11.63%. Holding two things that always move together isn't diversification.
With no link between them, the same 60/40 would have come to 9.43%, less than two-thirds of SPY's own 15.14%, while keeping 60% in stocks.
Put 20 points of gold in place of BND and a 50% stock mix still comes to 9.91%, the same as plain 50/50 SPY and BND, though gold swung 14.47% to BND's 6.37%. Its correlation with SPY was only 0.14. More holdings means more pairs: three need three correlations, four need six. See correlation and the efficient frontier.
Sixty monthly returns each, with dividends reinvested, annualized the same way. Single stocks swing more than the funds that hold hundreds of them.












Annual return is the compounded yearly rate over the five years. Returns are before taxes and after each fund's own costs.
Their standard deviations were close, 50.76% and 59.87%. Nvidia compounded at 70.30% a year; Tesla at 13.84%, below SPY. Standard deviation measures the size of the ride, not where it ends.
A "steady" stock is still one company. KO's 16.85% and Johnson & Johnson's 16.25% both topped the S&P 500 fund's 15.14%, with about half its return.
BND had the lowest figure, 6.37%, and still lost money over the five years: −0.44% a year. A small standard deviation says the path was smooth, not that it went up.
394 monthly returns of SPY, from March 1993 to December 2025. They averaged 0.94% a month with a standard deviation of 4.26%, or 14.75% a year. If returns followed a bell curve, about 68% would sit within one standard deviation and 95% within two.
Far left: October 2008, −16.52%, four standard deviations below the average.
More months than a bell curve predicts sat close to the average, and almost twice as many fell more than two standard deviations. The years outside the band on the downside were 2000, 2001, 2002, 2008 and 2022. Standard deviation describes a normal month well and a crash poorly, which is why maximum drawdown and the Sortino ratio exist.
Measured on each year's daily returns, SPY's standard deviation ran from 6.74% in 2017 to 33.40% in 2020. A figure from one calm year tells you little about the next.
There's no official scale and no right number. These bands come from the holdings on this page over 2021 to 2025, so you can see where yours falls.
Under 8%: bond-likeBond funds and cash-heavy mixes. Smooth, with small returns.BND 6.37%
8% to 13%: balancedStock and bond mixes, and income funds that sell options.3-fund mix 9.91%JEPI 10.11%60/40 10.89%
13% to 20%: a stock marketBroad stock funds, gold, and the steadiest single stocks.SPY 15.14%VXUS 14.06%QQQ 19.33%KO 16.85%
Over 20%: concentratedSingle stocks, especially growth names, and narrow sector bets.MSFT 22.32%AAPL 24.51%NVDA 50.76%
A higher standard deviation is fine when it buys more return. The Sharpe ratio divides the return above the risk-free rate by the standard deviation, so you can compare SPY's 15.14% with a 60/40's 10.89% on the same footing.
At 15%, a year down 5% to 10% is ordinary, and 2022's −18% for SPY wasn't far outside it. If that would make you sell, a lower number suits you better than a higher return.
Same years, same return frequency. A figure from 2017 alone or from daily returns isn't comparable with a five-year monthly one.
Each one worked on SPY, where the right answer is 14.75% for 2023 and 15.14% for 2021 to 2025.
Variance grows with time; standard deviation grows with its square root. 4.26% a month × 12 gives 51.08%, more than three times the real 14.75%.
A weighted average ignores correlation and overstates the portfolio: 11.63% instead of 10.89% for the 60/40, and 12.37% instead of 9.91% with gold in.
For the same five years, SPY's daily returns × √252 give 17.12% and its monthly returns × √12 give 15.14%. Both are right for their frequency; mixing them isn't.
STDEV.P on SPY's 12 months of 2023 gives 14.12% against 14.75% with STDEV.S. A price history is a sample, so use n − 1. On 60 months the gap is small.
Use total returns. Price-only returns understate the average and slightly change the swings, more so for income funds that pay a lot of their return in cash.
It's a typical swing, not a floor. SPY's worst month since 1993 was four standard deviations down, and its deepest fall from 2021 to 2025 was −23.9%, measured month end to month end.
Each one answers a different question about the same ride. The figures are SPY's from 2021 to 2025.
| Measure | What it tells you | SPY, 2021 to 2025 |
|---|---|---|
| Standard deviation | How far returns usually land from their average, up or down. | 15.14% |
| Variance | The standard deviation squared. Portfolio maths works in variances, then takes the square root at the end. | 2.29% (0.0229) |
| Downside deviation | Only the shortfalls below a target, so big up months don't count as risk. | 9.75% |
| Maximum drawdown | The deepest fall from a peak before a new high: what sitting through the worst stretch felt like. | −23.9% |
| Beta | How much a holding moves with the market, rather than how much it moves at all. | 1.00 |
Downside deviation is against a 3.2% yearly target, the average 3-month Treasury bill rate over the five years. SPY's beta is 1.00 against the S&P 500 because it tracks it.
Your broker shows the accounts you hold there. AllInvestView puts the accounts you add together and works out the volatility of your stocks and funds, one by one and together, with the correlations between them.
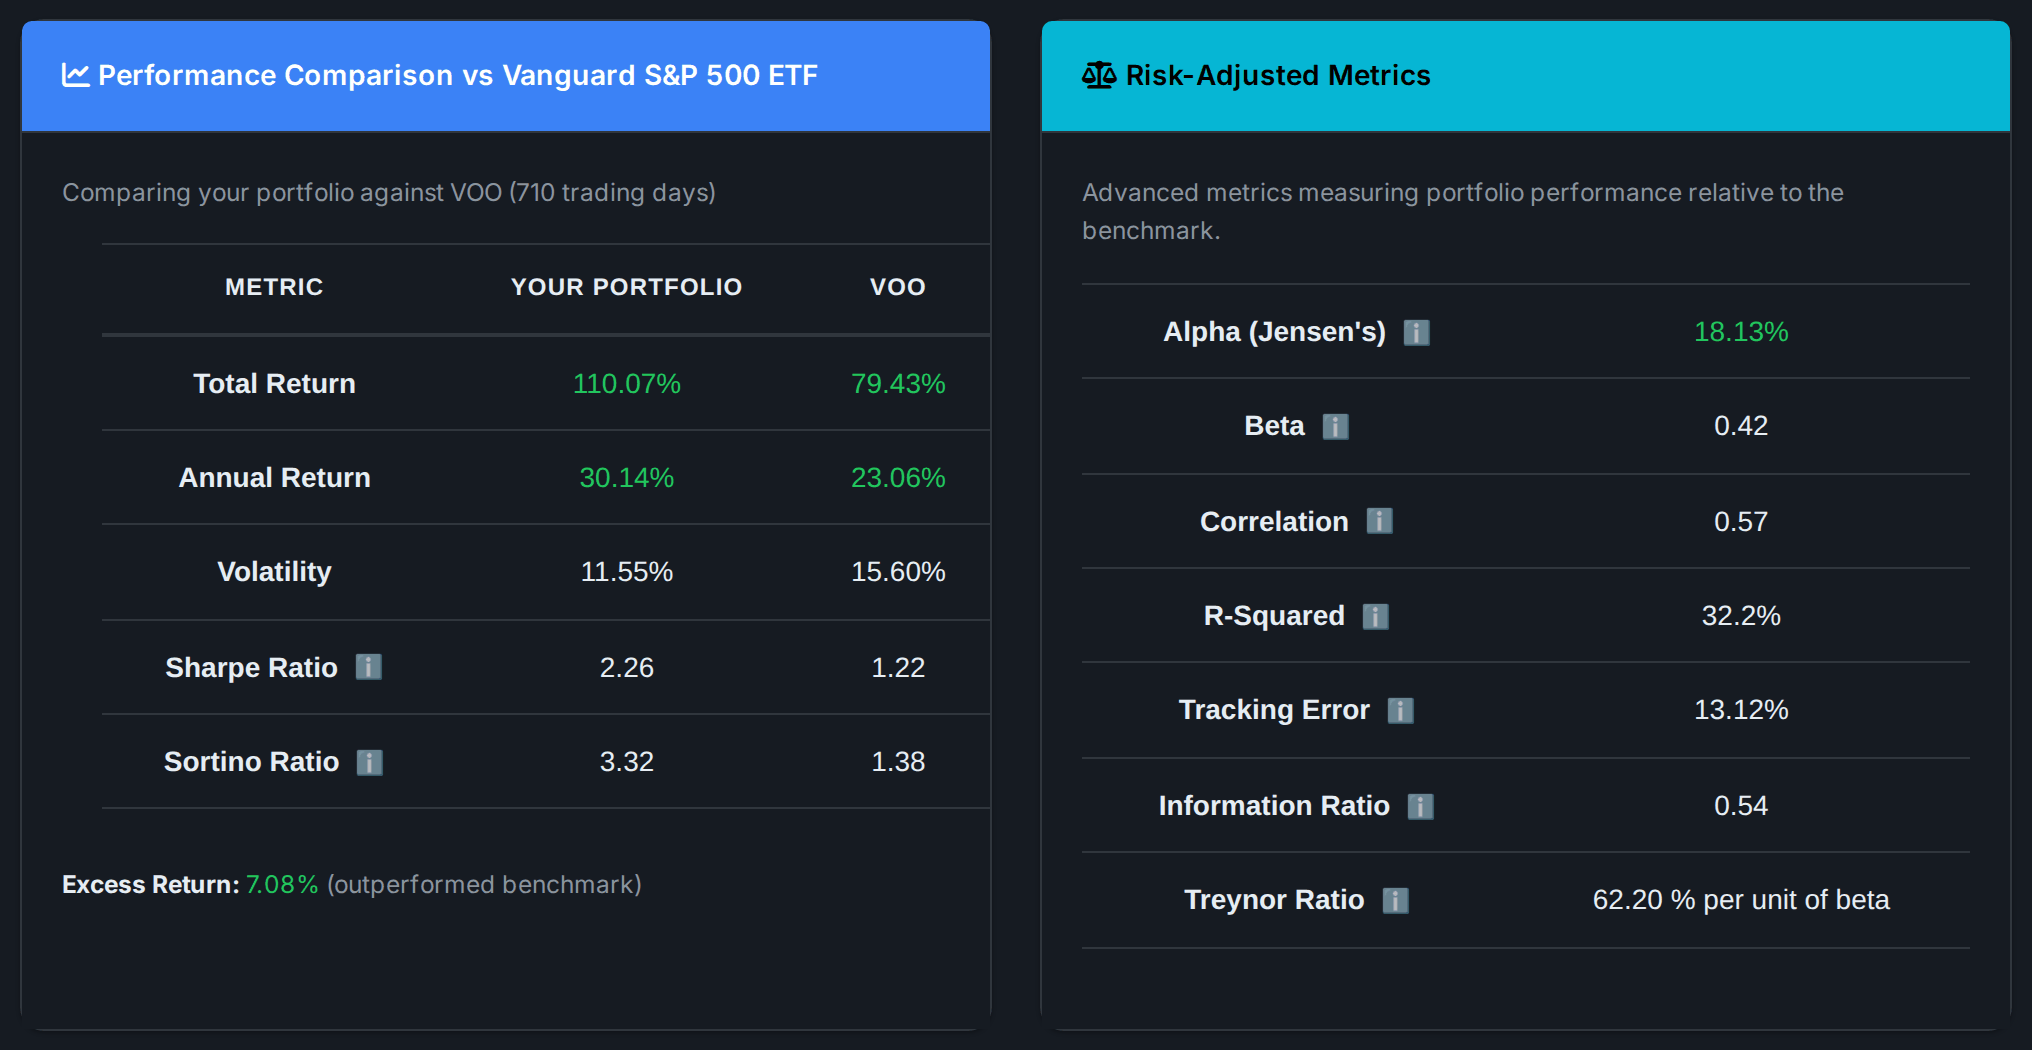
The analytics page puts the annualized standard deviation of your stocks and funds beside the index you chose, with the return, the Sharpe ratio and the beta. It takes the stocks and funds you hold now, across the accounts you add at any broker, and measures them over their past prices.
See the portfolio analyzer AllInvestView
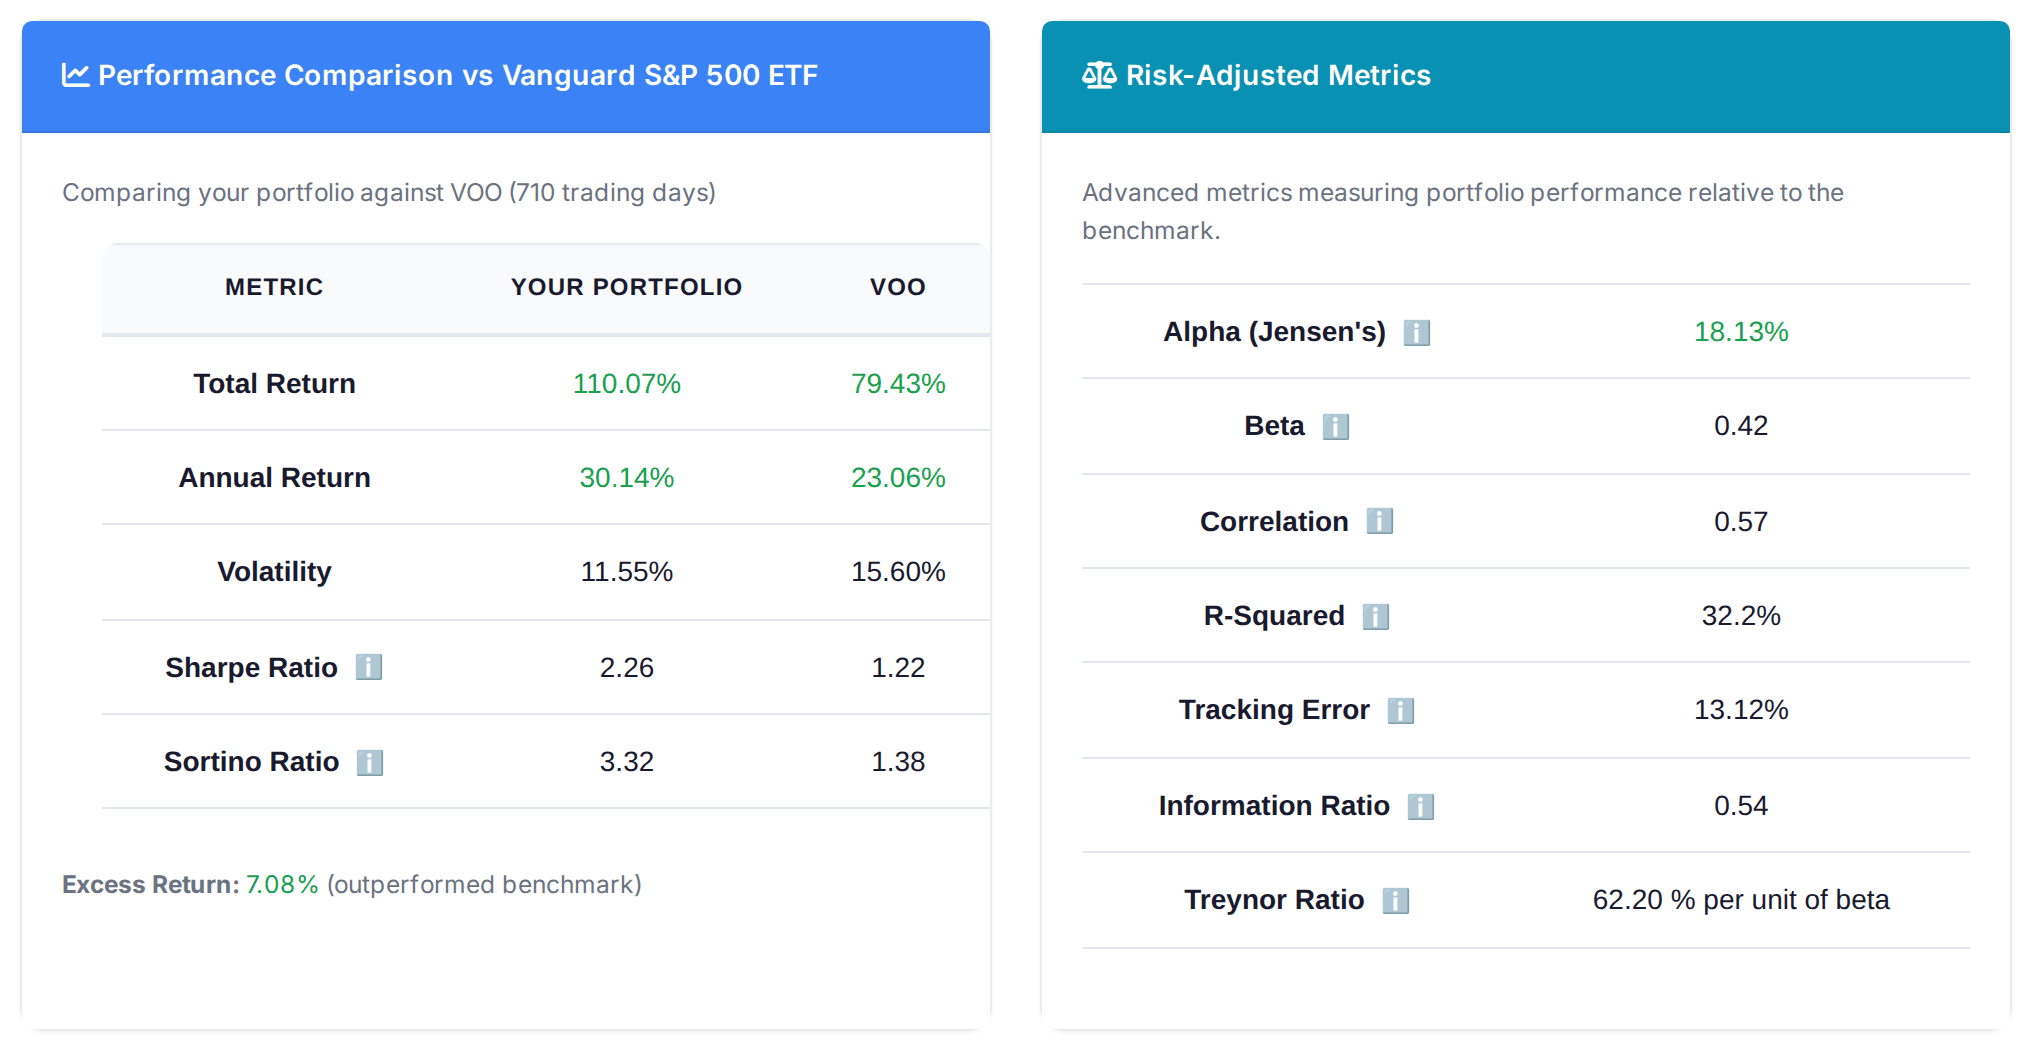
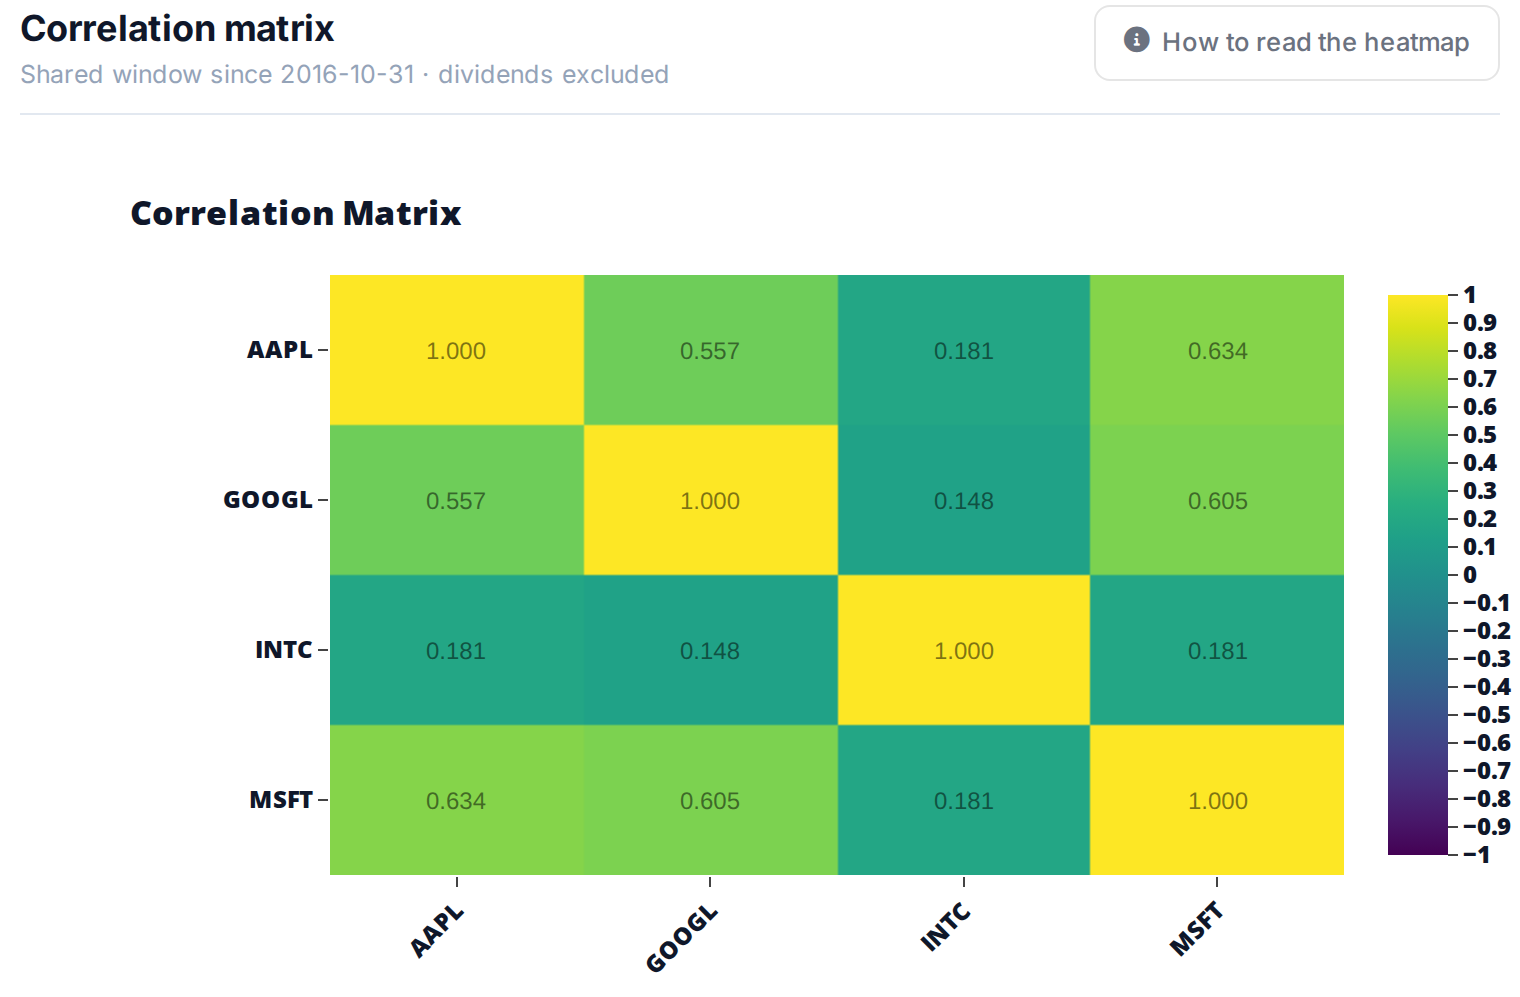
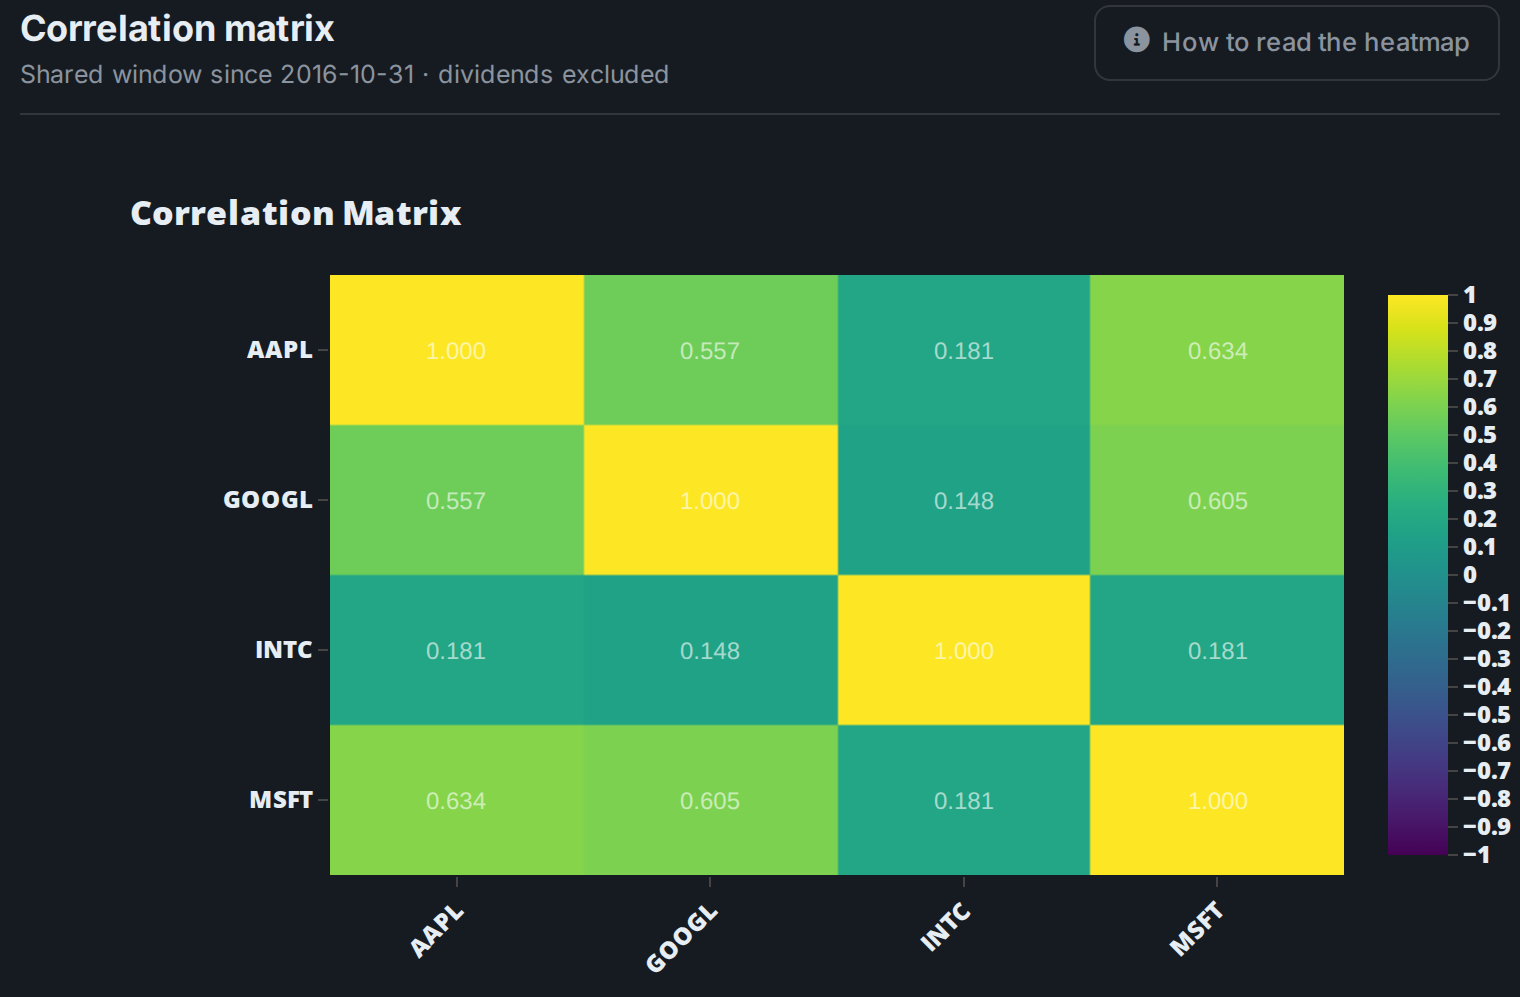
Every pair of your holdings, scored from −1 to 1 on their shared price history, so you can see which ones move together and which ones move on their own. The same correlations feed the efficient frontier, which works out the portfolio standard deviation of every mix of what you hold.
See the portfolio analyzerAllInvestView
Add every account you hold and see the volatility of your stocks and funds, one by one and together, next to your benchmark, with the correlations that bring it down. No spreadsheet of monthly returns to keep.
It's how far an investment's returns usually land from their average. A fund with a 10% average return and a 15% standard deviation has seen most of its years between about −5% and +25%. The bigger the number, the wider the swings, in both directions.
Take its monthly returns and their average. Subtract the average from each month, square the differences, add them up, divide by the number of months minus one and take the square root. Multiply by √12 for a yearly figure. SPY in 2023: 4.26% a month, 14.75% a year. In Excel, with the returns in B2:B13: =STDEV.S(B2:B13)*SQRT(12).
Not as the weighted average of each holding's standard deviation. For two holdings it's √(w₁²σ₁² + w₂²σ₂² + 2·w₁·w₂·ρ·σ₁·σ₂), where w is the weight, σ the standard deviation and ρ the correlation between them. A 60/40 mix of SPY and BND over 2021 to 2025 comes to 10.89%, below the 11.63% weighted average, because the two didn't move in lockstep.
There isn't one right number; it depends on what you hold and how much swing you can sit through. From 2021 to 2025, a total bond fund ran at 6.37%, a 60/40 stock and bond mix at 10.89%, the S&P 500 at 15.14% and Nvidia at 50.76%. Judge it next to the return it bought you, which is what the Sharpe ratio does.
About 15% a year on monthly returns: 14.75% for SPY from 1993 to 2025, and 15.14% for 2021 to 2025. Calendar-year returns from 1994 to 2025 averaged 12.27% with a standard deviation of 17.86%. It changes a lot from year to year: on daily returns it was 6.74% in 2017 and 33.40% in 2020.
Not by itself. It means bigger moves both ways. Nvidia's 50.76% came with a 70.30% annual return over 2021 to 2025; Tesla's 59.87% came with 13.84%. What matters is how much return you got for the swings and how deep the falls were, so read it next to the Sharpe ratio and the maximum drawdown.
STDEV.S, for a sample of returns, which is what a price history is. It divides by n − 1 instead of n. On SPY's 12 months of 2023 it gives 14.75% a year against 14.12% with STDEV.P. On 60 months the gap almost disappears.
Multiply by the square root of the number of periods in a year: √12 for monthly returns, √52 for weekly and √252 for daily. Not by 12: that turns SPY's 4.26% a month into 51.08% instead of 14.75%. Daily and monthly returns also give different answers for the same fund: 17.12% and 15.14% for SPY over 2021 to 2025.
Checked on 26 October 2026.
Returns are worked out by AllInvestView from closing prices with every dividend and distribution reinvested: month-end closes for 2021 to 2025 and for SPY from March 1993, daily closes for the yearly figures. Standard deviations are sample standard deviations (n − 1), annualized with √12 or √252; annual returns are compounded. None of it is investment advice.